Due to freely available, tailored software, Bayesian statistics is now the dominant paradigm for archaeological chronology construction in the UK and much of Europe and is increasing in popularity in the Americas. Such software provides users with powerful tools for Bayesian inference for chronological models with little need to undertake formal study of statistical modelling or computer programming. This runs the risk that it is reduced to the status of a black box, which is not sensible given the power and complexity of the modelling tools it implements. In this paper we seek to offer intuitive insight to ensure that readers from the archaeological research community who use Bayesian chronological modelling software will be better able to make well educated choices about the tools and techniques they adopt. Our hope is that they will then be both better informed about their own research designs and better prepared to offer constructively critical assessments of the modelling undertaken by others.
The Antarctic ice sheet (AIS) is the Earth’s largest store of frozen water; understanding how it changed in the past allows us to improve projections of how it, and sea levels, may change. Here, we use previous AIS reconstructions, water isotope ratios from ice cores, and simulator predictions of the relationship between the ice-sheet shape and isotope ratios to create a model of the AIS at the Last Glacial Maximum. We develop a prior distribution that captures expert opinion about the AIS, generate a designed ensemble of potential shapes, run these through the climate model HadCM3, and train a Gaussian process emulator of the link between ice-sheet shape and isotope ratios. To make the analysis computationally tractable, we develop a preferential principal component method that allows us to reduce the dimension of the problem in a way that accounts for the differing importance we place in reconstructions, allowing us to create a basis that reflects prior uncertainty. We use Markov chain Monte Carlo to sample from the posterior distribution, finding shapes for which HadCM3 predicts isotope ratios closely matching observations from ice cores. The posterior distribution allows us to quantify the uncertainty in the reconstructed shape, a feature missing in other analyses.
Two views of archaeological time are distinguished; an event view that models stratigraphic relations, and a substance view that models genealogical relations among artifacts, including the three modes of change represented by branching, transformation, and reticulation. Chronology construction is more complex in substance time than it is in event time, which only concerns transformation. Allen's interval algebra can be used to specify the chronological relations associated with the modes of change, and these relations can be identified by post-processing the output from Bayesian chronological models. A worked example illustrates how identifying the chronological relations can aid construction of a phyletic seriation of beads recovered from Anglo-Saxon female graves. These results might encourage archaeologists to carry out chronology construction in substance time as an aid to historical inference.
ABSTRACT Archaeologists frequently use probability distributions and null hypothesis significance testing (NHST) to assess how well survey, excavation, or experimental data align with their hypotheses about the past. Bayesian inference is increasingly used as an alternative to NHST and, in archaeology, is most commonly applied to radiocarbon date estimation and chronology building. This article demonstrates that Bayesian statistics has broader applications. It begins by contrasting NHST and Bayesian statistical frameworks, before introducing and applying Bayes's theorem. In order to guide the reader through an elementary step-by-step Bayesian analysis, this article uses a fictional archaeological faunal assemblage from a single site. The fictional example is then expanded to demonstrate how Bayesian analyses can be applied to data with a range of properties, formally incorporating expert prior knowledge into the hypothesis evaluation process.
Archaeologists often use data and quantitative statistical methods to evaluate their ideas. Although there are various statistical frameworks for decision-making in archaeology and science in general, in this chapter, we provide a simple explanation of Bayesian statistics. To contextualize the Bayesian statistical framework, we briefly compare it to the more widespread null hypothesis significance testing (NHST) approach. We also provide a simple example to illustrate how archaeologists use data and the Bayesian framework to compare hypotheses and evaluate their uncertainty. We then review how archaeologists have applied Bayesian statistics to solve research problems related to radiocarbon dating and chronology, lithic, ceramic, zooarchaeological, bioarchaeological, and spatial analyses. Because recent work has reviewed Bayesian applications in archaeology from the 1990s up to 2017, this work considers the relevant literature published since 2017.
A wealth of digital data are produced during an archaeological excavation and because so much of the fieldwork is unrepeatable, once the site is fully excavated, the digital records must be archived in a manner that best fYacilitates reuse. This paper presents three case studies of users wishing to reuse digital archaeological data from online repositories, with a specific focus on absolute and relative dating evidence. We discuss the problems encountered and how they reflect the wider issues of the reuse of digital archaeological data. Additionally, we provide recommendations specific to chronological data that seek to address the problems.
Understanding the effect warming has on ice sheets is vital for accurate projections of climate change. A better understanding of how the Antarctic ice sheets have changed size and shape in the past would allow us to improve our predictions of how they may adapt in the future; this is of particular relevance in predicting future global sea level changes. This research makes use of previous reconstructions of the ice sheets, ice core data and Bayesian methods to create a model of the Antarctic ice sheet at the Last Glacial Maximum (LGM). We do this by finding the relationship between the ice sheet shape and water isotope values. We developed a prior model which describes the variation between a set of ice sheet reconstructions at the LGM. A set of ice sheet shapes formed using this model was determined by a consultation with experts and run through the general circulation model HadCM3, providing us with paired data sets of ice sheet shapes and water isotope estimates. The relationship between ice sheet shape and water isotopes is explored using a Gaussian process emulator of HadCM3, building a statistical distribution describing the shape of the ice sheets given the isotope values outputted by the climate model. We then use MCMC to sample from the posterior distribution of the ice sheet shape and attempt to find a shape that creates isotopic values matching as closely as possible to the observations collected from ice cores. This allows us to quantify the uncertainty in the shape and incorporate expert beliefs about the Antarctic ice sheet during this time period. Our results suggests that there may have been a thicker West Antarctic ice sheet at the LGM than previously estimated.
Debido a la disponibilidad de software gratuito y disenado especificamente, el paradigma bayesiano se ha conviertido rapidamente en el dominante para la construccion de cronologias. Estos programans facilitan el uso de herramientas tipicamente muy sofisticadas, para llevar a cabo inferencia bayesiana con modelos de cronologias; requiriendo del usuario muy poco entendimiento de las tecnicas estadisticas y de programacion que esta involucra. Esto conlleva el riesgo de que estos programas sean poco mas que una caja negra, lo que seria poco sensato dadas la complejidad y potencia de las herramientas a disposicion. en este articulo ofrecemos una descripcion intuitiva que permita hacer una eleccion fundamentada de los modelos, tecnicas y parametros a los usuarios de este sofware. Tambien hacemos esto en espera de que sea de ayuda para la evaluacion critica y constructiva de los modelos e inferencias presentadas por otros autores.
Tree‐ring dating involves matching sequences of ring widths from undated timbers to dated sequences known as ‘master’ chronologies. Conventionally, the undated timbers (from a building or woodland) are sequentially matched against one another, using t‐tests to identify the relative offsets with the ‘best’ match, thus producing a ’site’ chronology. A date estimate is obtained when this is matched to a local master chronology of known calendar age. Many tree‐ring sequences in the UK produce rather low t‐values and are thus declared not to have a ‘best’ match to a master chronology. Motivated by this and the routine use of Bayesian statistical methods to provide a probabilistic approach to radiocarbon dating, this paper investigates the practicality of Bayesian dendrochronology. We explore a previously published model for the relationship between ring widths and the underlying climatic signal, implementing it within the Bayesian framework via a simulation‐based approach. Probabilities for a match at each offset are produced, removing the need to identify a single ‘best’ match. The Bayesian model proves successful at matching in both simulated and real examples.
Creating more accurateTurner, Fiona reconstructions of past Antarctic ice sheet shapes allows us to better predict how theyWilkinson, Richard will vary in the changing climate and contributeBuck, Caitlin to future sea level changes. In thisJones, Julie research, we use expert elicitation to create a subjective prior distribution of the Antarctic ice sheets at theSime, Louise Last Glacial Maximum (LGM), 21Ka. A design of shapes from this distribution will be run through the global climate model HadCM3, providing us with output that we can compare with proxy data to find a better estimate of the ice sheet shape at the LGM.
The development of photocatalytic technology has grown significantly since its initial report and as such, a number of screening methods have been developed to assess activity. In the field of environmental remediation, a crucial factor is the formation of highly oxidising species such as OH radicals. These radicals are often the primary driving force for the removal and breakdown of organic and inorganic contaminants. The quantification of such compounds is challenging due to the nature of the radical, however indirect methods which deploy a chemical probe to essentially capture the radical have been shown to be effective. As discussed in the work presented here, optimisation of such a method is fundamental to the efficiency of the method. A starting concentration range of coumarin from 50μmol/L to 1000μmol/L was used along with a catalyst loading of 0.01g/L to 1g/L TiO2 to identify that 250μmol/L and 0.5g/L TiO2 were the optimum conditions for production. Under these parameters a maximum production rate of 35.91μmol/L (Rmax=0.4μmol/L OH min−1) was achieved which yielded at photonic efficiency of 4.88 OH moles photon−1 under UV irradiation. The data set presented also highlighted the limitations which are associated with the method which included; rapid exhaustion of the probe molecule and process inhibition through UV light saturation. Identifying both the optimum conditions and the potential limitations of the process were concluded to be key for the efficient deployment of the photocatalytic screening method.
AbstractThe cycle of modules that lead from climate forcings to the fossil proxy data from which we try to infer past climate. Key climate forcings such as the Sun's energy are reflected in sensors such as the pollen produced by vegetation, which is then archived in lake sediment. View Figure We review the statistical methods currently in use to estimate past changes in climate. These methods encompass the full gamut of statistical modeling approaches, ranging from simple regression up to nonparametric spatiotemporal Bayesian models. Often the full inferential challenge is broken down into many submodels each of which may involve multiple stochastic components, and occasionally mechanistic or process‐based models too. We argue that many of the traditional approaches are simplistic in their structure, handling, and presentation of uncertainty, and that newer models (which incorporate mechanistic aspects alongside statistical models) provide an exciting research agenda for the next decade. We hope that policy‐makers and those charged with predicting future climate change will increasingly use probabilistic paleoclimate reconstructions to calibrate their forecasts, learn about key natural climatological parameters, and make appropriate decisions concerning future climate change. Remarkably few statisticians have involved themselves with paleoclimate reconstruction, and we hope that this article inspires more to take up the challenge.This article is categorized under:Applications of Computational Statistics > Computational Climate Change and Numerical Weather Forecasting
New radiocarbon calibration curves, IntCal04 and Marine04, have been constructed and internationally ratified to replace the terrestrial and marine components of IntCal98. The new calibration data sets extend an additional 2000 yr, from 0–26 cal kyr BP (Before Present, 0 cal BP = AD 1950), and provide much higher resolution, greater precision, and more detailed structure than IntCal98. For the Marine04 curve, dendrochronologically-dated tree-ring samples, converted with a box diffusion model to marine mixed-layer ages, cover the period from 0–10.5 cal kyr BP. Beyond 10.5 cal kyr BP, high-resolution marine data become available from foraminifera in varved sediments and U/Th-dated corals. The marine records are corrected with site-specific 14C reservoir age information to provide a single global marine mixed-layer calibration from 10.5–26.0 cal kyr BP. A substantial enhancement relative to IntCal98 is the introduction of a random walk model, which takes into account the uncertainty in both the calendar age and the 14C age to calculate the underlying calibration curve (Buck and Blackwell, this issue). The marine data sets and calibration curve for marine samples from the surface mixed layer (Marine04) are discussed here. The tree-ring data sets, sources of uncertainty, and regional offsets are presented in detail in a companion paper by Reimer et al. (this issue).
Comment on "Radiocarbon calibration curve spanning 0 to 50,000 years BP based on paired Th-230/U-234/U-238 and C-14 dates on pristine corals" by R.G. Fairbanks et al. (Quaternary Science Reviews 24 (2005) 1781-1796) and "Extending the radiocarbon calibration beyond 26,000 years before present using fossil corals" by T.-C. Chin et al. (Quaternary Science Reviews 24 (2005) 1797-1808) Reimer, PJ; Baillie, MGL; McCormac, G; Reimer, RW; Bard, E; Beck, JW; Blackwell, PG; Buck, CE; Burr, GS; Edwards, RL
Comment on "Radiocarbon calibration curve spanning 0 to 50,000 years BP based on paired Th-230/U-234/U-238 and C-14 dates on pristine corals" by R.G. Fairbanks et al. (Quaternary Science Reviews 24 (2005) 1781-1796) and "Extending the radiocarbon calibration beyond 26,000 years before present using fossil corals" by T.-C. Chin et al. (Quaternary Science Reviews 24 (2005) 1797-1808) Reimer, PJ; Baillie, MGL; McCormac, G; Reimer, RW; Bard, E; Beck, JW; Blackwell, PG; Buck, CE; Burr, GS; Edwards, RL
The design of photocatalytic reactors for use in bacterial disinfection studies is often based on defined laboratory conditions, which are not a true representation of the harsh and ever-changing environment that bacteria encounter in nature. In this study four parameters (growth phase, biofilm production, pH and irradiation source) subject.to continuous flux in nature,. which could affect the efficacy of photocatalytic disinfection stndies were examined and their importance in process design was considered. The results produced a number of key findings which should be taken into consideration when designing photocatalytic reactors for biological processes. Using Escherichia coli as a model organism, studies of effects of pH and bacterial growth phase showed that cells in the stationary phase and at a pH of 8 were more resistant to photocatalytic breakdown. Only at a pH of 4 and while in the logarithmic growth phase, was complete photocatalytic destruction achieved. This process was further enhanced by replacing six 8 W black lamps with a single high-power UV-LED operated at 1.05 W. The impact of virulence was investigated by comparing photocatalytic destruction of a biofilm producing and non-producing strain of Staphylococcus epidermidis. The results indicated that there were no differences in susceptibility to disinfection suggesting that the capacity alone to express a virulence factor may not generate greater resistance to photocatalytic destruction.
 Paul Blackwell合作论文数School of Mathematics and Statistics, Faculty of Science, The University of Sheffield22
 Edouard Bard合作论文数College de France;CEREGE17
 Ron W Reimer合作论文数University Belfast17
 John R. Southon合作论文数School of Physical Sciences, University of California, Irvine16
 Thomas P. Guilderson合作论文数Center for Accelerator Mass Spectrometry;Lawrence Livermore National Laboratory;Center for Accelerator Mass Spectrometry, Lawrence Livermore National Laboratory16
 Paula Reimer合作论文数School of Natural and Built Environment, Queen's University Belfast16Michael Friedrich合作论文数15Bernd Kromer合作论文数Klaus Tschira Laboratory of Scientific Dating15
 Christopher Bronk Ramsey合作论文数School of Archaeology, University of Oxford;Merton College, University of Oxford15
 Alan G. Hogg合作论文数Radiocarbon Dating Laboratory, University of Waikato15
 Konrad A. Hughen合作论文数Woods Hole Oceanographic Institution;Department of Marine Chemistry & Geochemistry;Department of Marine Chemistry & Geochemistry, Woods Hole Oceanographic Institution14
 Anthony O'Hagan合作论文数School of Mathematics and Statistics, The University of Sheffield13J. Warren Beck合作论文数Department of Physics;University of Arizona;Department of Physics, University of Arizona13
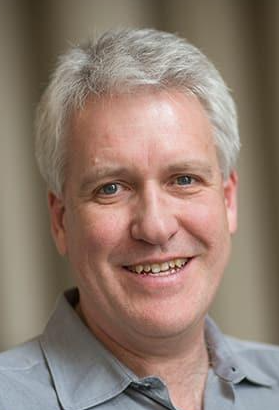 Sturt Manning合作论文数Department of Classics, The College of Arts Sciences, Cornell University;Cornell Tree Ring Laboratory, Cornell University12
 George Burr合作论文数11
 Hans Plicht合作论文数Leiden University;Isotope Research — Energy and Sustainability Research Institute Gron, Faculty of Science and Engineering, University of Groningen11Jenkinson David J合作论文数11
 Paul H. Garthwaite合作论文数Department of Statistics, Open University11
 Jeremy Oakley合作论文数School of Mathematics and Statistics, Faculty of Science, The University of Sheffield11Tim Rakow合作论文数11
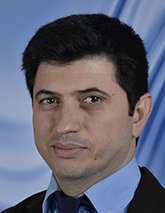 Alireza Daneshkhah合作论文数Department of Probability and Statistics;University of Sheffield;Department of Probability and Statistics, University of Sheffield11
 Richard Lawrence Edwards (艾思本)合作论文数Department of Geology and Geophysics,University of Minnesota11J. Richard Eiser合作论文数Centre for Research in Social Attitudes, Department of Psychology, Faculty of Science, The University of Sheffield11Gerry McCormac合作论文数10Constanze E Weyhenmeyer合作论文数9
 Timothy Heaton合作论文数School of Mathematics and Statistics, Faculty of Science, The University of Sheffield9
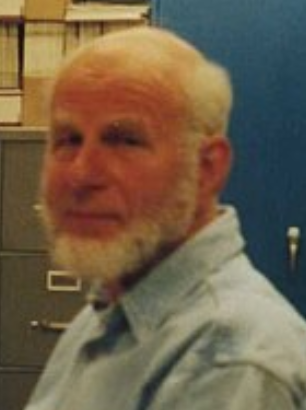 Minze Stuiver合作论文数Quaternary Research Center, University of Washington9C. D. Litton合作论文数8
 Christian S. M. Turney(Chris Turney)合作论文数Earth and Sustainability Science Research Centre, School of Biological, Earth and Environmental Sciences, Faculty of Science, The University of New South Wales7
 David A. Richards合作论文数School of Geography, University Walk6
 J. Andrés Christen合作论文数Centro de Investigación en Matemáticas A.P.;LLNL Center for Accelerator Mass Spectrometry, University of California Livermore;Institute of Marine Science and Department of Ocean Sciences, University of California Santa Cruz;University of California Livermore, University of California Livermore6Mike G L Baillie合作论文数6
 Irka Hajdas合作论文数Lab Ion Beam Phys, ETH6
 Alex Bayliss合作论文数University of Stirling6felix kaiser合作论文数5
 Pieter M. Grootes合作论文数Institute for Ecosystem Research, Kiel University;Leibniz-Labor für Altersbestimmung und Isotopenforschung, Christian-Albrechts-Universität zu Kiel5
 Thomas S. Dye合作论文数5Mu Niu合作论文数Univ Sheffield, Sch Math & Stat, Sheffield S3 7RH, S Yorkshire, England4
 Marian Scott合作论文数School of Mathematics and Statistics, University of Glasgow4
 Haflidi Haflidason合作论文数Department of Earth Science, University of Bergen4Regine Röthlisberger合作论文数British Antarctic Survey4
 Christine Hatté合作论文数Laboratoire des Sciences du Climat et de lEnvironnement;Silesian University of Technology4M. G. L. Baillie合作论文数4Kirsten B Cutler合作论文数4Sabine Remmele合作论文数4Mark McClure合作论文数3Richard Wilkinson合作论文数3
 Fiona Turner合作论文数Dept Geog, Kings Coll London3
 David Brown合作论文数Nottingham Trent Univ, Nottingham, England3




