Coccolithophores are vital to marine ecosystems and play a central role in the global carbon cycle. Although abundant in the temperate North Atlantic and Barents Sea, their long-term bloom dynamics remain poorly understood. Using two decades of satellite observations, we reveal a substantial decline in coccolithophore blooms between 2003 and 2022, with a 36.1% reduction in bloom area and a 51.2% decrease in bloom frequency. The decline is most pronounced in the temperate North Atlantic and western Barents Sea, while the eastern Barents Sea shows notable increases. Decreasing sea surface temperatures (SSTs) in the North Atlantic and warming in the eastern Barents Sea are identified as key drivers of these trends. However, SST changes alone do not explain the asymmetric patterns across the Barents Sea, suggesting additional environmental drivers and phytoplankton competition. Our study provides the most spatially and temporally resolved assessment of coccolithophore bloom trends in this region to date, with broader implications for marine ecosystems and carbon cycling.
Satellite remote sensing is a critical tool for monitoring and assessing the spatial distribution and temporal changes of the pelagic Sargassum macroalgae in the Atlantic Ocean. However, to date, most efforts have relied on medium-resolution satellite sensors such as MODIS. While case studies have shown the potential of high-resolution sensors such as Sentinel-2 MSI, large-scale systematic mapping of Sargassum using such sensors has been lacking due to several technical issues, such as “contamination” by sun glint and striping noise. Here, we develop a practical approach with an improved model to minimize the impacts of these contaminations for large-scale Sargassum mapping using MSI observations, then evaluate the performance of this approach over the entire Wider Caribbean Region (WCR) for all months in 2023. The improved deep-learning model through a Transformer-ResUNet architecture works efficiently even under non-optimal scenarios such as thin clouds (NIR reflectance < ∼ 0.053) and strong sun glint (LGN < ∼ 0.035 sr−1), thus increasing the number of valid observations substantially compared with the previously developed baseline model. The model performance also improved, with the overall density-weighted F1-score increasing from 0.88 in the baseline model to 0.91 in the current model, and recall increasing from 0.81 to 0.86. The performance is further evaluated against MODIS observations, with strengths and limitations in both datasets quantified at daily, monthly, and annual scales. This analysis also enables a more complete understanding of uncertainties in MODIS-derived Sargassum observations. Between March and September, when large amounts of Sargassum are observed, MSI and MODIS show similar spatial patterns and Sargassum amounts in the WCR. In other months, however, MODIS significantly underestimated Sargassum amounts, with MSI detecting at least 5 times more Sargassum in October. This is attributed to MSI's capacity to detect small Sargassum mats, as the lower detection limit of MSI is 2 m2 (0.51%) in a 20-m pixel, much lower than the 2,000 m2 (0.2%) in a 1-km MODIS pixel. The 5th percentile of the density after aggregating MSI data to 1-km resolution, 0.015%, is also much lower than the MODIS detection limit of 0.2%. The same reason can also explain MSI's superior performance over MODIS for nearshore waters (within 10 km from the shoreline), where the merging of MSI and MODIS can effectively fill the nearshore data gaps at weekly to monthly scales. Currently, the approach has been implemented in the Sargassum Watch System for selected coastal regions to improve monitoring of coastal waters. While implementing for large-scale near-real-time applications still requires considerable computing resources, inclusion of such a merged data product at a monthly scale can substantially improve the assessment accuracy, especially in winter months and over nearshore waters.
Harmful algal blooms (HABs) caused by Karenia brevis (commonly known as 'red tides') have a long occurrence history on the West Florida Shelf (WFS). While recent history shows roughly annual frequency, it is unclear if these blooms have changed in severity over the past few decades. Elucidating any such changes is notoriously difficult due to differences in field sampling effort over time, lack of reliable and appropriately scaled algorithms for quantifying bloom extent or severity, and methodological inconsistencies within and across detection methods. This study combines in situ measurements with observations from multiple satellite sensors to characterize red tides on the WFS, which spans the entire Gulf Coast of Florida. The analysis considers subregions including the Panhandle, Big Bend, Central West Florida Shelf, and Southwest Florida Shelf, extending to the Florida Keys. To provide a long-term perspective, MODIS observations from 2003 to 2019 were scaled to CZCS observations from 1978 to 1986. The scaling factors were determined by downgrading MODIS data quality to mimic the 8-bit CZCS data quality, spectral bands, and revisit frequency. A more equitable comparison was therefore obtained by comparing red tide metrics for CZCS and MODIS after applying the scaling factors to MODIS. The integrated red tide data record indicates that, for the entire WFS, the seasonality is similar between these two time periods, with blooms typically initiating, growing, and peaking in fall. However, both the annual bloom footprint (BF, the areal extent of blooms) and the bloom frequency-weighted footprint (BFWF, the cumulative area adjusted by the frequency of occurrence) were approximately twice as large during the MODIS era as compared to the CZCS era. For example, the HAB annual occurrence probability in fall increased from 75.0% during the CZCS era to more than 90.0% during the MODIS era, whereas the mean duration of red tide events increased from 3.0 months in the CZCS era to 6.1 months in the MODIS era. In the "epicenter" region from Tampa Bay to Charlotte Harbor, the annual probability of fall bloom occurrence increased, yet the mean BFWF remained largely unchanged. This stability in bloom intensity within the core area indicates that the observed increases in extent and duration mainly reflect HAB expansion into other parts of the WFS. This suggests that additional environmental or climatic factors during the MODIS era promoted the broader spatial spread of red tides.
The Persian (Arabian) Gulf is one of the world’s most important regions for oil production and maritime transportation, and it has long experienced chronic oil pollution associated with port activities, ship traffic, and platform operations. In early 2026, regional conflict introduced additional oil spill risks, potentially altering the spatial and temporal patterns of oil pollution across the Gulf. Using multi-sensor satellite observations, this study compares oil spill events during February–March 2026 with those observed during the same period in 2025 in order to identify anomalies in spill frequency, spatial distribution, and ecological exposure. The analysis includes a basin-scale statistical assessment in three zones and a focus on the Kharg region and the Khuran Strait-Hara wetland system, both of which experienced long-duration spill events. Results indicate that the weighted oil area in March 2026 was approximately twice the background level in all three zones. Near Kharg Island, continuous oil spills were found, with the maximum oil area during the analysis period reaching 255.5 km2. In the Khuran Strait-Hara wetland region, continuous vessel leakage resulted in thick oil slicks in the strait and near the adjacent Hara Mangrove Reserve, indicating potential ecological risks to this sensitive coastal ecosystem. At the time of this analysis, cleanup operations were hindered by the ongoing conflict, and additional oil slicks observed after March 2026 suggest that the spills continued. These results highlight the effectiveness of integrated multi-sensor satellite data for timely oil spill monitoring, thereby supporting impact assessment in regions where field access is constrained.
In March 2023, a massive fish mortality event occurred in the lower Darling River in the south-east of Australia, which led to extensive media coverage. Yet to date the information on this event is incomplete and the severity of the event has not been quantified. Here, using Planet SuperDove observations from the CubeSat constellation, we demonstrate how to detect and quantify dead fish in the aquatic environment. The 4-m resolution daily imagery revealed the start, evolution, and end of the event. In this river with an average width of similar to 40 m, the maximum detected areal coverage of dead fish reached similar to 88,209 m(2), corresponding to an estimated 4.0-8.0 million dead fish on the peak day. The reflectance spectral shapes from the dead-fish pixels appear similar to those measured in the field from another event, and they also differ from many other floating materials. The same method was also applied to a fish mortality event in Tampa Bay (Florida, USA) due to a harmful algal bloom, with successful detection that matched field reports. Because of the near real-time availability of the high-resolution high-revisit data from the Planet CubeSat constellation, this proof-of-concept study suggests that, with the knowledge of lower-detection limit and spectral characteristics of dead fish, a monitoring system can be established for near-real-time response at least for places with historical fish mortality events, and more CubeSat constellations in the future may eventually lead to a system to detect fish schools in surface waters.
Sargassum inundations around the Caribbean Sea and Gulf of Mexico, especially since the emergence of the Great Atlantic Sargassum Belt in 2011, have promoted the use of various remote sensing techniques in monitoring and tracking this brown macroalgae. Among these are the Sentinel-2 MultiSpectral Instruments (MSI) that provide 10-m ground resolution and 5-day revisits for subtropical and tropical waters. However, MSI imagery is often impacted by strong sun glint during the Sargassum season of March-September, creating data gaps or inconsistencies in the estimated Sargassum density among adjacent paths. Here, using overlapping pixels between Sentinel-2A and Sentinel-2B images where only one of them is under strong sun glint, we develop an empirical correction scheme to force Sargassum estimates under strong sun glint to agree with those under minimal sun glint. The correction is based on the surface roughness estimated directly from statistics of Sargassum-free water pixels near the Sargassum patches. Application of the correction scheme shows that the glint-induced overestimation of Sargassum density has been reduced substantially, with mean absolute error (MAE) decreased from 22.8% to 6.3% and root mean square error (RMSE) dropped from 25.6% to 7.7%. These results demonstrate that the proposed approach can substantially reduce uncertainties in Sargassum quantification from both Sentinel-2A and Sentinel-2B and therefore support its integration into the currently operational Sargassum Watch System (SaWS).
Surface fronts are common features across the world's oceans, particularly in estuarine and coastal regions where the merging of freshwater and saltwater creates strong density gradients. It has long been documented that fronts in these regions can trap and concentrate various properties such as floating debris, nutrients, larvae, and other buoyant materials. The prediction of such fronts has important implications for environmental protection, search and rescue operations, and scientific research. However, the realistic simulation of such features remains a challenge. In this study, we apply a high‐resolution, numerical circulation model of Tampa Bay and the adjacent West Florida Shelf to predict surface fronts by computing surface convergence. The accuracy of the simulation is evaluated using drone and satellite imagery. The simulated convergence fields are then analyzed by a Self‐Organizing Map, an unsupervised machine learning method. Our findings show that convergence patterns vary with tidal phases (ebb and flood) as well as the spring–neap tidal cycle. This study provides a new framework for improving monitoring strategies and reducing observational bias. Although every estuary is unique, the physical mechanisms of frontogenesis are universal. Therefore, the method we propose can be applied to other estuarine systems and serve as a valuable tool for interdisciplinary research in estuarine and coastal environments.
The Great Atlantic Sargassum Belt was established in 2011, resulting in the unprecedented accumulation of pelagic sargassum in the North Equatorial Recirculation Region (NERR), leading to severe sargassum influxes for the Caribbean. These influxes have been causing socio-economic challenges for the Caribbean region, particularly impacting the fisheries and tourism industries that are critical to the region’s economy. Since then, sargassum abundance inside the Caribbean has varied both seasonally - peaking in the summer months - and inter-annually, with much higher abundance in some years than others (e.g. 2018). Caribbean Sargassum variability appears to reflect the combined effects of upstream biomass supply, current-driven connectivity, seasonal atmospheric forcing, and interannual climate-ocean variability. This was determined by mixed-effects models performed using a Cosinor Model with Generalized Linear Mixed Modelling and a correlation matrix. Lagrangian analyses using currents and windage were also conducted to understand the connection between the ‘upstream’ NERR and the Caribbean, and integrated with the linear model analysis. We find that the Caribbean and the NERR have different seasonal and inter-annual variation. This is partly due to the connectivity between the two regions which helps explains movement from the source region into the Caribbean, and we find that drift from the NERR subject to 0% windage best explains Sargassum biomass in the Caribbean. At the seasonal scale, the variables linked to Sargassum variation in the Caribbean are NERR Sargassum biomass and Caribbean surface winds and sea surface salinity (SSS), along with the position of the Inter-tropical Convergence Zone (ITCZ) which contributes to the shifts in the timing of seasonal peaks. On the inter-annual scale, the Atlantic Meridional Mode (AMM) is linked to sargassum variability. Our findings can thus help improve models to forecast sargassum strandings in the Caribbean at the seasonal timescale, contributing to improved management.
A satellite-based Sargassum Watch System (SaWS) has been developed and operated as a decision support tool. SaWS generates near real-time satellite imagery tailored for pre-defined regions to monitor and track large mats of pelagic Sargassum macroalgae in the Atlantic Ocean. Integration of surface currents in Google Earth makes it possible to forecast short-term Sargassum movement. Based on SaWS, monthly bulletins of current and future Sargassum outlooks have been generated and distributed to various stakeholders since January 2018. Incorporating high-resolution (4 - 10 m) imagery further enhances its value for local users. Through Google Analytics, reviews of literature and media coverage, and a user survey, we show how such an online tool has been used by various stakeholders to address societal needs. As macroalgae blooms and microalgae surface scums have shown increasing trends in global oceans, similar online tools may be developed for other regions (e.g., Yellow Sea, East China Sea), especially when considering more satellite data will become available at the global scale.
While the emergent Great Atlantic Sargassum Belt has caught extensive attention on its initiation, maintenance, and environmental and socioeconomic impacts, much less attention has been given to how Sargassum mats may change the local thermal environments. Here, using 9243 pairs of Landsat OLI and TIRS images collected over the Wider Caribbean during 2025, a record year of Sargassum proliferation, we assess temperature anomalies of Sargassum pixels referenced against nearby waters. Temperature anomalies of Sargassum pixels are found to increase with Sargassum pixelwise density due primarily to the mixing effect. For the same density, temperature anomalies decrease with increasing winds until about 6 m/s. After accounting for the mixing effects (fractional cover within a 30-m pixel and mismatch between 30-m Sargassum pixel and 100-m thermal pixel), this study estimates that 25% of individual Sargassum mats from the 100%-density pixels would have positive temperature anomalies of similar to 1 degrees C, and a smaller percentage can have positive temperature anomalies reaching 2 degrees C. Such temperature anomalies are also found to change seasonally due to changes in solar insolation and winds. These findings have profound ecological and biological implications.
High-resolution optical remote sensing can capture fine-scale sea surface texture and dynamics, and thus offers a valuable means for estimating surface winds and wave fields. Wind streaks, as direct indicators of wind forcing and roll vortices, have rarely been investigated in optical imagery. In this study, a diagnostic detection method for wind streaks based on cross-spectral analysis is developed using Sentinel-2 Multispectral Instrument (MSI) imagery. The algorithm is adapted from the previously published Angular Spectral Analysis (ASA) and combined with the inter-band time lag to determine the unambiguous wind direction. The cross-spectral framework further distinguishes wind waves from swells, enabling the estimation of wind wave direction, wavelength, and period. We compiled 965 MSI-buoy matchups (2016–2024), from which 157 wind streak scenes were detected and validated. The retrieved wind directions agree well with buoy observations with RMSE = 7.6°. Numerical simulations and synoptic-scale MSI images quantify a sunglint-driven brightness reversal and indicate a critical viewing angle range of θₘ ≈ 19°–24°, consistent with the observed absence of detectable streaks within this range. Wind streaks occur predominantly under moderate winds (6–12 m s−1) and near-neutral stability, highlighting the potential of optical imagery in diagnosing boundary-layer regimes. The method is applicable to other time-lagged push-broom sensors (e.g., HY-1E CZI2 at 20 m and Landsat OLI at 30 m) and, under favorable conditions, can be combined with whitecap coverage to retrieve the surface wind vector.
Since the first appearance of the annually recurrent Great Atlantic Sargassum Belt (GASB) in 2011, satellite remote sensing has been used as a primary technique to monitor and track the pelagic Sargassum fluitans/natans in the Atlantic Ocean. The Ocean Color Instrument (OCI) on the Plankton, Aerosol, Cloud, ocean Ecosystem (PACE, 2024-present) mission is a first-ever operational hyperspectral sensor designed to measure the surface ocean's biological and biogeochemical properties at global scale on a near-daily basis, which is expected to provide improved performance over traditional multi-band polar-orbiting ocean color sensors. Here, we evaluate the capacity of OCI in detecting and quantifying the Atlantic Sargassum, referenced against heritage multi-band satellite sensors such as the Moderate Resolution Imaging Spectroradiometer (MODIS on Aqua) and Visible Infrared Imaging Radiometer Suite (VIIRS on NOAA-20). Our research involved development of a shared deeplearning Sargassum detection algorithm, fine-tuned for each sensor. As such, we found that OCI not only provided 47% more valid observations (# of valid pixels) than MODIS in the central west Atlantic for the study period of May-August 2024, but from the common valid pixels OCI also detected 51% more Sargassum-containing pixels. While the former is mostly due to the OCI's ability to avoid sun glint, the latter appears to be due to band binning and fewer artifacts around clouds. Using VIIRS as a bridge, it is further found that such a difference between OCI and MODIS is not due to the reported MODIS sensor degradation after 2023, but is inherent to sensor and measurement characteristics. On the other hand, VIIRS also showed more valid observations and detected more Sargassum pixels than MODIS, attributed to the larger swath and a finer spatial resolution, respectively. For these reasons, both OCI and VIIRS detected substantially more Sargassum than MODIS at daily, weekly, and monthly scales, although the spatial distributions and temporal changes of Sargassum revealed by the three sensors are similar. Finally, because of the hyperspectral capability, OCI is the only sensor that can spectrally discriminate Sargassum pixels without ambiguity. Such improved performance will make OCI a unique sensor to map both macroalgae mats and microalgae scums at global scale in both near real-time and retrospective analyses.
Turbidity (Turb) and chlorophyll-a concentration (Chla) are important water quality indicators in aquatic ecosystems. While spatial and temporal patterns of Chla in the largest lake of Florida (USA), Lake Okeechobee (LO), are well documented, less is known about Turb in this lake. Here, for Ocean Colour and Land Imager (OLCI) imagery, an extreme gradient boost (XGB) model was developed and validated using in situ Turb measurements, showing RMSD (similar to 10 NTU) similar to 50% lower than previously reported values. We estimated Turb distributions between 2016 and 2023, and showed contrasting spatial/temporal patterns between Turb(OLCI) (5-300 NTU) and Chla(OLCI) (5-200 mg m(-3)) determined from an existing model. Seasonally, Turb(OLCI) was typically higher in winter and Chla(OLCI) higher in summer. Spatially, Turb(OLCI) was generally higher in offshore regions and Chla(OLCI) was higher in nearshore regions except during major harmful algal bloom (HAB) events. Such contrasting spatial/temporal patterns, whereby high Chla(OLCI) was associated with low Turb(OLCI) and vice versa, are due to different mechanisms driving phytoplankton growth and sediment resuspension. While variability in Chla(OLCI) reflects biologically mediated processes influenced by light, temperature, and nutrient availability, Turb(OLCI) is regulated by bottom substrate type and wind-induced turbulence. A moderate correlation (r similar to 0.5) was found between wind speed and lake-wide Turb(OLCI) on a monthly scale. Turbidity limits light for submerged aquatic vegetation and HABs negatively affect this lake system, yet in situ monitoring is often insufficient to identify potentially harmful conditions in near-real time. Satellite-derived Turb(OLCI) and Chla(OLCI) time-series can help water management agencies make decisions to better safeguard the environment, public health, and local economies.
Phytoplankton blooms, defined as a periods of high biomass, are key indicators of climate-driven ocean responses. Shifts in their timing and magnitude can substantially alter the marine ecosystem, yet the environmental regimes governing bloom development remain poorly constrained. We analyzed long-term environmental data (2003–2023) from the Central Yellow Sea (CYS) to decode the drivers of the spring phytoplankton bloom (SPB), which is defined into four developmental stages based on changes in chlorophyll-a (Chl-a). A machine-learning decision tree (DT) was employed to identify specific quantitative critical thresholds associated with each phase. Results show that the SPB initial stage represented low-light intensity in early-April. The peak stage was determined by strong-light intensity; thus, the Chl-a increased rapidly in mid-April. The decline stage corresponded to a high sea surface temperature (SST > 14.40 °C) in May, while the termination stage indicated no SPB occurrence after late-May due to very-high SST ( > 17.27 °C). We classified four SPB types from phenology and discussed the unique environmental characteristics of each type. SPB peak timing is set by the coupled physical oceanic structure (SST-mixing-light), whereas atmospheric inputs modulate bloom magnitude. The study provides a consistent baseline and a physically interpretable phenology-threshold approach for integrated interpretation of timing and conditions.
Within 14 days between September 26 and October 9 of 2024, Hurricanes Helene (Category 4) and Milton (Category 3) made landfall on the west coast of Florida (U.S.A), causing compounding damage due to their strong winds, heavy rainfall, and severe storm surges. Despite extensive post-hurricane damage assessments on land, the distribution and fate of floating debris in the estuarine and marine environments remain unknown. Here, using Sentinel-2 Multispectral Instrument (MSI) satellite imagery (10 m resolution), aerial photographs, and spectral analysis, we show the possible types, distribution, and temporal changes of hurricane-induced floating materials in estuarine and coastal waters off west-central Florida, including Tampa Bay and Charlotte Harbor. Spectral characteristics and visual patterns suggest that these floating materials consisted of offshore dead vegetation (e.g., seagrass and tree branches), vegetation-debris mixtures (with possible plastics), and non-vegetation materials in the two estuaries. Following Helene, floating materials peaked three days after landfall on September 29 (estimated 136,000 m² in Tampa Bay, 22,000 m² in Charlotte Harbor) and nearly vanished in five days. After Milton, peak coverage occurred five days after landfall on October 14 (110,000 m² in Tampa Bay, 133,000 m² in Charlotte Harbor) and persisted for at least 15 days until October 29. Ocean current analysis further suggests that the post-Milton offshore floating materials west of Tampa Bay mainly originated from Helene-induced remnants in the Big Bend region. These findings shed light on combining satellite and airborne remote sensing to map floating debris and other floating materials after hurricanes, which may help mitigation efforts in the future once such an approach is implemented for near-real-time applications.
Remote detection of plastic litter in both marine and freshwater environments using satellite measurements has become a hot research topic in the past decade, where numerous papers have shown “successful” algorithm development and applications. However, many of these results appear to need some revisits because, in logic, the causality of A to B (i.e., A => B) does not lead to the inference of B => A unless A is the only reason to cause B. In practice, even though plastics can lead to a certain type of signal anomaly (e.g., spectral, spatial, backscattering) from controlled experiments, the same anomaly detected from the natural environments cannot be used to infer plastics unless other possible reasons can all be ruled out. This is especially true when considering that non-plastic floating matters are much more ubiquitous in the aquatic environments. Unfortunately, this logic has been missing in many, if not most, publications. Here, using spectral reflectances of various types of floating matters and through demonstrations of several examples, I show why such logic is critical in remote detection of plastic litter and why pixel averaging and subtraction are necessary steps to spectrally discriminate the signal anomaly in multi-band optical remote sensing imagery. It is argued that unless other possibilities are ruled out using imaging spectroscopy or other means, it is premature to attribute the detected signal anomaly to plastic litter. After all, not every anomaly pixel is necessarily due to litter, and not every litter pixel is necessarily due to plastics unless proven otherwise.
The Great Atlantic Sargassum Belt first appeared in 2011 and quickly became the largest interconnected floating biome on Earth. In recent years, Sargassum stranding events have caused substantial ecological and socio-economic impacts in coastal communities. Sargassum requires both phosphorus (P) and nitrogen (N) for growth, yet the primary sources of these nutrients fuelling the extensive Sargassum blooms remain unclear. Here we use coral-bound N isotopes to reconstruct N 2 fixation, the ultimate source of the ocean’s bioavailable N, across the Caribbean over the past 120 years. Our data indicate that changes in N 2 fixation were primarily controlled by multidecadal and interannual changes in equatorial Atlantic upwelling of ‘excess P’, that is, P in stoichiometric excess relative to fixed N. We show that the supply of excess P from equatorial upwelling and N from the N 2 fixation response can account for the majority of Sargassum variability since 2011. Sargassum dynamics are best explained by their symbiosis with N 2 -fixing epiphytes, which render the macroalgae highly competitive during strong equatorial upwelling of excess P. Thus, the future of Sargassum in the tropical Atlantic will depend on how global warming affects equatorial Atlantic upwelling and the climatic modes that control it.
The Arctic Ocean has undergone accelerated warming and a marked decline in sea ice over recent decades. Yet, the response of the biological pump-a critical mechanism for atmospheric carbon sequestration-remains poorly understood. Here, we develop a satellite-derived dataset (2003-2022) to identify a regime shift in the Arctic biological pump. Between 2003 and 2012, the strength and efficiency of the biological pump increased rapidly, primarily driven by sea ice decline. However, from 2013 to 2022, this trend plateaued, coinciding with stabilized sea ice conditions and increased phytoplankton biomass. Earth system model simulations (1850-2100) support the observed link between biological pump enhancement and sea ice loss, and project a future regime shift towards a weakened biological pump under nearly ice-free conditions, associated with shifts in phytoplankton community structure. These findings underscore the Arctic's vulnerability to climate-driven changes, with far-reaching implications for Arctic carbon sequestration and ecosystem stability.
Hurricane Idalia formed on 26 August 2023 and three days later rapidly intensified from a Category 1 to Category 4 strength storm in less than 24 h over the west Florida shelf. On August 30, it made landfall along Florida's Big Bend area as a Category 3 hurricane. Strikingly, despite Idalia's moderate intensity and favorable vortex structure, neither upper ocean thermal energy nor environmental vertical wind shear conditions were as favorable during its intensification from Category 2 to Category 4 as earlier in its path, raising the question of what external factors contributed to its extreme intensification during this phase. Using satellite data, underwater glider observations, and numerical model outputs, this study reveals that, in addition to the 2023 marine heatwave, an extensive riverine plume in the eastern Gulf of Mexico, extending from the Mississippi-Alabama-Florida shelf to the Straits of Florida, produced a similar to 20 m thick low-salinity layer (similar to 34-34.5 psu) and a corresponding warm upper ocean (>29 degrees C, similar to 25-30 m thick). This defined a 10-20 m thick strongly stratified barrier layer below the surface layer with buoyancy frequencies exceeding 10(-3) s(-1) that suppresses vertical mixing and became a critical factor contributing to Idalia's rapid intensification under the relatively less than favorable thermal and wind field environments. Therefore, incorporating the river plume in future forecast models appears to be essential to improve the accuracy of intensity predictions, especially in the areas affected by the plume, where stratification plays an important role in the intensification dynamics.
 Frank E. Muller Karger合作论文数Department of Biological Oceanography, College of Marine Science, University of South Florida;Institute for Marine Remote Sensing, College of Marine Science, University of South Florida75
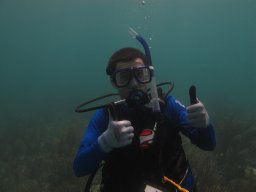 Brian B. Barnes合作论文数College of Marine Science, University of South Florida74
 Zhongping Lee (李忠平)合作论文数Optical Oceanography Laboratory, State Key Laboratory of Marine Environmental Science, Xiamen University;School for the Environment, University of Massachusetts Boston44
 Lian Feng (冯炼)合作论文数State Key Laboratory of Information Engineering in Surveying, Mapping and Remote Sensing, Wuhan University41
 Jennifer Cannizzaro合作论文数College of Marine Science, University of South Florida40
 Lin Qi (齐琳)合作论文数School of Marine Sciences, Sun Yat-Sen University35
 David C. English合作论文数College of Marine Science, University of South Florida33
 Menghua Wang合作论文数Satellite Oceanography & Climatology Division, NOAA Center for Satellite Applications and Research25
 Robert H. Weisberg合作论文数College of Marine Science, University of South Florida25
 Mengqiu Wang合作论文数College of Marine Ecology and Environment, Shanghai Ocean University21
 Shaoling Shang (商少凌)合作论文数State Key Laboratory of Marine Environmental Science, Xiamen University21
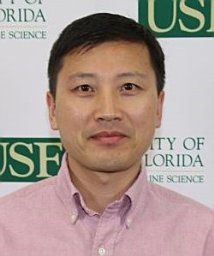 Yonggang Liu合作论文数College of Marine Science, University of South Florida21
 Chengfeng Le (乐成峰)合作论文数Ocean College, Zhejiang University20
 Shaojie Sun (孙绍杰)合作论文数School of Marine Sciences, Sun Yat-sen University19
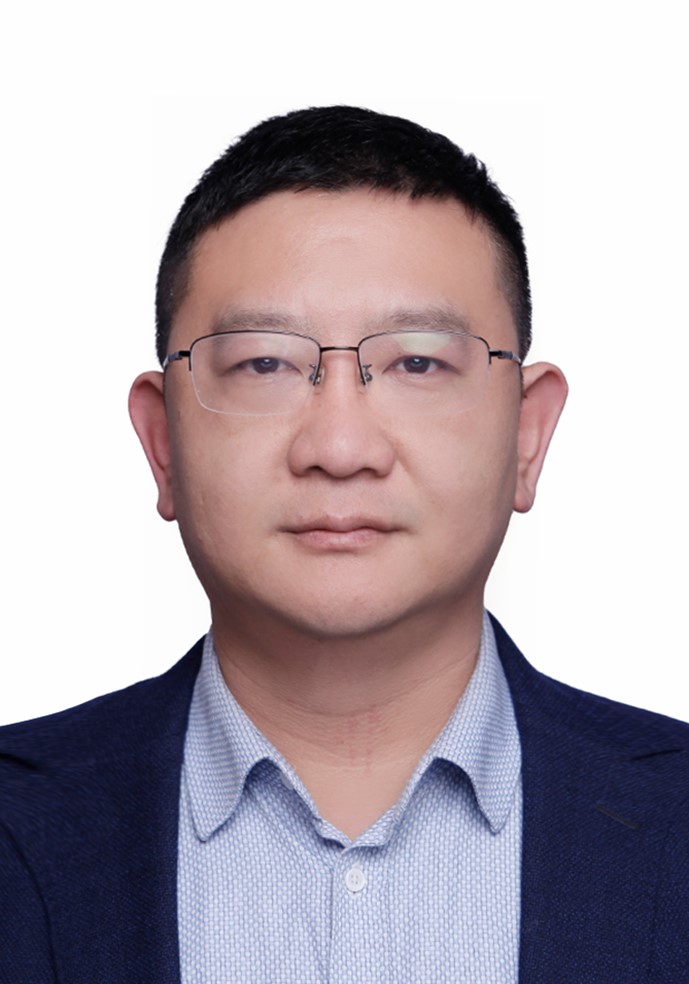 Yingcheng Lu (陆应诚)合作论文数International Institute for Earth System Science, Nanjing University19
 Kendall L. Carder合作论文数College of Marine Science, University of South Florida18
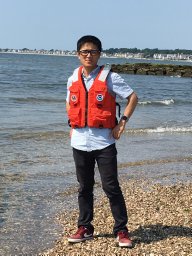 Yuyuan Xie合作论文数College of Marine Science, University of South FloridaSt. Petersburg17Yingjun Zhang合作论文数15
 An Chen (陈安)合作论文数中国人民解放军第三军医大学普通外科15
 Chad Lembke合作论文数15
 Yongxue Liu (刘永学)合作论文数School of Geography and Ocean Science, Nanjing University15
 Brian E. Lapointe (Brian Lapointe)合作论文数Harbor Branch Oceanographic Institute, Florida Atlantic University15
 Minwei Zhang合作论文数Center for Earth Observation and Digital Earth, Chinese Academy of Sciences14
 Lianyuan Zheng合作论文数College of Marine Science, University of South Florida14WeiJing Yi (易维京)合作论文数13ShuHui Li (李淑慧)合作论文数13
 Ronghua Ma (马荣华)合作论文数中国科学院大学中国科学院南京地理与湖泊研究所13
 Junnan Jiao合作论文数12Lianbo Hu (胡连波)合作论文数College of Information Science and Engineering, Ocean University of China12
 Bryan A Franz合作论文数Ocean Ecology Laboratory, Goddard Space Flight Center, National Aeronautics and Space Administration12
 Robert Arnone合作论文数12
 Shuangling Chen (陈双玲)合作论文数State Key Laboratory of Satellite Ocean Environment Dynamics, Second Institute of Oceanography, Ministry of Natural Resources11
 Brock Murch合作论文数University of South Florida St. Petersburg, University of South Florida11
 Xiaoling Chen (陈晓玲)合作论文数State Key Laboratory of Information Engineering in Surveying, Mapping and Remote Sensing, Wuhan University11
 Charles Kovach合作论文数11
 John Christopher Lehrter合作论文数and Dauphin Island Sea Lab, The University of Alabama11Nathan F Putman合作论文数10
 Zhujun Zhang (章竹君)合作论文数Shaanxi Normal University10Vassiliki H. Kourafalou合作论文数10Serge Andréfouët合作论文数9
 Shuai Zhang合作论文数Univ N Carolina, Dept Geol Sci, 104 South Rd, Chapel Hill, NC 27599 USA9
 Qi Lin (林琦)合作论文数College of Environmental and Resource Sciences, Zhejiang University9
 Oscar Garcia-Pineda合作论文数Florida State University9
 Z. Chen合作论文数CMS;USF9S. Andréfouët合作论文数8
 Dennis J. McGillicuddy Jr.合作论文数Department of Applied Ocean Physics and Engineering, Woods Hole Oceanographic Institution8
 Deyong Sun (孙德勇)合作论文数南京信息工程大学海洋科学学院8Elizabeth Johns合作论文数NOAA Atlantic Oceanographic and Meteorological Laboratory (AOML), 4301 Rickenbacker Causeway, Miami, FL 33149, United States8
 Ramon Varela合作论文数8




