We attempt to offer a balanced perspective on the use of generative artificial intelligence in education, including the good, bad, and ugly aspects.
Forecasting technological advancement in complex domains such as space exploration presents significant challenges due to the intricate interaction of technical, economic, and policy-related factors. The field of technology forecasting has long relied on quantitative trend extrapolation techniques, such as growth curves (e.g., Moore’s law) and time series models, to project technological progress. To assess the current state of these methods, we conducted an updated systematic literature review (SLR) that incorporates recent advances. This review highlights a growing trend toward machine learning-based hybrid models.Motivated by this review, we developed a forecasting model that combines long short-term memory (LSTM) neural networks with an augmentation of Moore’s law to predict spacecraft lifetimes. Operational lifetime is an important engineering characteristic of spacecraft and a potential proxy for technological progress in space exploration. Lifetimes were modeled as depending on launch date and additional predictors.Our modeling analysis introduces a novel advance in the recently introduced Start Time End Time Integration (STETI) approach. STETI addresses a critical right censoring problem known to bias lifetime analyses: the more recent the launch dates, the shorter the lifetimes of the spacecraft that have failed and can thus contribute lifetime data. Longer-lived spacecraft are still operating and therefore do not contribute data. This systematically distorts putative lifetime versus launch date curves by biasing lifetime estimates for recent launch dates downward. STETI mitigates this distortion by interconverting between expressing lifetimes as functions of launch time and modeling them as functions of failure time. This study is the first to apply STETI within a neural network framework. Hyperparameter tuning via Bayesian optimization identified the best-performing model, which outperforms a regression-based baseline. The model’s predictions across hypothetical scenarios highlight the influence of factors such as spacecraft launch mass, mission destination, and country of manufacture. The results provide insights relevant to space mission planning and policy decision-making.
Background/Objectives: Accurately estimating survival times for kidney cancer patients is critical for clinical decision-making, treatment evaluation, resource allocation other purposes. Yet data from relatively recent diagnosis cohorts presents an important difficulty: five, 10 or 20-year survival time averages are not available until 5, 10 or 20 years later, which may be in the future thus presenting a challenge to understand in the present. The proposed approach is shown for kidney cancer survival but could be applied to survival problems connected to survival for other types of cancer, other diseases, stage progression times, and similar problems in medicine and engineering in which there is a need to understand trends of improvement in survival. Methods: This study introduces a novel method for survival estimation that addresses limitations in traditional approaches by incorporating recent survival data often excluded due to incomplete longitudinal records. Leveraging data from the SEER database resource, the proposed approach integrates historical diagnosis year cohorts with more recent death year cohorts. This permits survival time trend analyses that account for both earlier and more recent improvements in treatment effectiveness. We used linear and exponential models to demonstrate the method's ability to predict survival trends using valuable data that would otherwise risk being ignored. Conclusions: Better survival estimates can better support personalized treatment planning, health care benchmarking, and research into cancer subtypes as well as other domains. This hybrid analytical approach paves the way to applications in oncology and beyond, and offers a robust method for quantifying and predicting the survival trends associate with therapeutic advancements.
Background/Objectives: Accurately estimating survival times is critical for clinical decision-making, treatment evaluation, resource allocation, and other purposes. Yet data from relatively recent diagnosis cohorts is strongly affected by right censoring that biases average survival times downward. For example, 5-, 10-, or 20-year survival time averages are not available until 5, 10, or 20 years later, which may be in the future, thus presenting a challenge to obtain in the present. An approach to addressing this problem is described in this report. Here it is demonstrated for kidney cancer survival but could also be applied to survival questions for other types of cancer, other diseases, stage progression times, and similar problems in medicine and other fields in which there is a need for up-to-date analyses of survival improvement trends. Methods: This study introduces STETI, an approach to survival estimation that integrates information about survival times of diagnosis year cohorts with information about survival times of death year cohorts. By leveraging data from death year cohorts in addition to the more familiar diagnosis year cohorts, STETI incorporates recent survival data often excluded by traditional approaches due to right censoring, caused when the post-diagnosis time period of interest has not yet elapsed. Using data from SEER, we explain how the proposed approach integrates diagnosis year cohorts with the death year cohorts of recent years. We demonstrate that incorporating death year cohorts addresses an important source of right censorship that is inherent in diagnosis year cohorts from relatively recent years. This permits survival time trend analysis that accounts for recent improvements in survival time that would be difficult to account for using diagnosis year cohorts alone. We tested linear and exponential models to demonstrate the method’s ability to derive survival time trends using valuable data that would otherwise risk being left unused. Conclusions: Improved survival estimation can better support personalized treatment planning, healthcare benchmarking, and research into cancer subtypes as well as other domains. To this end, we introduce a hybrid analytical approach that addresses an important source of right censorship. Demonstrating it within the domain of kidney cancer is expected to help pave the way to other applications in oncology and beyond, and offers a case study of STETI, an approach to quantifying and projecting trends in survival time associated with therapeutic advancements.
This report shows that with the most recent advancements in Artificial Intelligence (AI) and Natural Language Processing (NLP) using generative-pretrained transformers, we can develop robust AI applications to assist customer service departments with question answer systems. This paper addresses the question answering task using an OpenAI Application Programming Interface (API). This report examines how to create an AI question answering application from documents that generated correct answers to questions about those documents. We used two different approaches to create the question answering system. One was to use just the OpenAI API. The other was to use the LangChain framework and libraries. Both applications did answer questions correctly. LangChain used less code with a higher learning curve. The OpenAI API used more code and provided more detailed answers.
Introduction:Data and information quality play a critical role in the managed healthcare sector, where accurate and reliable information is crucial for optimal decision-making, operations, and patient outcomes. However, managed care organizations face significant challenges in ensuring information quality due to the complexity of data sources, regulatory requirements, and the need for effective data management practices. The goal of this article is to develop and justify an information quality framework for managed healthcare, thereby enabling the sector to better meet its unique information quality challenges. Methods:The information quality framework provided here was designed using other information quality frameworks as exemplars, as well as a qualitative survey involving interviews of twenty industry leaders structured around 17 questions. The responses were analyzed and tabulated to obtain insights into the information quality needs of the managed healthcare domain. Results:The novel framework we present herein encompasses strategies for data integration, standardization and validation, and is followed by a justification section that draws upon existing literature and information quality frameworks in addition to the survey of leaders in the industry. Discussion:Emphasizing objectivity, utility, integrity, and standardization as foundational pillars, the proposed framework provides practical guidelines to empower healthcare organizations in effectively managing information quality within the managed care model.
Superimposed text annotations have been under-investigated, yet are ubiquitous, useful and important, especially in medical images. Medical images also highlight the challenges posed by low resolution, noise and superimposed textual meta-information. Therefor we probed the impact of superimposing text onto medical images on VQA. Our results revealed that this textual meta-information can be added without severely degrading key measures of VQA performance. Our findings are significant because they validate the practice of superimposing text on images, even for medical images subjected to the VQA task using AI techniques. The work helps advance understanding of VQA in general and, in particular, in the domain of healthcare and medicine.
Quantitative technology forecasting uses quantitative methods to understand and project technological changes. It is a broad field encompassing many different techniques and has been applied to a vast range of technologies. A widely used approach in this field is trend extrapolation. Based on the literature available to us, there has been little or no attempt made to systematically review the empirical evidence on quantitative trend extrapolation techniques. This study attempts to close this gap by conducting a systematic review of the technology forecasting literature addressing the application of quantitative trend extrapolation techniques. We identified 25 studies relevant to the objective of this research and classified the techniques used in the studies into different categories, among which the growth curves and time series methods were shown to remain popular over the past decade while the newer methods, such as machine learning-based hybrid models, have emerged in recent years. As more effort and evidence are needed to determine if hybrid models are superior to traditional methods, we expect a growing trend in the development and application of hybrid models to technology forecasting.
SUMMARY & CONCLUSIONSThis paper describes the results of a survey that was conducted to determine the knowledge and skills that reliability engineering practitioners utilize in their everyday work. The survey consisted of twenty-two (22) questions and was conducted in person at two (2) events. The first event was the 13th Annual Training Summit event held by the Society of Reliability Engineers (SRE) – Huntsville Chapter, in Huntsville, Alabama on November 29-30, 2021. The second event was the 68th Annual RAMS in Tucson, Arizona on January 24-27, 2022. In all, there were fifty (50) respondents to the survey with two being determined ineligible for lack of working in a reliability engineering role. Results showed that the vast majority of reliability engineers who participated in the survey were interested in having better data science skills for themselves and were also interested in having a teammate with data science skills. Approximately 56% of practitioners that were surveyed showed preference for having a reliability engineer with data science skills on their team. By contrast, 26% preferred a data scientist with reliability engineering knowledge and 14% had no preference. Survey results also showed that the data science skills used most frequently by reliability engineers are statistical summaries and analysis, data modeling, predictive modeling, data visualization, data cleansing/preparation, and data mining. Finally, survey results showed not only an interest hiring reliability engineers with data science skills, but also a significant openness to hiring data scientists with reliability engineering skills.
Objectives: An SLR is presented focusing on text mining based automation of SLR creation. The present review identifies the objectives of the automation studies and the aspects of those steps that were automated. In so doing, the various ML techniques used, challenges, limitations and scope of further research are explained. Methods: Accessible published literature studies that primarily focus on automation of study selection, study quality assessment, data extraction and data synthesis portions of SLR. Twenty-nine studies were analyzed. Results: This review identifies the objectives of the automation studies, steps within the study selection, study quality assessment, data extraction and data synthesis portions that were automated, the various ML techniques used, challenges, limitations and scope of further research. Discussion: We describe uses of NLP/TM techniques to support increased automation of systematic literature reviews. This area has attracted increase attention in the last decade due to significant gaps in the applicability of TM to automate steps in the SLR process. There are significant gaps in the application of TM and related automation techniques in the areas of data extraction, monitoring, quality assessment and data synthesis. There is thus a need for continued progress in this area, and this is expected to ultimately significantly facilitate the construction of systematic literature reviews.
We consider the problem of system-level balanced scheduling in a pediatric hospital setting. A hospital clinic has a queue for patients needing care. After being seen in clinic, many require follow-up surgery, for which they also wait in a queue. The rate-limiting factor is physician availability for both clinic visits and surgical cases. Although much existing work has been done to optimize clinic appointments, as well as to optimize surgical appointments, this novel approach models the entire patient journey at the system level, through both clinic and surgery, to optimize the total patient experience. A discrete-event simulation model of the system was built based on historic patient encounter data and validated. The system model was then optimized to determine the best allocation of physician resources across the system to minimize total patient wait time using machine learning. The results were then compared to baseline.
In the context of deep learning research, where model introductions continually occur, the need for effective and efficient evaluation remains paramount. Existing methods often emphasize accuracy metrics, overlooking stability. To address this, the paper introduces the Accuracy-Stability Index (ASI), a quantitative measure incorporating both accuracy and stability for assessing deep learning models. Experimental results demonstrate the application of ASI, and a 3D surface model is presented for visualizing ASI, mean accuracy, and coefficient of variation. This paper addresses the important issue of quantitative benchmarking metrics for deep learning models, providing a new approach for accurately evaluating accuracy and stability of deep learning models. The paper concludes with discussions on potential weaknesses and outlines future research directions.
Understanding visual question answering is going to be crucial for numerous human activities. However, it presents major challenges at the heart of the artificial intelligence endeavor. This paper presents an update on the rapid advancements in visual question answering using images that have occurred in the last couple of years. Tremendous growth in research on improving visual question answering system architecture has been published recently, showing the importance of multimodal architectures. Several points on the benefits of visual question answering are mentioned in the review paper as in [1], on which the present article builds, including subsequent updates in the field.
Satellite lifetime is one of the important characteristics of satellite design and construction. It’s also of practical importance to know when a satellite is about to fail, as reentry and disposal can become operational matters. Satellite lifetime estimation is not necessarily a one-time action, but can be repeated, and it depends on many factors such as orbital parameters, operational requirements, and various others. Many products today are designed with safety, quality, and service life in mind. Based on the historical trend in satellite lifetimes, the approach used here is to predict the lifetimes of satellites using half-life values of their launch year cohorts. Half-life calculations can be made using either launch year or failure year cohorts, making a comparison of these of interest in forecasting the future lifetimes of satellites. This study focuses on analyzing satellite half-lives and using that information to project lifetimes of satellites that are still operational from the satellite launch year. We examine conformance of satellite lifetime data to fitted curves that remove noise from the data and thereby predict lifetimes of satellites from their launch year cohorts.
We review and define the current state of the art as relating to discrete event simulation in healthcare-related systems. A review of published literature over the past five years (2017–2021) was conducted, building upon previously published work. PubMed and EBSCOhost were searched for journal articles on discrete event simulation in healthcare resulting in identification of 933 unique articles. Of these about half were excluded at the title/abstract level and 154 at the full text level, leaving 311 papers to analyze. These were categorized, then analyzed by category and collectively to identify publication volume over time, disease focus, activity levels by country, software systems used, and sizes of healthcare unit under study. A total of 1196 articles were initially identified. This list was narrowed down to 311 for systematic review. Following the schema from prior systematic reviews, the articles fell into four broad categories: health care systems operations (HCSO), disease progression modeling (DPM), screening modeling (SM), and health behavior modeling (HBM). We found that discrete event simulation in healthcare has continued to increase year-over-year, as well as expand into diverse areas of the healthcare system. In addition, this study adds extra bibliometric dimensions to gain more insight into the details and nuances of how and where simulation is being used in healthcare.
Image quality is important, and can affect overall performance in image processing and computer vision as well as for numerous other reasons. Image quality assessment (IQA) is consequently a vital task in different applications from aerial photography interpretation to object detection to medical image analysis. In previous research, the BRISQUE algorithm and the PSNR algorithm were evaluated with high resolution (≥ 512×384 pixels), but relatively small image sets (≤4,744 images). However, scientists have not evaluated IQA algorithms on low resolution (≤32×32 pixels), multi-perturbation, big image sets (for example, ≥60,000 different images not counting their perturbations). This study explores these two IQA algorithms through experimental investigation. We first chose two deep learning image sets, CIFAR-10 and MNIST. Then, we added 68 perturbations that add noise to the images in specific sequences and noise intensities. In addition, we tracked the performance outputs of the two IQA algorithms with singly and multiply noised images. After quantitatively analyzing experimental results, we report the limitations of the two IQAs with these noised CIFAR-10 and MNIST image sets. We also explain three potential root causes for performance degradation. These findings point out weaknesses of the two IQA algorithms. The research results provide guidance to scientists and engineers developing accurate, robust IQA algorithms. All source codes, related image sets, and figures are shared on the website (https://github.com/caperock/imagequality) to support future scientific and industrial projects.
This paper develops a novel approach to modeling and predicting advancement in spacecraft technology for deep space exploration. As spacecraft lifetimes increase, ever more elaborate missions and even quasi-permanent bases become more and more possible. We use the NASA (National Aeronautical and Space Agency) yearly budget along with the time variable to model their relationship with spacecraft lifespans and compare the level of fit of our model with an exponential (generalized Moore's law) model. The results indicate that our model provides a better curve fit, suggesting the usefulness of NASA's budget in predicting the progression of space exploration technology. Additionally, the evidence that the NASA budget has a statistically significant impact on spacecraft lifespans suggests that the government could increase future funding of NASA to foster quicker technological improvement in space exploration technology.
Power and Utilities (P&U) organizations generate important data from Enterprise Asset Management (EAM) systems, which are used to help manage physical asset life cycle, operations, and related business processes. A range of physical asset types are used in power generation, transmission, and distribution. Asset Data Quality (ADQ) in EAM is one area which is often overlooked during EAM system implementation. The information quality focus has been on the final database, leading to rework and even persistent data quality deficiencies, thereby losing the significant benefits of enforcing data quality by designing data structures correctly at their source before data records are added to the database. Good quality asset data supports organizational objectives, where quality is associated with the “fitness for use” of data as the overarching, multidimensional perspective on the quality of the data. This is about the fitness of data for supporting operations, and distinct from the fitness for use of the equipment itself. A high quality asset data set also directly contributes to the decisions the asset owner must make to increase asset availability, optimize overall cost of asset maintenance, and reduce risks associated with asset operation. This paper proposes the Automatic Data Validation (ADV) Approach for validating fitness for use of asset data using three data quality dimensions: completeness, uniqueness, and consistency. An implementation, ADV Tool, is also presented as a proof of concept to show how it can benefit EAM business processes in P&U organizations by improving asset data quality.
Information Quality (IQ) of a university website plays a major role in the decision process for prospective students when selecting a university for their higher education. Furthermore, current students and others rely on university websites for many other purposes. In this paper we identify university website information quality dimensions relevant to prospective and current students and other site users. We discuss the rationales for identifying these IQ dimensions and propose a University Website Information Quality (UWebIQ) framework to quantify the individual IQ dimensions as well as a strategy for defining the composite IQ for such a website. The outcome of this research is expected to provide insight for universities that wish to maximize the fitness for use of their websites.
 J. Zhang合作论文数15
 Eve Syrkin Wurtele合作论文数Department of Genetics, Development and Cell Biology, College of Agriculture and Life Sciences, Iowa State University;Substrate Games;Meta!Blast13Richard S. Segall合作论文数Arkansas State University;Department of Computer & Information Technology College of Business;State University13
 Gerald B Sheble合作论文数Gerald Sheble Epmt Inc13Aboudja Hyacinthe合作论文数10
 Robert E Belford合作论文数10
 Michael Anton Bauer合作论文数9
 Scott Ferson合作论文数Institute for Risk and Uncertainty, School of Engineering, University of Liverpool9Michael Howell合作论文数7Jing Ding合作论文数7
 Venkat Kodali合作论文数6Peng-Hung Tsai合作论文数Department of Information Science, University of Arkansas at Little Rock6
 Hal Berghel合作论文数Department of Computer Science, University of Nevada, Las Vegas6M.-P. Cheong合作论文数6Andy W. Fulmer合作论文数6Venkata Batthula合作论文数5
 Wei Dai合作论文数5
 Vladik Kreinovich合作论文数Department of Computer Science, University of Texas at El Paso5Jinghao Miao合作论文数Mathematics Subject Classification: 68 a€” Computer science5Roger A. Hall合作论文数4Lizhi Xie合作论文数4
 Andrew Cornell合作论文数Dept Chem, Univ Arkansas4
 Benjamin Kuipers合作论文数Department of Computer Science and Engineering, University of Michigan4
 William L. Oberkampf合作论文数Sandia National Laboratories4
 Lev R. Ginzburg合作论文数Applied Biomathematics® Inc.;Stony Brook University4Julie a Dickerson合作论文数Electrical and Computer Engineering Department
Iowa State University4
Lev R. Ginzburg合作论文数Applied Biomathematics® Inc.;Stony Brook University4Julie a Dickerson合作论文数Electrical and Computer Engineering Department
Iowa State University4 Janos Hajagos合作论文数4W. Troy Tucker合作论文数4
 Lifeng Zhang合作论文数3
 John W. Moore合作论文数Department of Chemistry, College of Letters & Science, University of Wisconsin-Madison3
 Patrick S Schnable合作论文数Department of Agronomy, Iowa State University3
 Dan Nettleton合作论文数Department of Statistics, College of Liberal Arts and Sciences, Iowa State University3
 Ling Li合作论文数3
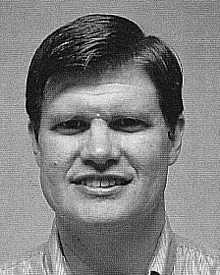 Gary T. Anderson合作论文数3
 Roger B. Nelsen合作论文数Mathematical Sciences Dept, Lewis & Clark College3
 Daniel Ashlock合作论文数Department of Mathematics and Statistics, College of Engineering and Physical Sciences, University of Guelph3
 Olga M. Kosheleva合作论文数STEM Education Division, Department of Teacher Education, University of Texas at El Paso;Department of Electrical and Computer Engineering, University of Texas at El Paso3Bj Kuipers合作论文数2C. C. Teoh合作论文数2John J. Forbus合作论文数2robert a mustell合作论文数2
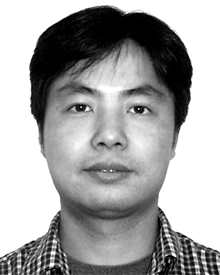 Pan Du合作论文数2Martine Ceberio合作论文数2
 Elizabeth Hood合作论文数College of Agriculture, Arkansas State University;Greenlab, Inc.;Infinite-Eversole Strategic Crop Services, LLC2
 Hung T. Nguyen合作论文数Department of Mathematical Sciences, College of Arts and Sciences, New Mexico State University2
 James F. Peters合作论文数Department of Electrical and Computer Engineering, University of Manitoba2Zhong Gu合作论文数2Gang Xiang合作论文数2




