Mirroring the increasingly pervasive impact of politics in everyday life, research on politics, ideology, and partisanship in the workplace has escalated in recent years across a variety of domains germane to the organizational sciences. But for as many new insights as these lines of inquiry have produced—ranging from interpersonal interactions to employee behaviors to the organizational implications of top executives’ political leanings—there are just as many (if not more) compelling questions that remain unanswered. In this article, we offer our perspectives on the literatures involving politics, ideology, and partisanship in organizations, including an overview of research in the area and some particularly encouraging future directions. We also invite submissions for a new special issue that solicits scholarship on the topic across myriad disciplines, traditions, and empirical approaches. In the process, we delineate the nature of this special issue, introduce its associate editors, and offer guidelines for submissions—which we are accepting starting at this very moment.
The transmission of communicable diseases in human populations is known to be modulated by behavioral patterns. However, detailed characterizations of how population-level behaviors change over time during multiple disease outbreaks and spatial resolutions are still not widely available. We used data from 431,211 survey responses collected in the United States, between April 2020 and June 2022, to provide a description of how human behaviors fluctuated during the first 2 y of the COVID-19 pandemic. Our analysis suggests that at the national and state levels, people's adherence to recommendations to avoid contact with others (a preventive behavior) was highest early in the pandemic but gradually-and linearly-decreased over time. Importantly, during periods of intense COVID-19 mortality, adaption to preventive behaviors increased-despite the overall temporal decrease. These spatial-temporal characterizations help improve our understanding of the bidirectional feedback loop between outbreak severity and human behavior. Our findings should benefit both computational modeling teams developing methodologies to predict the dynamics of future epidemics and policymakers designing strategies to mitigate the effects of future disease outbreaks.
Scientists provide important information to the public. Whether that information influences decision-making depends on trust. In the USA, gaps in trust in scientists have been stable for 50 years: women, Black people, rural residents, religious people, less educated people and people with lower economic status express less trust than their counterparts (who are more represented among scientists). Here we probe the factors that influence trust. We find that members of the less trusting groups exhibit greater trust in scientists who share their characteristics (for example, women trust women scientists more than men scientists). They view such scientists as having more benevolence and, in most cases, more integrity. In contrast, those from high-trusting groups appear mostly indifferent about scientists' characteristics. Our results highlight how increasing the presence of underrepresented groups among scientists can increase trust. This means expanding representation across several divides-not just gender and race/ethnicity but also rurality and economic status.
Conspiratorial thoughts as a cognitive aspect are understudied outside small clinical cohorts. We conducted a 50-state non-probability internet survey of respondents age 18 and older, who completed the American Conspiratorial Thinking Scale (ACTS) and the 9-item Patient Health Questionnaire (PHQ-9). Across the 6 survey waves, there were 123,781 unique individuals. After reweighting, a total of 78.6 % somewhat or strongly agreed with at least one conspiratorial idea; 19.0 % agreed with all four of them. More conspiratorial thoughts were reported among those age 25-54, males, individuals who finished high school but did not start or complete college, and those with greater levels of depressive symptoms. Endorsing more conspiratorial thoughts was associated with a significantly lower likelihood of being vaccinated against COVID-19. The extent of correlation with non-vaccination suggests the importance of considering such thinking in designing public health strategies.
There is a growing belief that many Americans shun, ostracize, or "cancel" those they dislike or those who make disagreeable statements. Yet, no empirical work has explored the prevalence or motives of this type of sanctioning or how Americans perceive it. Using a nationally representative survey with an embedded conjoint experiment, we find that Americans vastly overestimate how likely other people-especially out-partisans-are to cancel others. Nevertheless, they accurately perceive what motivates others to cancel: disagreeable and offensive statements, not disliked speakers. Additionally, we find that Democrats and Republicans are similarly motivated to cancel, although canceling behavior out in the world may more commonly come from Democrats. Our findings highlight how "cancel culture" could limit harmful speech but encourage self-censorship and partisan animus. They also reveal the normative fault lines underlying debates about free speech in contemporary society.
Social media provides citizens with direct access to information shared by politicians. Citizens, in turn, play a critical role in diffusing such content. Do conservative and liberal citizens differ in their decisions about which representatives' social media content to share? We analyze more than 13 million users' sharing of 1,293,753 messages by US members of Congress on Twitter from 2009 to 2019, leveraging estimates of users' political ideology from over 3.5 billion prior retweets. We find that liberals retweeted statements covering a broader range of issues than conservatives. Liberals also shared statements with content rated as relatively more toxic by a standard classifier. Given well-established tendencies toward political homophily among social media users, our results suggest that, compared to conservatives, liberals will be exposed to a more diverse set of issues and more toxic content originating from elected representatives. We conclude with a discussion of several possible explanations for these patterns.
ImportanceEfforts to understand the complex association between social media use and mental health have focused on depression, with little investigation of other forms of negative affect, such as irritability and anxiety.ObjectiveTo characterize the association between self-reported use of individual social media platforms and irritability among US adults.Design, Setting, and ParticipantsThis survey study analyzed data from 2 waves of the COVID States Project, a nonprobability web-based survey conducted between November 2, 2023, and January 8, 2024, and applied multiple linear regression models to estimate associations with irritability. Survey respondents were aged 18 years and older.ExposureSelf-reported social media use.Main Outcomes and MeasuresThe primary outcome was score on the Brief Irritability Test (range, 5-30), with higher scores indicating greater irritability.ResultsAcross the 2 survey waves, there were 42 597 unique participants, with mean (SD) age 46.0 (17.0) years; 24 919 (58.5%) identified as women, 17 222 (40.4%) as men, and 456 (1.1%) as nonbinary. In the full sample, 1216 (2.9%) identified as Asian American, 5939 (13.9%) as Black, 5322 (12.5%) as Hispanic, 624 (1.5%) as Native American, 515 (1.2%) as Pacific Islander, 28 354 (66.6%) as White, and 627 (1.5%) as other (ie, selecting the other option prompted the opportunity to provide a free-text self-description). In total, 33 325 (78.2%) of the survey respondents reported daily use of at least 1 social media platform, including 6037 (14.2%) using once a day, 16 678 (39.2%) using multiple times a day, and 10 610 (24.9%) using most of the day. Frequent use of social media was associated with significantly greater irritability in univariate regression models (for more than once a day vs never, 1.43 points [95% CI, 1.22-1.63 points]; for most of the day vs never, 3.37 points [95% CI, 3.15-3.60 points]) and adjusted models (for more than once a day, 0.38 points [95% CI, 0.18-0.58 points]; for most of the day, 1.55 points [95% CI, 1.32-1.78 points]). These associations persisted after incorporating measures of political engagement.Conclusions and RelevanceIn this survey study of 42 597 US adults, irritability represented another correlate of social media use that merits further characterization, in light of known associations with depression and suicidality.
Belief in conspiracy theories has significant social and political consequences. While prior research has focused primarily on psychological predispositions as drivers of conspiracy beliefs, relatively less is known about the role of social networks. Here, we examine how information received from different sources is linked to the endorsement of conspiracy theories, using the 2024 attempted assassination of presidential candidate Donald Trump as a case study. In surveys conducted days after the attack, social media was the most commonly reported source of conspiracy theories about the event. At the same time, information consumption on social media was not consistently associated with stronger conspiracy beliefs. In contrast, information received through interpersonal ties was more closely linked to belief in both left-leaning and right-leaning conspiratorial narratives. These findings highlight the importance of examining the social dimensions of conspiracy belief formation. Understanding how interpersonal communication shapes conspiracy beliefs is critical for explaining their spread and persistence. Future research would benefit from further investigating the social contexts that sustain conspiratorial thinking.
Screening measures of depressive symptoms (eg, 9-item Patient Health Questionnaire [PHQ-9]) are increasingly used in surveys and remote applications, where shorter versions would be valuable. To derive shorter versions of the PHQ-9 that maximize the variability in total depressive symptom severity captured. This survey study used data from 4 waves of a 50-state nonprobability web-based survey conducted between November 2, 2023, and July 21, 2024. Survey respondents were aged 18 years or older. The first survey wave data were used to identify shortened question subsets capturing variance in the PHQ-9 and estimating a PHQ-9 score of 10 or higher. Resulting models (eg, 3-item version of the PHQ [PHQ-3]) were validated in subsequent survey waves. Performance of PHQ-3 in the full sample and across subgroups of age, gender, race and ethnicity, and educational levels. Depressive symptom severity was measured with the PHQ-9 (total score range: 0-27, with a score ≥10 indicating moderate or greater depressive symptoms). In the 4 survey waves, there were 96 234 total participants (mean [SD] age, 47.3 [17.1] years; 55 245 [57.4%] identifying as women). In the full sample, 4401 participants (4.6%) identified as Asian American, 12 699 (13.2%) as Black or African American, 9776 (10.2%) as Hispanic or Latino, and 65 309 (67.9%) as White individuals, with 4049 (4.2%) who identified as having other race or ethnicity. Among these participants, the mean (SD) PHQ-9 score was 6.5 (6.6), and 25 411 (26.4%) met the criteria for moderate or greater depressive symptoms (PHQ-9 score ≥10). The optimal 3-item version, PHQ-3, used items 2 (subject: depressed mood), 6 (self-esteem or failure), and 1 (interest), yielding a Cronbach α of 0.88 (95% CI, 0.88-0.88) and Pearson correlation with the PHQ-9 total score of 0.93 (95% CI, 0.93-0.94). At a threshold of 3 or greater, the PHQ-3 sensitivity was 0.98 (95% CI, 0.97-0.98) and specificity was 0.76 (95% CI, 0.75-0.76) for moderate or greater depressive symptoms. Performance was consistent across sociodemographic subgroups and survey waves. This survey study of US adults identified a 3-item scale that remained highly correlated with the full PHQ-9 instrument. The reduced set of questions could enable more widespread and efficient incorporation of depressive symptom measurement in general population samples.
Americans' trust in scientists has been stable and high, relative to other political and social institutions, for the last half century (Krause, Brossard, and Scheufele 2019). Yet, underlying this stability lies a dramatic change such that a partisan gap has emerged, with Democrats exhibiting substantially more trust than Republicans. Fifty years ago, Republicans in fact exhibited more relative trust in scientists. This article explains this continuity and change. First, we demonstrate that the demographic correlates of trust in scientists have been remarkably stable for more than a half century: women, Black, rural, religious, non-college educated, and lower/working-class individuals exhibit less trust than their counterparts. Second, we show that the partisan relationship with trust in scientists has flipped (over that same time period) as low-trusting demographic strata shifted partisan allegiances. This is particularly the case when it comes to education and religiosity. Concomitant with the emergent partisan gap is a massive perceptual gap among Democrats, who perceive a partisan divide more than double its actual size. Democrats vastly underestimate Republicans' trust in scientists. The enduring demographic basis of trust in scientists provides an opportunity to bridge partisan divides by addressing demographic inequities in the practice and application of science.
The file drawer problem-often operationalized in terms of statistically significant results being published and statistically insignificant not being published-is widely documented in the social sciences. We extend Franco's et al. [Science 345, 1502-1505(2014)] seminal study of the file drawer problem in survey experiments submitted to the Time-sharing Experiments for the Social Sciences (TESS) data collection program. We examine projects begun after Franco et al. The updated period coincides with the contemporary open science movement. We find evidence of the problem, stemming from scholars opting to not write up insignificant results. However, that tendency is substantially smaller than it was in the prior decade. This suggests increased recognition of the importance of null results, even if the problem remains in the domain of survey experiments.
This study aimed to characterize the prevalence of irritability among U.S. adults, and the extent to which it co-occurs with major depressive and anxious symptoms. A non-probability internet survey of individuals 18 and older in 50 U.S. states and the District of Columbia was conducted between November 2, 2023, and January 8, 2024. Regression models with survey weighting were used to examine associations between the Brief Irritability Test (BITe5) and sociodemographic and clinical features. The survey cohort included 42,739 individuals, mean age 46.0 (SD 17.0) years; 25,001 (58.5%) identified as women, 17,281 (40.4%) as men, and 457 (1.1%) as nonbinary. A total of 1218(2.8%) identified as Asian American, 5971 (14.0%) as Black, 5348 (12.5%) as Hispanic, 1775 (4.2%) as another race, and 28,427 (66.5%) as white. Mean irritability score was 13.6 (SD 5.6) on a scale from 5 to 30. In linear regression models, irritability was greater among respondents who were female, younger, had lower levels of education, and lower household income. Greater irritability was associated with likelihood of thoughts of suicide in logistic regression models adjusted for sociodemographic features (OR 1.23, 95% CI 1.22-1.24). Among 1979 individuals without thoughts of suicide on the initial survey assessed for such thoughts on a subsequent survey, greater irritability was also associated with greater likelihood of thoughts of suicide being present (adjusted OR 1.17, 95% CI 1.12-1.23). The prevalence of irritability and its association with thoughts of suicide suggests the need to better understand its implications among adults outside of acute mood episodes.
ImportanceIdentifying and tracking new infections during an emerging pandemic is crucial to design and deploy interventions to protect populations and mitigate the pandemic’s effects, yet it remains a challenging task.ObjectiveTo characterize the ability of nonprobability online surveys to longitudinally estimate the number of COVID-19 infections in the population both in the presence and absence of institutionalized testing.Design, Setting, and ParticipantsInternet-based online nonprobability surveys were conducted among residents aged 18 years or older across 50 US states and the District of Columbia, using the PureSpectrum survey vendor, approximately every 6 weeks between June 1, 2020, and January 31, 2023, for a multiuniversity consortium—the COVID States Project. Surveys collected information on COVID-19 infections with representative state-level quotas applied to balance age, sex, race and ethnicity, and geographic distribution.Main Outcomes and MeasuresThe main outcomes were (1) survey-weighted estimates of new monthly confirmed COVID-19 cases in the US from January 2020 to January 2023 and (2) estimates of uncounted test-confirmed cases from February 1, 2022, to January 1, 2023. These estimates were compared with institutionally reported COVID-19 infections collected by Johns Hopkins University and wastewater viral concentrations for SARS-CoV-2 from Biobot Analytics.ResultsThe survey spanned 17 waves deployed from June 1, 2020, to January 31, 2023, with a total of 408 515 responses from 306 799 respondents (mean [SD] age, 42.8 [13.0] years; 202 416 women [66.0%]). Overall, 64 946 respondents (15.9%) self-reported a test-confirmed COVID-19 infection. National survey-weighted test-confirmed COVID-19 estimates were strongly correlated with institutionally reported COVID-19 infections (Pearson correlation, r = 0.96; P < .001) from April 2020 to January 2022 (50-state correlation mean [SD] value, r = 0.88 [0.07]). This was before the government-led mass distribution of at-home rapid tests. After January 2022, correlation was diminished and no longer statistically significant (r = 0.55; P = .08; 50-state correlation mean [SD] value, r = 0.48 [0.23]). In contrast, survey COVID-19 estimates correlated highly with SARS-CoV-2 viral concentrations in wastewater both before (r = 0.92; P < .001) and after (r = 0.89; P < .001) January 2022. Institutionally reported COVID-19 cases correlated (r = 0.79; P < .001) with wastewater viral concentrations before January 2022, but poorly (r = 0.31; P = .35) after, suggesting that both survey and wastewater estimates may have better captured test-confirmed COVID-19 infections after January 2022. Consistent correlation patterns were observed at the state level. Based on national-level survey estimates, approximately 54 million COVID-19 cases were likely unaccounted for in official records between January 2022 and January 2023.Conclusions and RelevanceThis study suggests that nonprobability survey data can be used to estimate the temporal evolution of test-confirmed infections during an emerging disease outbreak. Self-reporting tools may enable government and health care officials to implement accessible and affordable at-home testing for efficient infection monitoring in the future.
Scholars have long recognized that interpersonal networks play a role in mobilizing social movements. Yet, many questions remain. This Element addresses these questions by theorizing about three dimensions of ties: emotionally strong or weak, movement insider or outsider, and ingroup or cross-cleavage. The survey data on the 2020 Black Lives Matter protests show that weak and cross-cleavage ties among outsiders enabled the movement to evolve from a small provocation into a massive national mobilization. In particular, the authors find that Black people mobilized one another through social media and spurred their non-Black friends to protest by sharing their personal encounters with racism. These results depart from the established literature regarding the civil rights movement that emphasizes strong, movement-internal, and racially homogenous ties. The networks that mobilize appear to have changed in the social media era. This title is also available as Open Access on Cambridge Core.
Megastudies are experiments that test many treatments simultaneously using the same outcomes, control condition and sample, and are a promising tool that can provide unique insights relative to other research designs. We identify five critical decisions in designing megastudies and suggest potential solutions for each.
Twenty-first century American politics has been defined by various types of polarization. One example involves scientists, who play an outsized role when it comes to expert advice for individuals and society. In 2000, there was no partisan divide over trust in scientists, but in 2022 the gap was large. While analysts have studied the origins and evolution of polarized trust in scientists, there has been virtually no work that directly connects it with political outcomes. This is a notable lacune given trusting scientists signals a significant delegation of authority that affects well-being. We offer a set of expectations that we test with secondary survey data, a new survey, and an experiment. We find that polarized trust in scientists shapes partisan animosity, support for political compromise, and willingness to politicize science. Polarized trust in scientists not only affects politics, but political divides also are underpinned by beliefs about expertise.
Whether and when to censor hate speech are long-standing points of contention in the US. The latest iteration of these debates entails grappling with content regulation on social media in an age of intense partisan polarization. But do partisans disagree about what types of hate speech to censor on social media or do they merely differ on how much hate speech to censor? And do they understand out-party censorship preferences? We examine these questions in a nationally representative conjoint survey experiment (participant N = 3,357; decision N = 40,284). We find that, although Democrats support more censorship than Republicans, partisans generally agree on what types of hate speech are most deserving of censorship in terms of the speech’s target, source, and severity. Despite this substantial cross-party agreement, partisans mistakenly believe that members of the other party prioritize protecting different targets of hate speech. For example, a major disconnect between the two parties is that Democrats overestimate and Republicans underestimate the other party’s willingness to censor speech targeting Whites. We conclude that partisan differences on censoring hate speech are largely based on free speech values and misperceptions rather than identity-based social divisions.
As survey methods adapt to technological and societal changes, a growing body of research seeks to understand the tradeoffs associated with various sampling methods and administration modes. We show how the NSF-funded 2022 Collaborative Midterm Survey (CMS) can be used as a dynamic and transparent framework for evaluating which sampling approaches - or combination of approaches - are best suited for various research goals. The CMS is ideally suited for this purpose because it includes almost 20,000 respondents interviewed using two administration modes (phone and online) and data drawn from random digit dialing, random address-based sampling, a probability-based panel, two nonprobability panels, and two nonprobability marketplaces. The analysis considers three types of population benchmarks (election data, administrative records, and large government surveys) and focuses on the national-level estimates as well as oversamples in three states (California, Florida, and Wisconsin). In addition to documenting how each of the survey strategies performed, we develop a strategy to assess how different combinations of approaches compare to different population benchmarks in order to guide researchers combining sampling methods and sources. We conclude by providing specific recommendations to public opinion and election survey researchers and demonstrating how our approach could be applied to a large government survey conducted at regular intervals to provide ongoing guidance to researchers, government, businesses, and nonprofits regarding the most appropriate survey sampling and administration methods.
 Katherine Ognyanova合作论文数136
 David Lazer合作论文数College of Social Sciences and Humanities, Northeastern University;Khoury College of Computer Science, Northeastern University;Department of Political Science, Northeastern University;Institute for Quantitative Social Science Associate, Harvard University135
 Matthew Baum合作论文数Department of Government, Faculty of Arts and Sciences, Harvard University;John F. Kennedy School of Government, Harvard University132
 Mauricio Santillana合作论文数Harvard T.H. Chan School of Public Health, Harvard University127
 Jon Green合作论文数Northeastern Univ106
 Alexi Quintana Mathé合作论文数102
 Roy Perlis合作论文数Center for Quantitative Health, Massachusetts General Hospital;Center for Genomic Medicine, Mass General Research Institute;Harvard Medical School98
 Matthew Simonson合作论文数Northeastern Univ81Ata Uslu合作论文数77
 Jennifer Lin合作论文数Dept Polit Sci, Northwestern Univ76
 Alauna Safarpour合作论文数Harvard University47
 Kristin Lunz Trujillo合作论文数Dept Polit Sci, Univ Minnesota46Hanyu Chwe合作论文数43Hong Qu合作论文数37Adina Gitomer合作论文数36Caroline H Pippert合作论文数28
 Arthur Lupia合作论文数Institute for Social Research, University of Michigan25
 Donald P. Green合作论文数Department of Political Science, Columbia University25
 Anjuli Shere合作论文数Department of Computer Science, University of Oxford21
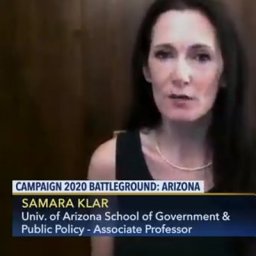 Samara Klar合作论文数Department of Political Science, University of Arizona20
 Toby Bolsen合作论文数Northwestern University;Department of Political Science;Department of Political Science, Northwestern University20John D. Volpe合作论文数19
 Martin Kifer合作论文数19Michael Parkin合作论文数University of Western Ontario19James H. Kuklinski合作论文数University of Illinois at Urbana-Champaign19Jonathan Schulman合作论文数15
 Matthew Levendusky合作论文数Department of Political Science, Ronald O. Perelman Center for Political Science and Economics, College of Arts & Sciences, University of Pennsylvania14Dennis Chong合作论文数13Fay Lomax Cook合作论文数11
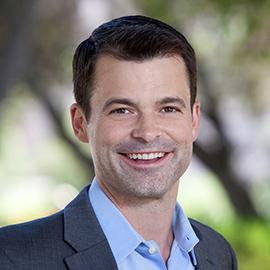 Robb Willer合作论文数Department of Psychology, Stanford University11
 Thomas J. Leeper合作论文数London Sch Econ10Samantha Cadenasso合作论文数9Claire L. Adida合作论文数Department of Political Science, Division of Social Sciences, University of California, San Diego9
 Raymond Duch合作论文数Department of Politics and International Relations, University of Oxford9
 Cheryl Boudreau合作论文数Department of Political Science, University of California, Davis9
 Christian R. Grose合作论文数Dept Polit Sci, Vanderbilt Univ9
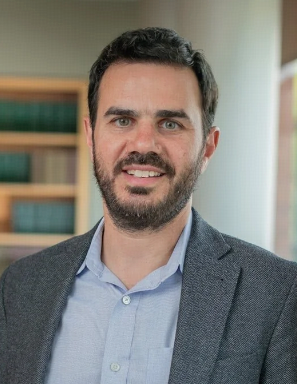 David G. Rand合作论文数Department of Information Science, Bowers College of Computing and Information Science, Cornell University9
 Johanna Dunaway合作论文数Department of Political Science and Manship School of Mass Communication, Louisiana State University9Scott Deposato合作论文数8
 Elizabeth Sharrow合作论文数University of Massachusetts Amherst8
 Rosario Aguilar合作论文数Centro de Investigación y Docencia Económicas, CIDE8
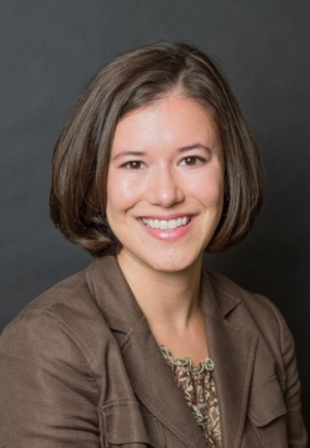 Sarah Bush合作论文数Department of Political Science, Yale University8
 Guy Grossman合作论文数Department of Political Science, College of Arts & Sciences, University of Pennsylvania8
 Jennifer Jerit合作论文数Department of Political Science;Florida State University;Department of Political Science, Florida State University8
 Kim Yi Dionne合作论文数8Jennifer L. Merolla合作论文数7Daniel Posner合作论文数7Karin Van合作论文数7
 Lene Aarøe合作论文数Department of Political Science and Government, Aarhus University7




