The autofluorescence of algal pigments enables non-invasive, high-throughput characterization of microalgae at single-cell resolution. We applied full-spectrum cytometry, imaging flow cytometry, and cell sorting to analyze the spectral and morphological diversity among major microalgal groups and 102 Chlorophyta strains. The distinct spectral signatures from chlorophylls, carotenoids, and phycobiliproteins enabled clear separation of major pigment-defined algal groups, particularly those containing phycobiliproteins. Furthermore, principal component analysis of Volvocales (Chlorophyta) revealed three spectral clusters supported by corresponding differences in cell size and shape. Additionally, in Gonium cultures, we observed that spectral signatures in the yellow-green region were altered in the presence of bacteria, suggesting that interactions between the algal host and bacteria affect pigment-related fluorescence. Spectral heterogeneity observed within monocultures was linked to pigment accumulation, cell size, and morphological variability. These findings establish full-spectrum cytometry as a powerful method for profiling pigment composition, physiology, and structural diversity in microalgae, with broad applications in microbial ecology, environmental monitoring, and biotechnology.
Abstract Inland waters in the Northern Hemisphere are experiencing increased annual runoff due to higher overall precipitation as well as intensified short-term events such as heavy rainfall, floods and storms. These events affect the total loading and variability of inputs of allochthonous, coloured dissolved organic matter (cDOM) and inorganic nutrients into lakes. Previous studies have shown that increased total cDOM and inorganic nutrient loads affect phytoplankton biomass and metabolic rates, but it is unknown how the effects of different cDOM and nutrient pulse scenarios are modified by spatial and seasonal differences in lake characteristics. Here, we conducted a coordinated, standardized mesocosm experiment across three lakes with different ambient cDOM and nutrient concentrations. In two of these lakes, the experiment was implemented in two seasons. The same total amounts of cDOM, nitrate and phosphate were added to all mesocosms, but in pulses that differed in intensity and frequency. We found that pulse intensity and frequency affected chlorophyll a and phycocyanin concentrations and metabolic rates, i.e. gross primary production and respiration, differently. Specifically, more pronounced effects were found in response to the extreme pulse scenario compared to those with more frequent, smaller pulse additions. Furthermore, the effects were mainly temporary and varied more among lakes than between seasons. The clearest differences between the extreme and more gradual runoff scenarios were found in the lake with the lowest background cDOM and nitrate concentrations, likely because lower light limitation and possibly stronger initial N-limitation caused a faster response to the nutrient addition. Our results highlight that both antecedent lake conditions and characteristics of runoff events can affect phytoplankton biomass and metabolic rates and that comparative experimental approaches are needed to reveal the complexity of the responses.
Abstract Aquatic systems exchange large amounts of carbon dioxide (CO2) and methane (CH4) with the atmosphere. The microbubble hypothesis suggests that microbubbles preferentially enhance air−water transfer of sparingly soluble gases like CH4 over CO2, explaining elevated normalized gas transfer velocity ratios (k600,CH4:k600,CO2) observed in many inland waters. This hypothesis remains to be empirically tested. We tested this hypothesis in meso-oligotrophic Lake Stechlin (NE Germany) using acoustic bubble spectroscopy to quantify microbubble concentrations, floating chambers to measure CH4 and CO2 fluxes, and dissolved gas concentrations to estimate k600 for CH4 and CO2. Contrary to our hypothesis, k600,CH4:k600,CO2 averaged near unity and was independent of microbubble concentration. Theoretical microbubble-mediated CH4 fluxes contributed ∼0.05% to total CH4 fluxes. Thus, microbubbles affected gas transfer velocities weakly under the relatively low-wind, posteutrophication conditions of our sampling campaign. Instead, k600,CH4:k600,CO2 was more likely explained by gas-specific near-surface concentration gradients, surfactant-induced surface immobilization, and chemical enhancement of CO2 exchange. Microbubble concentrations were mainly linked to wind-induced turbulence and were elevated in littoral areas. Our results limit the applicability of the microbubble hypothesis and suggest that larger microbubble gas fluxes likely require stronger wind-induced forcing than observed here, or site-specific sources, such as littoral vegetation.
Climate change increases the magnitude and frequency of extreme weather events. This includes severe summer storms altering lake physical structure, biodiversity and ecosystem processes. However, insights into lake responses to extreme storms and the underlying mechanisms primarily rest on unreplicated and observational case studies, without separating effects of physical forcing from secondary drivers such as external nutrient and dissolved organic matter inputs. In a large-scale replicated experiment conducted in a unique enclosure facility mimicking realistic environmental conditions, we tested how storm-induced mixing entails changes in lake ecosystems. Consequences include altered phytoplankton composition, nutrient, oxygen and carbon dynamics, with potential negative feedbacks on climate through organic matter sequestration. These experimental results are reflected in a minimal dynamical model and are also supported by observations made during a natural severe storm. An important practical implication is that efforts to abate lake eutrophication needs to accommodate the projected increases in extreme weather situations.
Light is the primary cue driving zooplankton diel vertical migration (DVM), a strategy that balances predation risk with resource access. However, DVM is often oversimplified, with limited consideration of how light-driven risks and resource needs vary across taxa and life stages. This simplification is partly due to constraints on collecting high-resolution, size-resolved data —especially at night, when subtle shifts in illumination reshape nocturnal risk landscapes. To overcome these limitations, we deployed a high-resolution in situ modular Deep-focus Plankton Imager and an image-recognition approach to quantify fine scale DVM and body sizes of Cladocerans and Copepods in Lake Stechlin, Germany. Data was collected from day into night and across moonrise and was compared with environmental data from vertical profiling sondes. Typical DVM patterns emerged, with deeper daytime distributions, however, moonlight introduced additional behavioural complexity: larger individuals avoided illuminated layers, likely managing predation risk, while smaller individuals moved into these layers, possibly exploiting foraging opportunities and reduced risk. These light-mediated shifts were further shaped by ecological conditions; copepods tracked food-rich layers regardless of light levels at night, while cladocerans showed light-dependent responses to both temperature and food, such that light caused them to avoid otherwise favourable (warm, food-rich) layers. Our approach provides new insight into how zooplankton navigate nocturnal lightscapes, revealing size- and taxon-specific strategies. By establishing size-dependent responses to natural moonlight, this work provides a crucial baseline for predicting how artificial light at night may restructure zooplankton communities and destabilize freshwater food webs.
A multitude of anthropogenic stressors drive biodiversity loss and alter ecosystem functioning. Freshwaters, which contribute disproportionally to global biodiversity and biogeochemical cycles, are particularly threatened. Although the relationship between biodiversity and ecosystem functions (BEF) is generally well-established, especially in terrestrial ecosystems, the role of multiple, co-occurring stressors in modulating the relationship remains unclear. We conducted a meta-analysis to address this knowledge gap by assessing the effect of multiple stressors on the relationship between taxon richness and four measures of ecosystem function. The relationship was generally positive, with the slope becoming steeper as the number of stressors increased, suggesting that exposure to multiple stressors exacerbates impacts of biodiversity loss on ecosystem function. Multiple stressor effects on both taxon richness and ecosystem functions were largely predictable from individual stressor effects, although antagonistic effects on ecosystem functions emerged in 14% of the considered cases. The type of stressor and ecosystem function, along with taxonomic group, exerted no influence on the BEF relationship, contrary to our expectations. Microbial production and biomass declined most strongly in response to stressors, despite notable variability. Overall, our findings imply that functional consequences of freshwater biodiversity loss are more severe under multifaceted environmental change than previously assumed.
Understanding the mechanisms driving community structure and dynamics is crucial in the face of escalating climate change, including increasing incidences of extreme weather. Cell size is a master trait of small organisms that is subject to a trade-off between resistance to grazing and competition for resources, and thus holds potential to explain and predict community dynamics in response to disturbances. Here, we aimed at determining whether cell size can explain shifts in phytoplankton communities following changes in nutrient and light conditions resulting from storm-induced inputs of nutrients and colored dissolved organic matter (cDOM) to deep clearwater lakes. To ensure realistic environmental conditions, we used a crossed gradient design to conduct a large-scale enclosure experiment over 6 weeks. Cell size explained phytoplankton community structure when light availability declined as a result of cDOM supply. Initially unimodal, with small-celled species accounting for up to 60% of the total community biovolume, the cell-size distribution gradually shifted toward large-celled species as light levels declined following cDOM addition. Neither nutrients nor mesozooplankton affected the shift in cell-size distribution. These results suggest a distinct competitive advantage of larger over smaller species at reduced light levels following cDOM inputs during storm events. Importantly, the clustering of species in two distinct size classes implies that interspecific size differences matter as much as cell size per se to understand community dynamics. Given that shifts in cell-size distribution have strong implications for food-web structure and biogeochemical cycles, our results point to the importance of analyzing cell-size distributions of small organisms as an essential element to forecast community and ecosystem dynamics in response to environmental change.
The Humboldt upwelling system (HUS) is known for its extraordinary productivity due to wind-driven upwelling of nutrient-rich deep water, resulting in the highest fish catches per unit area worldwide. However, contrary to other Eastern boundary upwelling systems, upwelling intensity is highest in winter, while primary productivity reaches its peak during the summer months. Our current understanding of the counterintuitive relationship between upwelling intensity and productivity is insufficient to predict the consequences of climate change on this ecosystem. To elucidate the drivers of the upwelling-productivity relationship in the HUS, we tested the hypothesis that low light availability limits primary productivity in winter despite strong upwelling intensity supplying plenty of nutrients into the surface layer, while light availability in the shallower mixed layer in summer enables an effective use of the upwelled nutrients. To disentangle the interactive effects of light and nutrients on primary production and carbon cycling, we enclosed natural plankton communities off the coast of Callao (Peru) during a 35-day mesocosm experiment by recreating summer-time high light and winter-time low light conditions under different upwelling intensities (0 %, 15 %, 30 %, 45 % and 60 %). Primary productivity and phytoplankton biomass scaled with both nitrate and light availability. Comparing the same upwelling intensity at different light levels, our data confirmed the hypothesis that light limitation due to deepening of the mixed layer is a key driver for the out-of-phase observations in primary productivity in the Humboldt upwelling system. Under light limiting conditions phytoplankton had low POC:Chla ratios indicating photoacclimation and low POC:PON ratios indicating light limitation of nitrate uptake which leads to increased food quality for grazers in winter. Our study indicates that small seasonal changes in phytoplankton biomass (estimated using Chla) might hide larger changes in primary productivity (carbon uptake), and highlights the importance of combining satellite studies with in situ observations and experimental studies to predict the fate of upwelling systems in a changing ocean. Increased stratification caused by global warming in upwelling systems such as the HUS would lead to less phytoplankton biomass with higher POC:Chla and POC:PON ratios. This phytoplankton community would have lower food quality for grazers and might lead to a decline in the transfer to higher trophic levels, but at the same time might lead to increased CO2 drawdown in an otherwise CO2 emitting ecosystem. Understanding the unique relationship between upwelling intensity and productivity in the HUS contributes to predicting the reaction of this valuable ecosystem for fisheries to the impacts of climate change.
Artificial light propagating towards the night sky can be scattered back to Earth and reach ecosystems tens of kilometres away from the original light source. This phenomenon is known as artificial skyglow. Its consequences on freshwaters are largely unknown. In a large-scale lake enclosure experiment, we found that skyglow at levels of 0.06 and 6 lux increased the abundance of anoxygenic aerobic phototrophs and cyanobacteria by 32 (±22) times. An ecosystem metabolome analysis revealed that skyglow increased the production of algal-derived metabolites, which appeared to stimulate heterotrophic activities as well. Furthermore, we found evidence that skyglow decreased the number of bacteria-bacteria interactions. Effects of skyglow were more pronounced at night, suggesting that responses to skyglow can occur on short time scales. Overall, our results call for considering skyglow as a reality of increasing importance for microbial communities and carbon cycling in lake ecosystems.
Introduction Phytoplankton are microscopic organisms that form the foundation of aquatic food webs. Accurate identification and classification of phytoplankton species are crucial for monitoring all aquatic ecosystems, from marine to freshwater, understanding ecological dynamics, and assessing environmental changes. Traditional methods of phytoplankton identification, which rely on manual microscopy, are time-consuming and require expert knowledge. Recent advancements in machine learning, particularly Convolutional Neural Networks (CNNs), offer promising solutions for automating this process. This abstract explores the application of pre-trained CNNs in recognizing phytoplankton species, highlighting their advantages, methodologies, and potential impacts. Methodology We present three approaches from a marine site, the Gulf of Venice site of the LTER-Italy network (DEIMS.ID https://deims.org/758087d7-231f-4f07-bd7e-6922e0c283fd), which includes the 'Acqua Alta' Oceanographic Tower (AAOT) (Fig. 1), the brackishwater site Utö Atmospheric and Marine Research Station (ResNet-18, located at 59°46.84’ N, 21°22.13’ E) https://en.ilmatieteenlaitos.fi/uto, and the freshwater site the IGB-LakeLab in Lake Stechlin NE Germany (DEIMS.ID https://deims.org/2223bc9c-12b2-49fe-af73-4299f553e054). Three different architectures of CNN were used: VGG16 for the Gulf of Venice, ResNet-18 for the Finnish station and a YOLOv11-cls for the German Lake Stechlin LakeLab station. These CNN models were pre-trained on the ImageNet dataset and subsequently fine-tuned with specific datasets for the respective geographic areas. These CNNs were chosen for their ability to autonomously extract features from images without external assistance, making them efficient, fast tools for analyzing large amounts of data and due to their specificity regarding the characteristics of the observational site. The process involves several steps: Data Collection and Preprocessing : several public datasets are available (Ciranni et al. 2024), where each image is annotated according to its class. Each model is structured to require input images in a specific format, so depending on the chosen model, it is necessary to preprocess the images accordingly. With an Imaging Flow Cytobot (IFCB, an in-situ automated submersible imaging flow cytometer that generates images of particles in-flow taken from the aquatic environment.), the produced images are of good quality (Fig. 2), and the main modification applied is resizing the images to fit the model requirements; Transfer Learning : Transfer learning allows the weights of a pre-trained neural network to be retained and updated (only if specified) for specific tasks. It has been demonstrated that using pre-trained models leads to significant results, reducing both training time and the amount of data required compared to an untrained model (Maracani et al. 2023); Training and Validation : The modified CNN is trained on the annotated phytoplankton images. Techniques such as data augmentation (to increment the number of images), dropout, and batch normalization are employed to enhance model performance and prevent overfitting. The model's accuracy is validated using a separate dataset; Evaluation Metrics : Performance metrics, including accuracy, precision, recall, and F1-score, are used to evaluate the model. Confusion matrices and receiver operating characteristic (ROC) curves provide additional insights into the model's classification capabilities. Data Collection and Preprocessing : several public datasets are available (Ciranni et al. 2024), where each image is annotated according to its class. Each model is structured to require input images in a specific format, so depending on the chosen model, it is necessary to preprocess the images accordingly. With an Imaging Flow Cytobot (IFCB, an in-situ automated submersible imaging flow cytometer that generates images of particles in-flow taken from the aquatic environment.), the produced images are of good quality (Fig. 2), and the main modification applied is resizing the images to fit the model requirements; Transfer Learning : Transfer learning allows the weights of a pre-trained neural network to be retained and updated (only if specified) for specific tasks. It has been demonstrated that using pre-trained models leads to significant results, reducing both training time and the amount of data required compared to an untrained model (Maracani et al. 2023); Training and Validation : The modified CNN is trained on the annotated phytoplankton images. Techniques such as data augmentation (to increment the number of images), dropout, and batch normalization are employed to enhance model performance and prevent overfitting. The model's accuracy is validated using a separate dataset; Evaluation Metrics : Performance metrics, including accuracy, precision, recall, and F1-score, are used to evaluate the model. Confusion matrices and receiver operating characteristic (ROC) curves provide additional insights into the model's classification capabilities. Results Studies have demonstrated that pre-trained CNNs can achieve high accuracy in phytoplankton classification. In our case, models like ResNet and VGG have shown classification accuracies exceeding 80% on diverse phytoplankton datasets (Fig. 3, Kraft et al. 2022). These models effectively distinguish between species with subtle morphological differences, which are often challenging for human experts. Discussion The use of pre-trained CNNs in phytoplankton recognition offers several advantages: Efficiency : Automated classification significantly reduces the time and effort required for phytoplankton identification compared to manual methods. Scalability : CNNs can handle large volumes of image data, making them suitable for Long Term Ecological Research. Consistency : Machine learning models provide consistent and objective classifications, minimizing human error and variability. Efficiency : Automated classification significantly reduces the time and effort required for phytoplankton identification compared to manual methods. Scalability : CNNs can handle large volumes of image data, making them suitable for Long Term Ecological Research. Consistency : Machine learning models provide consistent and objective classifications, minimizing human error and variability. However, challenges remain. The automatic taxonomic identification level is still not as detailed as that of human expertise. The quality and diversity of training data are critical for model performance. Inadequate or biased datasets can lead to poor generalization. Additionally, the interpretability of CNNs is limited, making it difficult to understand the decision-making process fully. Conclusion Pretrained CNNs represent a powerful tool and a pipeline for phytoplankton species recognition, offering significant improvements in efficiency, scalability, and consistency over traditional methods. Continued advancements in machine learning and the availability of high-quality datasets will further enhance the capabilities of these models. Future research should focus on addressing current limitations, such as data quality and model interpretability, to fully realize the potential of CNNs in marine science. In this work, we will present the results as discussed to demonstrate possible workflows to fully realize the potential of CNNs in marine science and potentially contribute to the Standard Observations (SOs) addressing current limitations. We will also bring a workflow proposal to manage and perform actions related to harmonization, interoperability, quality control and sharing of the data obtained througth the CNNs recognitions following the directives proposed by Torstensson (2025).
We present 50 years of monitoring data on water quality of Lake Stechlin, a deep, dimictic hardwater lake in northeastern Germany known for its exceptionally clear water. Although located in a forested catchment, the lake has undergone major changes in recent decades, including a period of massive heating of surface water when receiving cooling water from a nearby nuclear power plant (1966–1990), accompanied by a greatly shortened water residence time from more than 40 years to less than 300 days. These changes are superimposed by a long-term trend of surface water warming and a concomitant decrease in winter ice cover. Total phosphorus concentrations have quadrupled since 2010 and zones of deep-water oxygen depletion have greatly expanded. The presented dataset covers basic water-chemical and physical records taken at monthly to fortnightly intervals from 1970 to 2020, documenting limnological changes during that period. Furthermore, it serves as a valuable basis to assess and project potential consequences of climate change and other types of environmental change on deep clearwater lakes in temperate climates.
Light regulates the vertical migration of many aquatic organisms. Mysis species couple pelagic and benthic habitats in lakes by diel vertical migrations (DVM), transporting energy and nutrients through the water column and food web. Although Mysis are generally assumed to remain on the bottom during the day, some have been observed in the pelagic zone during the day, indicating incomplete benthic-pelagic coupling in some systems. The degree to which light attenuation and lake depth interact to affect occurrence of mysids within the water column during the day is understudied. We used standardized Mysis net sampling in summers 2020 and 2021 across nine north-temperate lakes to test the hypotheses that 1) Mysis remain pelagic during the day at depths with sufficiently low light levels, and 2) pelagic-caught individuals during the day are, on average, smaller than those caught at night. To test these hypotheses, we assessed light, dissolved oxygen (DO), Mysis densities, and size distribution between night and day across bathymetric depths. In deep lakes and darkly colored shallow lakes, Mysis suspended in the water column during the day where light levels decreased to their light avoidance threshold (similar to 10(-5) to 10(-6) lx). Mysis suspended in the water column during the day were smaller than those collected at night. Further, Mysis were not captured when DO reached levels < 3 mg/L, regardless of light conditions. Our results suggest that benthic-pelagic coupling by Mysis is mediated through light conditions, lake morphometry, and DO conditions, and may include some degree of size-dependent behavior.
Terrestrial run-off is increasing in temperate lakes due to climate change and can lead to loading of colored dissolved organic matter (cDOM) and nutrients, thus reducing light availability and increasing carbon, nitrogen, and phosphorus. Run-off events are highly irregular, resulting in temporal resource variability that may determine the energy flow in planktonic communities. To understand the effects of run-off variability on natural plankton communities, we conducted a mesocosm experiment at SITES AquaNet in Lake Erken, Sweden. Treated mesocosms received equal total amount of cDOM and nutrients but at different frequencies and magnitudes (Daily, Intermittent, Extreme), while keeping an untreated Control. Here, we performed three surrogate prey incubation experiments with fluorescently labeled bacteria in the mesocosms to study the trophic strategies of nanoflagellates under the run-off scenarios. Our results show that phototrophic nanoflagellates increased under Daily and Intermittent additions of cDOM and nutrients at early stages but declined thereafter, likely due to light limitation and grazing by rotifers. Heterotrophic nanoflagellate biovolume was highest in the beginning, while the grazing rate on bacteria was highest in the middle of the experiment when bacterial abundance was highest. The mixotrophic nanoflagellate abundance was generally low and unaffected by the treatments, despite high bacterial densities and reduced light, while the highest abundance was found in the Control. The overall development of nanoflagellates was modulated by microzooplankton grazing pressure over time. Our study contributes to better understanding the influence of future global change, including variable terrestrial run-off scenarios, on food-web interactions considering both bottom-up and top-down processes.
Climate change is increasing the frequency, intensity, and stochasticity of extreme weather events such as heavy rainfall, storm-induced mixing, or prolonged drought periods. This results in more variable regimes of dissolved nutrients and carbon in lakes and induces temporal fluctuations in the resource availability for plankton communities, which can further lead to changes in growth and the cellular ratio of essential elements, such as carbon, nitrogen, and phosphorus. However, the current understanding of the effects of variations in regularity and frequency of precipitation events on both producer and consumer levels is limited by the lack of experimental studies examining processes at multiple trophic levels. In our mesocosm study, we added the same total amount of nitrate, phosphate, and colored dissolved organic matter (cDOM) to each mesocosm at pulses differing in frequency (daily, intermittent, or one extreme addition) and regularity (regular, irregular) over a simulated run-off period followed by a recovery period. Our results showed that phytoplankton biomass fully recovered to control conditions from one extreme nutrient and cDOM pulse, whereas pulses of higher frequency gradually increased the biomass. In terms of stoichiometry, the extreme pulse led to the lowest stability in particulate C : P and N : P ratios. At the zooplankton level, copepod biomass decreased across all nutrient and cDOM additions, but no effects between the treatments were found. Overall, our study demonstrates that phytoplankton stability depends on the regularity and frequency of nutrient additions and differs substantially between biomass and stoichiometry, but the effects may be buffered on zooplankton level.
Rapid and drastic anthropogenic impacts are affecting global biogeochemical processes and driving biodiversity loss across Earth's ecosystems. In aquatic ecosystems, species distributions are shifting, abundances of many species have declined dramatically, and many are threatened with extinction. In addition to loss of diversity, the ecosystem functions, processes and services on which humans depend are also being heavily impacted. Addressing these challenges not only requires direct action to mitigate environmental impacts but also innovative approaches to identify, quantify and treat their effects in the environment. Mesocosms are valuable tools for achieving these goals as they provide controlled environments for evaluating effects of stressors and testing novel mitigation measures at multiple levels of biological organisation. Here, we summarise discussions from a survey of marine and freshwater researchers who use mesocosm systems to synthesise their opportunities and limitations for advancing solutions to grand ecological challenges in aquatic ecosystems. While most research utilising mesocosm systems in aquatic ecology has focused on quantifying the effects of environmental threats, there is a largely unexplored potential for using them to test solutions. To overcome spatio-temporal constraints, there are opportunities to scale up the size and time-scales of mesocosm studies, or alternatively, test the outcomes of habitat-scale restoration at a smaller scale. Enhancing connectivity in future studies can help to overcome the limitation of isolation and test an important aspect of ecological recovery. Conducting 'metacosm' studies: coordinated, distributed mesocosm experiments spanning wide climatic and environmental gradients and utilising more regression-based experimental designs can help to tackle the challenge of context dependent results. Finally, collaboration of theoretical, experimental and applied ecologists and biogeochemists with environmental engineers and technological developers will be necessary to develop and test the tools required to advance solutions to the impacts of human activities on Earth's vulnerable aquatic ecosystems.
The growing utilization of remote sensing data in lake studies provides crucial spatial insights into biogeochemistry and biology. However, clarity regarding the development and intended use of remote sensing products is often lacking. This letter aims to elucidate the tradeoffs for the utilization of remote sensing data in limnological studies with an example of based on the estimation of chlorophyll a due to its importance as a water quality indicator. The analysis initiates with a meticulous product selection, requiring an evaluation of its capacity to address the optical complexity of freshwater systems. Assessing atmospheric correction and product limitations ensures alignment with the study's objectives. Subsequently, rigorous validation of remote sensing products is essential, accompanied by a cautious interpretation of the data. This letter advocates for the use of remote sensing data, offering key strategies for their optimal utilization in lake studies. The use of satellite remote sensing for monitoring water quality in inland water systems has been growing in the last decades especially due to the development of new orbital sensors (Kutser et al. 2020; Ogashawara 2021). Earth observations provide new angles for limnology, such as a universal perspective of multiple aquatic ecosystems simultaneously, regional to global coverage, the potential to acquire time series of data and its valuable input to predictive models. Additionally, it allows the retrieval of several parameters across the surfaces of an increasing number of smaller lakes, providing not only the surface area and elevation, but also surface biogeochemical data. The exponential growth of studies using this technology highlights that the improved computing resources, increased amount of satellite imagery, and development of operational remote sensing algorithms to understand complex inland water systems is now a reality (Topp et al. 2020). With the increasing access to satellite data, several organizations are developing remote sensing-based products for water quality. These products are currently distributed by national and international agencies (i.e., European Space Agency [ESA], US Geological Survey [USGS]), international programs (i.e., Copernicus Marine, Copernicus Land, and Copernicus Climate Change), academic research (i.e., Minnesota Lake Browser, https://lakes.rs.umn.edu/), and private industry (i.e., CyanoLakes, https://www.cyanolakes.com/; CyanoAlert, https://cyanoalert.com/). Typically, the data behind these products have undergone substantial processing including atmospheric correction, identification of quality issues, and bio-geo-optical algorithms to derive the desired bio-geophysical variables. Figure 1 exemplifies the main procedures for generating a quality controlled remote sensing-based water quality product (inland, coastal, and marine). Procedures are divided into five types: (1) the initial data needed (the Level 1 satellite imagery, the in situ radiometric data, the in situ bio-geo-optical properties [especially inherent optical properties] and in situ water quality curated data); (2) the remote sensing processes (atmospheric correction and bio-geo-optical modeling), 3) the validation processes (of the remote sensing processes using in situ collected data); (4) the remote sensing-based products such as the atmospheric and glint correction imagery; and (5) the water quality products which are produced by applying the selected bio-geo-optical algorithms (locally and seasonally adapted to the dominating water constituents and validated with in situ water quality data) to the atmospherically corrected image. Finally, the remote sensing-based product needs to pass a quality assurance and quality control (QA/QC) to generate a final curated product. As presented in Fig. 1, obtaining remote sensing-based water quality products is intricate, particularly for inland waters where optical properties are highly variable due to the naturally wide fluctuation in optically active constituents (OACs; i.e., phytoplankton pigments, colored dissolved organic matter [CDOM] and sediment) in the water column (Ogashawara et al. 2017). To illustrate this complexity, algal blooms can manifest in brown waters rich in CDOM and mobilized sediments that induce turbidity (Lebret et al. 2018). Due to this optical complexity, many remote sensing-based ocean color products mask out turbid waters, resulting in the exclusion of numerous freshwater systems. To promote the utilization of remote sensing technology and to enhance the understanding of the tradeoffs using remote sensing data, this letter addresses (i) the primary issues leading to problems in interpreting remote sensing data; (ii) the consequences of the misinterpretation; and (iii) suggests strategies for the utilization of remote sensing data, along with approaches to contribute to the reliable calibration and validation of remote sensing-based water quality products. The selection of the remote sensing product is one of the primary considerations for limnological studies. Remote sensing-based products are designed for open ocean (ocean color products), coastal or inland waters, and it is crucial to discern the differences among them before making a choice. These differences arise from the light availability within the water column, where, in a first approximation: (1) open ocean waters predominantly absorb the red part of visible light, (2) coastal waters and clear inland waters absorb both blue and red light, and (3) turbid inland waters strongly absorb from short wavelengths to the red part of visible light (Kirk 2011). Understanding these variations in the interaction between light and water facilitates the decision for the appropriate spectral region to be used during remote sensing data processing for atmospheric correction and bio-geo-optical modeling. One example highlighting the importance of selecting the appropriate spectral region is the computation of chlorophyll a (Chl a) concentration from satellite data. Processing algorithms developed for the open ocean rely on the blue and green spectral band ratio due to Chl a absorption around 440 nm and the very low CDOM background signal (O'Reilly and Werdell 2019). In contrast, coastal water products utilize the entire spectrum with a Neural Network approach (Brockmann et al. 2016), while inland water remote sensing products so far typically base calculations on the ratio of aquatic reflectance at 665 nm (red peak of Chl a absorption) and the red-edge around 700 nm (scattering of algal cells, Gitelson 1992). Given the low Chl a concentration in the open ocean, spectral bands within the red range are often dominated by water absorption and become unsuitable for Chl a retrieval. In inland waters (where CDOM is usually present), blue spectral bands are usually dominated by CDOM absorption, masking Chl a absorption at 440 nm, thus favoring the use of Chl a absorption at 665 nm. As a comparison, in situ Chl a sensors have recently been developed that use red light excitation rather than the traditional blue light excitation, in response to these optical challenges typical for coastal and inland waters. Additionally, it is crucial to highlight that open ocean, coastal, and inland water Chl a remote sensing products have been optimized for different concentration ranges, a factor that should be considered before using the data. Due to the intricate relationships between different water types and light, understanding the remote sensing data processing approaches in a remote sensing-based water quality product is essential for understanding the advantages and disadvantages of each product. Figure 2A presents examples of typical aquatic reflectance spectra (remote sensing reflectance) from different aquatic environments which visually highlights the contrast interactions between light and water. To showcase the importance of selecting the most suitable approach for estimating Chl a concentration Fig. 2BD,F presents three remote sensing-based Chl a products from the Sentinel 2 MultiSpectral Instrument (MSI) over lakes located in the Mecklenburg–Brandenburg Lake District in northeastern Germany (Ogashawara et al. 2021). We selected traditional remote sensing approaches for (i) open ocean (Fig. 2B), (ii) inland waters, and (iii) coastal waters (Fig. 2F). The visual differences among these three different remote sensing-based products for the Sentinel 2 MSI image (Scene ID: GS2A_20190726T102031_021369_N02.08) are further supported by scatter plots of the respective remote sensing estimated Chl a concentration and a water sample-based laboratory measurement of Chl a concentration using high-performance liquid chromatography (HPLC) done on the same day (Fig. 2C,E,G, respectively). In these examples, it was observed that the open ocean approach (Fig. 2C) underestimates the Chl a concentrations, the inland water approach (Fig. 2E) underestimates the Chl a for more eutrophic waters and the coastal approach (Fig. 2G) showed an underestimation for all Chl a concentrations. These results agree with the previous paragraph that when applying an open ocean approach in lakes the results may be strongly underestimating the true concentration of Chl a, especially in turbid waters, as the use of the blue and green regions of the visible spectrum are heavily affected by CDOM. It also highlights the importance of using in situ data to validate the selected satellite product—as the validation process is essential for the QA/QC (see Fig. 1). A major challenge for remote sensing data processing in inland waters (Fig. 1) is the atmospheric correction (Pahlevan et al. 2021). Atmospheric correction is the process of removing the optical effects of the atmosphere in the view field of a satellite or airborne sensor observing a target on the Earth's surface. A part of the atmospheric correction, is the glint correction which removes both the measured signal from light that is specularly reflected at the water surface from the sun, as well as reflected from the sky toward the sensor. Approximately, 90% of the total signal measured by a satellite stem from the atmosphere (IOCCG 2010), and the intensity of the glint can be higher than the intensity of the water leaving radiance, depending on the brightness of water, solar azimuth angle and on wavelength. Therefore, the accuracy requirements of the correction methods are much higher over water than over land. Figure 3 presents average reflectance spectra of a eutrophic lake for a Sentinel 2 MSI image without atmospheric correction (top-of-atmosphere reflectance—RTOA), with a land based atmospheric correction (surface reflectance—SR) and using an aquatic atmospheric correction for the computation of the Remote Sensing Reflectance (Rrs). A recent study performed a similar comparison for the Landsat SR products and showed that the use of SR products for the green and red spectral bands had uncertainties close to 30%, whereas the uncertainties in the blue and coastal-aerosol bands ranged from 48% to 110% when compared to in situ Rrs (Maciel et al. 2023). These results highlight the importance of having an aquatic atmospheric correction and to carefully evaluate the tradeoffs of the use of SR in limnological studies. Considering that there is no universally acceptable inland water atmospheric correction processor, limnological studies need to first validate different atmospheric correction processors as highlighted in Fig. 1. This validation of the atmospheric correction is crucial to make sure that the remote sensing data used as input for the studies using machine learning and artificial intelligence approaches (in which data quality is absolutely critical) are not largely biased. However, it becomes challenging because it requires in situ radiometric data to perform this validation. This type of data is still not commonly used by most scientists not specialized in remote sensing, despite that it is crucial to develop and calibrate the water atmospheric correction processors for inland and coastal waters. How to choose the right remote sensing-based water quality product? Before incorporation of remote sensing data in aquatic research, it is important to look for the Algorithm Theoretical Basis Document (ATBD) of the remote sensing-based product and the proper reference of the product to precisely understand its development and limitations. Another recommendation is to use remote sensing-based products, which have been standardized and quality controlled by a reputable organization, such as the Committee on Earth Observation Satellites (CEOS) that recently created a minimum set of requirements for different remote sensing-based products (CEOS 2021). With this verification of quality by CEOS, it will be easier to identify if the retrieved information is trustful or not. Finally, a simple recommendation is to always use a remote sensing-based product developed for the specific type of water under investigation: open ocean, coastal or inland waters. While ocean color products (made for open ocean) are easy to find for inland waters, inland water global products are still scarce due to the optical complexity of these aquatic environments. Nevertheless, some products were developed for global inland waters based on a blended algorithm approach which first classifies the aquatic system by its optical similarities (optical water typology) and then estimates other parameters. Some examples of these products are the Copernicus Land Lakes Water Quality product (https://land.copernicus.eu/global/products/lwq) and the European Space Agency Lakes Climate Change Initiative (https://climate.esa.int/en/projects/lakes/). While these initiatives are based on lakes, they also include reservoirs, however, these are global products and may not be optimized for a specific study site. Additionally the US Geological Survey (USGS) has a provisional product of aquatic reflectance which is produced after running an aquatic atmospheric correction (https://www.usgs.gov/landsat-missions/landsat-provisional-aquatic-reflectance), however it is still not fully validated for inland waters and it is still in provisional phase. How to choose the right remote sensing processes? To help with the selection of the best approach, Neil et al. (2019) proposed a tree scheme to simply identify the best bio-geo-optical algorithm to use for Chl a concentration estimation based on the trophic state of the aquatic system where: the open ocean approach should be used for oligotrophic waters, the inland water approach should be used for mesotrophic and eutrophic waters and a quasi-analytical approach should be used for hypertrophic waters. This decision tree is very helpful for an initial selection of the remote sensing data processing approach; however, there are aquatic systems which are not covered, for example, aquatic systems with very high CDOM concentration (polyhumic waters). Similarly, Pahlevan et al. (2021) tested different atmospheric corrections processors and provided a ranking per optical water type which can facilitate the selection of the atmospheric correction approach. How to improve remote sensing-based water quality products for my study site? To improve these products for a regional level, it is useful to follow the indicated processing chain of Fig. 1. This will require in situ radiometric data, thus there is an urge for the collection of this type of data. However, matching data with satellite passages is a big challenge. From the total 12,000 worldwide Rrs spectra compiled by Maciel et al. (2023) just a small part (N = 1100) had match-ups with satellite data. This fact highlights the need to align field sampling with satellite passages on cloud free days, which can be difficult for some parts of the world where cloud cover is unpredictable. In these areas, the deployment of sensors could be an alternative for the acquisition of in situ radiometric, optical properties and water quality data. Ideally, such deployed systems should be equipped with autonomous in situ systems for all required parameters, and they need to be deployed in carefully selected aquatic reference systems which would cover a gradient of organic matter, different trophic levels, and different catchments. This would allow to acquire match-up data for calibration and validation that can be extended to optically similar waters. A well-validated atmospheric correction can strengthen the accuracy of water quality products, which depend on your choice of the bio-geo-optical model. Regarding the existing water quality monitoring programs, the data collection of the absorption coefficient of CDOM (aCDOM), the concentration of total suspended solids (TSS) and the concentration of phytoplankton pigments should be emphasized as essential variables. How to use remote sensing data without in situ radiometric data to validate the atmospheric correction? Considering that in situ radiometric data is still not a common measurement for many scientists working in inland and coastal waters, it is important to highlight the existence of aquatic reflectance products such as: the Copernicus Land Lakes Water Quality product, the European Space Agency Lakes Climate Change Initiative and the USGS provisional product of aquatic reflectance. These products could be carefully used for limnological studies—including machine learning and artificial intelligence of big data analysis. Another alternative is the use of different atmospheric correction approaches based on the optical water type of your system (as in Pahlevan et al. 2021) and to use the existing in situ water quality data to validate the estimation from satellite data coming from different atmospheric correction processors. This acknowledges the importance of having an atmospheric correction targeting inland waters and can be used to calculate the uncertainties of this process. How to best align scientists working in inland and coastal waters, with remote sensing scientists? Fortunately, inland water remote sensing is rapidly developing as a new discipline and several initiatives have been launched recently to disseminate remote sensing applications and products better. International networks such as the Group of Earth Observation (GEO) AquaWatch, the International Water Association (IWA) and the World Water Quality Alliance (WWQA) have been offering free webinars to inform the inland water research community on the current state-of-the-art of inland water remote sensing. With the global reach of these networks helping to disseminate the knowledge of remote sensing to non-remote sensing experts. Another network is the Global Lake Ecological Observatory Network (GLEON) which started in the United States and has been expanding worldwide and currently hosts a working group on Aquatic Remote Sensing which was created to establish the relationship between aquatic ecologists and remote sensing experts. These initiatives are complemented by online training which are available to anyone in the world such as the courses offered by the National Aeronautics and Space Administration (NASA) program on Applied Remote Sensing Training (ARSET). The continuous growth and acceptance of remote sensing technology in limnology coupled with the standardization of satellite-based water quality products and the increase in data collection for calibration and validation offers the unique opportunity of operational use of such technology for reliable inland water monitoring. This will be achieved when aquatic sciences and remote sensing communities will join forces for the calibration and validation of the remote sensing-based water quality products with in situ radiometric and biogeochemical data. This will enable users to put results into adequate context and to understand the tradeoffs of the use of remote sensing data in the future. More synergies between these communities are needed to harmonize products, offer training materials and guides for the best use of remotely sensed data, as well as re-evaluate previously published material based on the newer approaches outlined above. Such synergies will effectively help to overcome methodological limitations and improve our ability to accurately monitor our rapidly changing inland waters. This work was funded by a collaborative research grant of the Leibniz Competition within the project CONNECT—Connectivity and synchronization of lake ecosystems in space and time (No. K45/2017). IO was partially supported by the H2020 project Water-ForCE (GA No. 101004186). Open Access funding enabled and organized by Projekt DEAL. The authors have declared no conflict of interest.
Changes and disturbances to water diversity and quality are complex and multi-scale in space and time. Although in situ methods provide detailed point information on the condition of water bodies, they are of limited use for making area-based monitoring over time, as aquatic ecosystems are extremely dynamic. Remote sensing (RS) provides methods and data for the cost-effective, comprehensive, continuous and standardised monitoring of characteristics and changes in characteristics of water diversity and water quality from local and regional scales to the scale of entire continents. In order to apply and better understand RS techniques and their derived spectral indicators in monitoring water diversity and quality, this study defines five characteristics of water diversity and quality that can be monitored using RS. These are the diversity of water traits, the diversity of water genesis, the structural diversity of water, the taxonomic diversity of water and the functional diversity of water. It is essential to record the diversity of water traits to derive the other four characteristics of water diversity from RS. Furthermore, traits are the only and most important interface between in situ and RS monitoring approaches. The monitoring of these five characteristics of water diversity and water quality using RS technologies is presented in detail and discussed using numerous examples. Finally, current and future developments are presented to advance monitoring using RS and the trait approach in modelling, prediction and assessment as a basis for successful monitoring and management strategies.
Cyanobacterial blooms present substantial challenges to managers and threaten ecological and public health. Although the majority of cyanobacterial bloom research and management focuses on factors that control bloom initiation, duration, toxicity, and geographical extent, relatively little research focuses on the role of loss processes in blooms and how these processes are regulated. Here, we define a loss process in terms of population dynamics as any process that removes cells from a population, thereby decelerating or reducing the development and extent of blooms. We review abiotic (e.g., hydraulic flushing and oxidative stress/UV light) and biotic factors (e.g., allelopathic compounds, infections, grazing, and resting cells/programmed cell death) known to govern bloom loss. We found that the dominant loss processes depend on several system specific factors including cyanobacterial genera-specific traits, in situ physicochemical conditions, and the microbial, phytoplankton, and consumer community composition. We also address loss processes in the context of bloom management and discuss perspectives and challenges in predicting how a changing climate may directly and indirectly affect loss processes on blooms. A deeper understanding of bloom loss processes and their underlying mechanisms may help to mitigate the negative consequences of cyanobacterial blooms and improve current management strategies.
In recent decades, inland water remote sensing has seen growing interest and very strong development. This includes improved spatial resolution, increased revisiting times, advanced multispectral sensors and recently even hyperspectral sensors. However, inland waters are more challenging than oceanic waters due to their higher complexity of optically active constituents and stronger adjacency effects due to their small size and nearby vegetation and built structures. Thus, bio-optical modeling of inland waters requires higher ground-truthing efforts. Large-scale ground-based sensor networks that are robust, self-sufficient, non-maintenance-intensive and low-cost could assist this otherwise labor-intensive task. Furthermore, most existing sensor systems are rather expensive, precluding their employability. Recently, low-cost mini-spectrometers have become widely available, which could potentially solve this issue. In this study, we analyze the characteristics of such a mini-spectrometer, the Hamamatsu C12880MA, and test it regarding its application in measuring water-leaving radiance near the surface. Overall, the measurements performed in the laboratory and in the field show that the system is very suitable for the targeted application.
 Jens Christian Nejstgaard合作论文数Bergen High Technology Centre, University of Bergen53
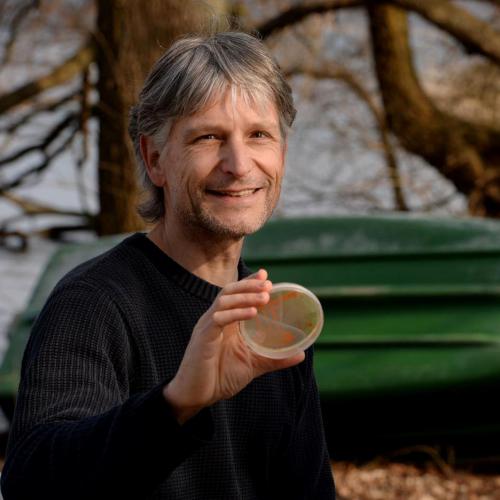 Hans Peter Grossart合作论文数Department of Plankton and Microbial Ecology, Leibniz-Institute of Freshwater Ecology and Inland Fisheries28
 Sabine Wollrab合作论文数Department Biologie II, Ludwig-Maximilians-Universität München14
 Mark Gessner合作论文数Department of Plankton and Microbial Ecology, Leibniz Institute of Freshwater Ecology and Inland Fisheries;Department of Ecology, Faculty VI Planning Building Environment, Berlin Institute of Technology13
 Sebastian Diehl合作论文数Department of Ecology and Environmental Sciences, Umea University12
 Christine Kiel合作论文数10
 Andreas Jechow合作论文数Centre for Quantum Dynamics;University;Centre for Quantum Dynamics|University10
 Robert Ptacnik合作论文数WasserCluster Lunz;Faculty of Technology, Natural Sciences and Maritime Sciences, University of South-Eastern Norway9
 Igor Ogashawara合作论文数Remote Sensing Div, Natl Inst Space Res8
 Herwig Stibor合作论文数8Gabriel A. Singer合作论文数7
 Franz Hölker合作论文数Leibniz-Institute of Freshwater;Ecology and Inland Fisheries;Ecology and Inland Fisheries, Leibniz-Institute of Freshwater7
 Silke Langenheder合作论文数Limnology / Department of Ecology and Evolution;Evolutionary Biology Centre;Uppsala University;Evolutionary Biology Centre, Uppsala University6
 Maren Striebel合作论文数Department Biologie II, Ludwig-Maximilians-Universität München6
 Georgiy Kirillin合作论文数Department of Ecohydrology, Leibniz-Institute of Freshwater Ecology and Inland Fisheries5
 Darren Giling合作论文数5Tim J. W. Walles合作论文数4Susanne Stephan合作论文数Department Experimental Limnology, Leibniz Institute of Freshwater Ecology and Inland Fisheries, Stechlin, Germany.4
 Mina Bizic合作论文数Leibniz Inst Freshwater Ecol & Inland Fisheries, Dept Expt Limnol, Stechlin, Germany4
 Erik Sperfeld合作论文数Institute of Biochemistry and Biology, University of Potsdam4Van den Wyngaert Silke合作论文数4
 Despoina Sousoni合作论文数Department of Biology, University of Crete4Andrey F. Sazhin合作论文数4
 Anne Lyche Solheim合作论文数Norwegian Institute for Water Research (NIVA)4
 Meryem Beklioglu合作论文数Department of Biology, Middle East Technical University4
 James A Rusak合作论文数Center for Limnology;University of Wisconsin;Center for Limnology, University of Wisconsin4
 Marc Frischer合作论文数4
 Gunnar Lischeid合作论文数4
 Stamatina Isari合作论文数Department of Biology, University of Patras4
 Albert Calbet合作论文数Department of Marine Biology and Oceanography, Institut de Ciencies del Mar, CSIC4
 Jay A. Brandes合作论文数Skidaway Institute of Oceanography4
 Ute Mischke合作论文数4Armin Penske合作论文数3
 Ted Harris合作论文数Kansas Biological Survey and Center for Ecological Research3
 Franziska Kupprat合作论文数Fac Life Sci, Humboldt Univ3
 A. Guislain合作论文数3Jeremy Fonvielle合作论文数Ecosyst & Global Change Grp, Univ Cambridge3
 Katrin Kohnert合作论文数Dept Expt Limnol, Leibniz Inst Freshwater Ecol & Inland Fisheries3
 Camille Musseau合作论文数Berlin-Brandenburg Institute of Advanced Biodiversity Research3Kiyoko Yokota合作论文数SUNY Coll Oneonta, SUNY Oneonta3
 Lars Ganzert合作论文数3
 Rachel Pilla合作论文数Section Parasitology, Bernhard Nocht Institute for Tropical Medicine;Section Parasitology, Bernhard Nocht Institute for Tropical Medicine3
 Gabriela Onandia合作论文数3
 Shatwell Tom合作论文数Department of Ecohydrology, Leibniz-Institute of Freshwater Ecology and Inland Fisheries (IGB),3Martínez Rodrigo合作论文数Department of Biotechnology and Food Science, University of Burgos3
 Georg Pohnert合作论文数Institute for Inorganic and Analytical Chemistry, Faculty of Chemistry and Earth Sciences, Friedrich Schiller University Jena;Jena Center for Soft Matter, Friedrich Schiller University Jena3
 Soultana Zervoudaki合作论文数Institute of Oceanography, Hellenic Centre for Marine Research3
 Birger Skjelbred合作论文数3
 Erik Jeppesen合作论文数Department of Ecoscience - Freshwater Ecology, Aarhus University;Arctic Research Centre, Aarhus University3




