Temperature changes in permafrost within the depth of annual temperature variations are often modeled as a pure heat conduction problem in a homogeneous semi-infinite region with an equilibrium initial condition and a harmonic furction of time representing seasonal changes in subsurface temperature. Continuous temperature measurements at the permafrost table show that the temperature there can be better approximated by a step or truncated cosine function. Analytical solutions of this heat conduction problem have been obtained for both step and truncated cosine boundary conditions. A temperature oscillation in the form of a step or truncated cosine function at the permafrost table gradually becomes sinusoidal with depth.
Permafrost degradation associated with a warming climate is second only to wildfires as a major disturbance to boreal forests. Permafrost temperatures have risen to 4 degrees C since the "Little Ice Age", resulting in widespread thawing of permafrost. The mode of permafrost degradation is highly variable, and its topographic and ecological consequences depend on the interaction of slope position, soil texture, hydrology, and ice content. We partitioned this variability into 16 primary modes: (1) thermokarst lakes from lateral thermomechanical erosion; (2) thermokarst basins after lake drainage; (3) thaw sinks from subsurface drainage of lakes; (4) glacial thermokarst of ice-cored moraines; (5) linear collapse-scar fens associated with shallow groundwater movement; (6) round isolated collapse-scar bogs from slow lateral degradation; (7) small round isolated thermokarst pits from surface thawing; (8) polygonal thermokarst mounds from advanced ice-wedge degradation; (9) mixed thermokarst pits and polygons from initial ice-wedge degradation; (10) irregular thermokarst mounds from thawing of ice-poor silty soils; (11) sinkholes and pipes resulting from groundwater flow; (12) thermokarst gullies and water tracks from surface-water flow; (13) thaw slumps related to slope failure and thawing; (14) thermo-erosional niches from water undercutting of ice-rich shores; (15) collapsed pingos from thawing of massive ice in pingos; and (16) nonpatterned ground from thawing of ice-poor soils. These modes greatly influence how thermokarst changes or disrupts the ground surface, ecosystems, human activities, infrastructure, and the fluxes of energy, moisture, and gases across the land-air interface.
Permafrost carbon release The enormous amounts of carbon stored deep in permafrost soils — permafrost ecosystems contain almost twice as much carbon as is present in the atmosphere — have the potential to create a positive feedback to climate change if released into a warming world. The bulk of the permafrost carbon pool consists of 'old' carbon, accumulated over thousands of years, but the rate of carbon release from these soils is highly uncertain. Schuur et al . report data on net ecosystem carbon exchange and the radiocarbon age of ecosystem respiration from a long-term monitoring site in Alaska where permafrost temperatures have been directly measured since 1985, and observed to warm since then. They find significant losses of soil carbon with permafrost thaw that, over decadal timescales, overwhelms increased plant carbon uptake at rates that could make permafrost a large biospheric carbon source in a warmer world.
Geologic Monitoring is a practical, nontechnical guide for land managers, educators, and the public that synthesizes representative methods for monitoring short-term and long-term change in geologic features and landscapes. A prestigious group of subject-matter experts has carefully selected methods for monitoring sand dunes, caves and karst, rivers, geothermal features, glaciers, nearshore marine features, beaches and marshes, paleontological resources, permafrost, seismic activity, slope movements, and volcanic features and processes. Each chapter has an overview of the resource; summarizes features that could be monitored; describes methods for monitoring each feature ranging from low-cost, low-technology methods (that could be used for school groups) to higher cost, detailed monitoring methods requiring a high level of expertise; and presents one or more targeted case studies.
A finite difference numerical model for determining brine expulsion in soils during freezing was developed for application to saline sands. This model was similar to that developed by Cox and Weeks (1975) for the freezing of sodium chloride solutions but adapted to account for the presence of a sandy matrix. Application of the model revealed that brine expulsion alone could account for only a few percent of the total salt movement within the partially frozen region during freezing. This was observed for several constant freezing rates ranging from about 1 mrn d-* to 20 mm d-1. In addition. the results further suggest that brine drainage, probably by salt fmgering, is primarily responsible for salt redistribution during the freezing of saline sands. This paper is a progress report which discusses the experimental observations of brine movement during the freezing of saline sand columns, the current interpretation of these observations, and initial results from additional laboratory freezing tests under simulated natural freezing conditions. Un modkle numkique aux diffkrences fmies permettant de reprbenter l'expulsion de la saurnure dam les sols pendant le gel a kt6 mis au point en vue de son application aux sables salins. Ce modkle est sernblable B celui mis au point par Cox et Weeks (1975) pour le gel de solutions de chlorure de sodium, mais a kt6 adapt6 pour tenir compte de la prbence d'une matrice sableuse. L'application du modMe a rkvtlk que l'expulsion par le gel de la saumure ne pouvait B elle seule expliquer que quelques pour cent du mouvement total de la saumure dam la zone partiellement gelte. L'observation a k d rtpktte pour plusieurs taux de congtlation constants allant d'environ 1 mm/j h 20 mmlj. En outre, les rbultats indiquent que le drainage de la saumure, probablement par digitation du sel, est la principale cause de la redistribution du sel pendant le gel des sables salins.
Interstitial water samples have been obtained from the thawed layer beneath the sea bed at Prud- hoe Bay, Alaska, using a probe method. The electrical conductivities of the water samples, and there- fore the salinities, are about 25 per cent higher than those of normal sea water. This difference may be due to a density-filtering process caused by convection of the interstitial water. The high salinity causes the phase boundary temperature at the bottom of the thawed layer, where ice-bearing perma- frost exists, to be lower than the freezing point of normal sea water. A rather uniform value of - 2.4OC, corresponding to a salinity of about 43 per mille, is found out to 3.5 km from shore. A downward salt flux exists at the bottom of the thawed layer, and the electrical conductivity of the interstitial water at one site shows evidence for a thin boundary layer there, in which the salt transport regime seems to change from convective to diffusive. Above this layer, the salinity gradients are low, as would be expected in a well-developed convective regime. A characteristic interstitial water speed at a site 700 m from shore appears to be of the order of a few tenths of a metre per year.
There is a perception that climatic warming was the cause of the twentieth‐century global warming and thawing of permafrost and associated terrain instability (thermokarst) [Gore, 2006; Perkins, 2007; Zielinski, 2007; Delisle, 2007]. While pertinent data are sparse, published results do not support this viewpoint [Zhang et al., 2001; Osterkamp, 2007]. This brief report reviews the warming of permafrost in Alaska during the twentieth century and shows that snow cover has played a significant role in it.Air temperatures in Alaska increased from the late 1800s until the early 1940s and decreased during the third quarter of the century. While the long‐term data are sparse, snow cover appears to have increased during the third quarter. Air temperatures increased sharply (1°–2°C) at the start of the fourth quarter, but trends to the end of the century were variable. Some sites warmed while others showed little or no warming or a cooling.
At the northernmost three sites, annual mean air and ground temperatures vary significantly in a cyclic manner with high temperatures in the late 1980s and late 1990s and maxima in 1989 and in 1998-1999. Temperatures were colder earlier in mid-1980s and slightly colder in the early 1990s. There was a long-term increase in temperatures during the entire period of measurements. Annual mean air temperatures at all three sites are very similar, while the ground and permafrost temperatures at West Dock are several degrees colder than at Deadhorse and Franklin Bluffs. A significantly shallower and slightly more conductive snow cover and a smaller range in seasonal air temperature variations at the West Dock site are responsible for these differences. The recent warming increased soil temperatures about 3degreesC over long-term averages. Annual mean temperatures of the ground and permafrost surfaces near Ivotuk are about -2 to -3degreesC, which is 2 to 3degreesC warmer than at the Deadhorse and Franklin Bluffs sites. This probably attributes to the differences in the snow cover thickness and its thermal properties.
Twenty-five years ago a programme was initiated to establish a statewide system of permafrost observatories that included boreholes drilled for the express purpose of investigating the effects of changes in climate on continuous and discontinuous permafrost. A total of 22 permafrost observatories have been established with boreholes 15 to 80 in in depth. These sites are primarily along a north-south transect of Alaska paralleling the Alyeska oil pipeline from Prudhoe Bay to Glennallen and are visited and serviced annually. There are seven additional borehole sites with holes 15 to 80 in in depth that are visited occasionally. The sites are in undisturbed locations with nearly uniform conditions in a wide variety of environmental settings except for a few, purposefully placed in disturbed areas (e.g. farm field, burn, etc.). Proximity to meteorological stations with long weather records has allowed reconstruction of past active-layer and permafrost conditions using calibrated site-specific models. The sites have been used to document a recent warming trend in permafrost and active-layer temperatures and to investigate the characteristics of the permafrost and active layer and processes that occur in them. Recommendations are made for establishing future observatories. Copyright (C) 2003 John Wiley Sons, Ltd.
Air temperatures at high latitudes are expected to rise significantly as anthropogenic carbon builds up in the atmosphere. There is concern that warming of the ground in permafrost regions will result in additional release of carbon to the atmosphere. Recent emphasis has thus been on predicting the magnitude and spatial distribution of future warming at high latitudes. Modeling results show that changes in below ground temperatures can be influenced as much by temporal variations of snow cover as by changes in the near‐surface air temperature. The recent (1983–1998) changes in permafrost temperatures on the North Slope of Alaska are consistent with decadal scale variability in snow cover. The implication of these results is that a better understanding of how winter precipitation patterns at high latitudes will change over the coming decades is needed to comprehend evolving permafrost temperatures.
There has been a widespread warming of air temperatures in Alaska since 1977 and some warming of permafrost. Constant or cooling permafrost temperatures followed this in the early 1980s, probably due to thin snow covers and a short cooling trend. Permafrost temperatures along a north south transect from Prudhoe Bay to Gulkana and at other sites have generally warmed since the late 1980s, initially in response to thicker snow covers. The warming north of the Brooks Range is comparable in magnitude to the century long warming there (2 to 4degreesC). The trend has not been followed at Eagle and the Yukon River bridge. Warming of the discontinuous permafrost is typically 1/2 to 1 1/2degreesC. Thin discontinuous permafrost is thawing at the base at a rate of 0.04 m per year at one site. New thermokarst and thawing permafrost have been observed at several sites.
Thermokarst is developing in the boreal forests of Alaska where ice-rich discontinuous permafrost is thawing. Thawing destroys the physical foundation (ice-rich soil) on which boreal forest ecosystems rest causing dramatic changes in the ecosystem. Impacts on the forest depend primarily on the type and amount of ice present in the permafrost and on drainage conditions. At sites generally underlain by ice-rich permafrost, forest ecosystems can be completely destroyed. In the Mentasta Pass area, wet sedge meadows, bogs, thermokarst ponds, and lakes are replacing forests. An upland thermokarst site on the University of Alaska Campus consists of polygonal patterns of troughs and pits caused by thawing ice-wedge polygons. Trees are destroyed in corresponding patterns. In the Tanana Flats, ice-rich permafrost supporting birch forests is thawing rapidly and the forests are being converted to minerotrophic floating mat fens. At this site, an estimated 83% of 2.6*105 ha was underlain by permafrost a century or more ago. About 42% of this permafrost has been influenced by thermokarst development within the last 1 to 2 centuries. Thaw subsidence at the above sites is typically 1 to 2 m with some values up to 6 m. Much of the discontinuous permafrost in Alaska is extremely warm, usually within 1 or 2°C of thawing, and highly susceptible to thermal degradation. Additional warming will result in the formation of new thermokarst.
Precise temperature data from four Alaskan permafrost sites (Prudhoe Bay, Barrow and two sites near Fairbanks) combined with computer modelling provide quantitative measures of the existence and dynamics of unfrozen water in the active layer and permafrost. Unfrozen water contents are negligible for living and dead moss layers, small in the peat layers and larger in the silts, and show significant site-to-site variation. The effect of unfrozen water on the ground thermal regime is largest immediately after freeze-up and during cooling of the active layer. It is less important during warming and thawing of the active layer and during freezing and thawing of seasonally frozen ground. The effects last less than a month in cold permafrost and throughout most of the freeze-up period in warm permafrost. Physically, unfrozen water introduces a spatially distributed latent heat and changes thermal properties which retards the thermal response of an active layer or permafrost. Unfrozen water in the freezing and frozen active layer and nearsurface permafrost also protects the ground from rapid cooling and creates a strong thermal gradient at the ground surface that increases the heat flux out of the ground. This enlarged heat flux also enhances the insulating effect of the snow cover. There do not appear to be any inherent difficulties in using conductive heat modelling for the active layer during the period when the zero curtain exists. Copyright (C) 2000 John Wiley & Sons, Ltd.
 Vladimir E. Romanovsky合作论文数Permafrost Laboratory, Geophysical Institute, University of Alaska Fairbanks16
 J. P. Gosink合作论文数15kunihiro kawasaki合作论文数9
 Tingjun Zhang (张廷军)合作论文数Cooperative Institute for Research in Environmental Sciences, University of Colorado at Boulder;College of Earth and Environmental Sciences, Lanzhou University6William D. Harrison合作论文数5WD HARRISON合作论文数5R. E. Gilfilian合作论文数5
 M. Torre Jorgenson合作论文数Alaska Biological Research Inc;Arctic Institute of North America;Alaska Biological Research Inc, Arctic Institute of North America4R.W. Jurick合作论文数4
 Yuri Shur合作论文数Water and Environmental Research Center, Institute of Northern Engineering, College of Engineering and Mines, University of Alaska Fairbanks3
 Knut Stamnes合作论文数Department of Physics, School of Engineering and Science, Stevens Institute of Technology3G. C. Baker合作论文数3Jason G. Vogel合作论文数2james h scott合作论文数2john k petersen合作论文数2
 John E. Walsh合作论文数Department of Climate, Meteorology & Atmospheric Sciences, School of Earth, Society & Environment, University of Illinois Urbana-Champaign;International Arctic Research Center, University of Alaska Fairbanks2
 Edward (Ted) Schuur合作论文数Center for Ecosystem Sciences and Society, Department of Biological Sciences, College of the Environment, Forestry, and Natural Sciences, Northern Arizona University;University of Alaska2Charles S Benson合作论文数2James O. Sickman合作论文数Department of Environmental Sciences, University of California2Kathryn G. Crummer合作论文数2Mark B. Dyurgerov合作论文数2d o sergueev合作论文数1tatiana sergeevna sazonova合作论文数1Rf Paetzold合作论文数1C. S. Benson合作论文数1A. Doyle合作论文数1si akasofu合作论文数university of alaska fairbanks1
 Jonathan T. Overpeck合作论文数School for Environment and Sustainability, University of Michigan;Department of Geosciences, University of Arizona1
 William D. Nordhaus合作论文数Department of Economics, School of Forestry and Environmental Studies, Yale University1
 Walter Oechel合作论文数Coastal and Marine Institute, San Diego State University;Department of Biology, San Diego State University1
 Hanna Lee合作论文数1
 Peter B. Rhines合作论文数School of Oceanography, College of the Environment, University of Washington;Department of Atmospheric Sciences, College of the Environment, University of Washington1
 Arthur H. Lachenbruch合作论文数United States Geological Survey1
 F Stuart Chapin, III (Terry)合作论文数Institute of Arctic Biology, University of Alaska Fairbanks;Department of Biology and Wildlife, University of Alaska Fairbanks;Institute of Sustainable Places, Cardiff University1
 Thomas Stocker合作论文数Oeschger Centre for Climate Change Research, University of Bern1
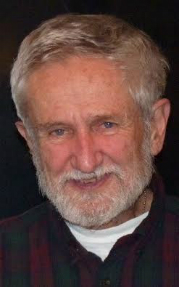 John M. (Mike) Wallace合作论文数Department of Atmospheric Sciences, University of Washington1tianmeng zhang合作论文数1P. Hoekstra合作论文数1Mark C. Serreze合作论文数1
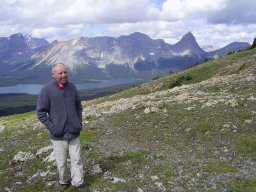 Stephen J. Dery合作论文数Environmental Science and Engineering Program;University of Northern British Columbia;Environmental Science and Engineering Program, University of Northern British Columbia1Gerald G. Walker合作论文数1
 Roger A. Pielke合作论文数Center for Science and Technology Policy Research1
 James H. Morison合作论文数Polar Science Center;Applied Physics Laboratory;Polar Science Center|Applied Physics Laboratory1
 Raymond T. Pierrehumber合作论文数Atmospheric Physics Clarendon Laboratory, Department of Physics, University of Oxford1
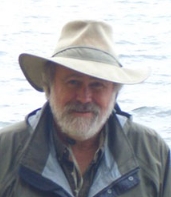 Frederick (Fritz) E. Nelson合作论文数Department of Geography, Environment, and Spatial Sciences, College of Social Science, Michigan State University;Department of Geography, College of Letters & Science, University of Wisconsin-Milwaukee;Northern Michigan University;Department of Geography, University of Delaware1
 Dorothy M Peteet合作论文数Goddard Institute for Space Studies, NASA;Paleoecology Division, New Core Lab, Lamont Doherty Earth Observatory of Columbia;Department of Earth and Environmental Sciences, Columbia University1W. M. Sackinger合作论文数1Jk Petersen合作论文数1
 Jochem Marotzke合作论文数Max Planck Institute for Meteorology1




