Sustainable cooling for urban development is important to achieve a living standard. The urban sustainability transition requires comprehensive strategies that integrate energy efficiency technologies, green infrastructure, and climate-responsive urban planning. This approach not only reduces greenhouse gas emissions, but also ensures thermal comfort and improves the quality of life in urban areas. However, various strategies are implemented, even those involved with complex calculations, especially handling the complexity of building façade, yet they often neglect the spatially dynamic interactions between structures and their environment. This limitation highlights a significant gap in the current urban cooling solution. In this case, the Geographic Information System (GIS) is known for its capabilities of spatial data handling, storage, and management, as well as representation. By merging geometrical and semantic components, 3D city models facilitate a range of automated analyses, particularly for different applications related to urban planning. The integration of spatial and non-spatial data enabled the creation of detailed energy demand profiles at building scale. This study aims to assess the cooling demand of buildings by integrating the 3D city model with the cooling demand calculations. To achieve this, the study used the 3D city model of the building at Lingkaran Ilmu Universiti Teknologi Malaysia as the study area. CityJSON is chosen to interpret the feature and visualise the 3D city models. Additionally, the overall thermal transfer value (OTTV) equation is applied to calculate the cooling demand. The results show that the integration of spatial and non-spatial data within 3D city model enables more comprehensive energy analysis. The study emphasises the need for spatial information for energy planning and the influence of spatial components on building energy consumption. This research contributes to the growing field of sustainable urban development by establishing replicable methods to assess the cooling demand for buildings through integrated geospatial and energy demand calculations.
Traditional noise mapping methods often overlook the complex spatial dynamics and vertical variability associated with urban noise propagation. In this study, we present a machine learning (ML) framework that integrates both 2D and 3D modelling for traffic noise prediction in a campus environment. We employed multilayer perceptron (MLP), extreme gradient boosting (XGB), and the traditional CoRTN model to predict equivalent continuous sound levels (LAeq) based on traffic, topographic, and land use factors. The XGB model achieved the highest performance with an R² = 0.95, MAE = 0.91, MSE = 2.75. Model interpretation and robustness were examined using SHAP and global sensitivity analysis, identifying road proximity as the dominant predictor, with traffic composition and spatial context variables acting as secondary, interaction-dependent factors. High-resolution 2D noise maps captured spatial patterns aligned with observed data, while the ML-based 3D voxel model produced detailed façade-level noise profiles. A consistent vertical attenuation trend was observed, with high exposure (> 65 dB) decreasing from 55
This study examines how artificial intelligence and machine learning are being used in townscape assessment and urban design research. A PRISMA-style Scopus review identified 72 studies published between 2007 and 2025. Structural Topic Modelling was used to identify thematic clusters, trace temporal patterns and align topics with nine townscape attributes. The final K = 8 model identified two mature topics: image-based urban modelling and LiDAR/point-cloud vegetation mapping. Urban clustering, landscape indicators, land-use/public-space analytics and street-view environmental analysis appeared as developing topics. Affective/generative design and urban network prediction remained emerging or fragmented. Topic–attribute mapping showed stronger coverage of form, vegetation, connectivity, land-use and public realm. In contrast, topography, water, skyline, enclosure and architectural style remained weakly operationalised. Robustness checks supported the broad stability of the topic structure. The study contributes TownscapeBench v0.1 as an operational pilot reporting standard for reproducible AI-enabled townscape assessment and future benchmarking.
PurposeHigh-rise residential buildings face persistent maintenance inefficiencies due to reactive workflows, poor spatiotemporal integration, and suboptimal resource allocation. Current approaches inadequately address the complexities of vertical structures and dynamic maintenance requirements, creating critical gaps in proactive management. This study aims to bridge these gaps by developing and validating a 3D GIS-integrated rule-based scheduling model, enhancing proactive decision-making, resource optimisation, and regulatory compliance.Design/methodology/approachA 3D GIS-integrated rule-based scheduling model was developed, combining spatial visualisation, temporal analytics and Unified Modeling Language (UML) logic. A dataset of 4,070 maintenance work orders was collected from three high-rise residential buildings managed by a Malaysian university Asset Management Department (2020-2024). Data were digitised, modeled in SketchUp, integrated via ArcGIS Pro and PostgreSQL/PostGIS, and validated against manual scheduling.FindingsThe model reduced delays in high-priority tasks by 17%, improved compliance with task urgency by 23%, and achieved 100% technician utilisation. It also supported spatiotemporal fault visualisation, trend detection, and workload balancing. Lean maintenance principles and life cycle cost analysis were embedded, ensuring alignment with Malaysia's Strata Management Act 2013.Practical implicationsThe model offers facility managers, developers, and Management Corporation a scalable, data-driven tool for improving scheduling efficiency and regulatory compliance in high-rise maintenance operations.Originality/valueThis study uniquely integrates 3D Geographic Information Systems, temporal analytics, and rule-based logic into a unified scheduling framework. It moves beyond conventional systems by enabling dynamic prioritisation, proactive planning, and sustainability-focused maintenance. The model serves as a foundation for further integration with Internet of Things monitoring and smart city systems.
Current asset management approaches struggle to represent asset information involving multidimensional dependencies namely spatial, temporal, and semantic, where it is often stored in isolation rather than interconnected elements. These dependencies are crucial in knowledge modelling which appear as challenges in the current state of research due to inflexible database structures struggling to adapt to dynamic asset lifecycles, limiting comprehensive understanding and strategic decision-making. To address these challenges, this research proposes an innovative asset lifecycle event model using Labelled Property Graph (LPG) to integrate spatial, temporal, and semantic dependencies. The study develops a graph database approach enabling comprehensive asset lifecycle representation. The model was evaluated through lifecycle event queries across similar and diverse assets, examining temporal sequence retrieval and multidimensional asset dependencies analysis. Key findings demonstrate the framework's ability to capture complex asset dependencies, support lifecycle visualisation and facilitate efficient data retrieval. Performance evaluation comparing Neo4j and PostgreSQL revealed the graph database approach outperformed traditional relational databases by 1.2 to 80 times across various query types. This research contributes to a novel conceptualization of integrating spatial, temporal, and semantic dependencies within a unified graph data structure in a graph database for asset management. In pursuit of comprehensive asset management for systematic decision-making, this approach introduces a novel data modeling method capable of storing multidimensional information interconnected with asset entities through graph database technology that advances the knowledge modelling within asset information by transforming the stored multidimensional data into comprehensive insights.
Effective management of infrastructure assets during the operation and maintenance (O&M) phase increasingly demands the integration of spatial and temporal data to enable data-driven decision-making. Yet, the current approach has managed these bidimensional data in isolation, creating data silos that hinder the ability to uncover patterns essential for proactive maintenance. Spatial data in this context are 3D city models that capture infrastructure assets as city objects, while temporal data are records of timestamped events throughout an asset’s lifecycle. Efficient graph modeling of these infrastructure assets and their historical events is capable of allowing graph-based analytics that look into event trends for a proactive maintenance approach. Therefore, this paper presents an approach that enriches the semantic information of infrastructure assets represented in 3D city models with temporal O&M data through a graph modeling approach. This resulting graph network of assets and O&M events has allowed graph analytics through an external network analysis package. We have introduced and compared centrality analysis based on the full graph and subgraph for a targeted analysis of critical assets. The findings demonstrate that while subgraph-based analyses introduce additional computational overhead, they produce more direct event-centric insights compared to analyses conducted on full graphs. The proposed spatio-temporal modeling framework unifies essential spatial and temporal dimensions, addressing the limitations of conventional asset management approaches that treat these data independently. 3D asset management is further enhanced through graph-based modeling to support proactive maintenance strategies that account for the dynamic interactions between spatial context and historical asset information. This work demonstrates the practical value of spatio-temporal graph modeling for enabling meaningful network analysis to support a proactive maintenance strategy.
Graph database technologies have emerged as powerful platforms for managing spatio-temporal data, yet systematic understanding of their analytical capabilities remains limited. This review analyzes publications from 2019 to 2024 to examine how graph data structure enables spatio-temporal analytics. The study identifies five major analytical categories namely predictive, diagnostic, descriptive, prescriptive and exploratory spanning fourteen domains including transportation, maritime and oceanographic systems, energy, built environment, and healthcare and many others. While earlier works primarily focused on technical infrastructure such as graph database performance with spatio-temporal data and non-spatio-temporal graph data structure, systematic evaluation of their analytical applications has been lacking. Addressing this gap, this review synthesizes how graph data structure design and algorithm selection determine the range of spatio-temporal analyses possible across domains. Findings show that the urban disaster management domain demonstrates complete analytical coverage across all categories through event-evolutionary graphs, whereas temporal sequencing graphs exhibit strong transferability across domains. Overall, results highlight that the analytical value of graph databases for spatio-temporal data arises from the synergy between graph data structure design and domain requirements. These insights provide guidance for researchers and practitioners in selecting appropriate analytical approaches and identifying priorities for advancing spatio-temporal graph analytics.
As urban planning grows more complex, effective and structured spatial data representations are increasingly required, particularly for 3D city modelling. Point clouds serve as a primary data source, but their unstructured and dense nature makes direct integration into lightweight formats like CityJSON challenging. This study presents a point cloud to wireframe pipeline that generates line-based representations suitable for conversion into CityJSON solids. Implemented in Python, the workflow integrates downsampling, noise removal, normal estimation, plane detection, clustering, boundary extraction, and sharp edge detection, offering alternative algorithms at each stage. Four geometric primitives, a cuboid, pyramid, sphere, and torus were captured with EyesCloud3D and processed into wireframe models. These models were evaluated quantitatively using volume-based root mean square error (RMSE) relative to reference volumes, and qualitatively for completeness, edge smoothness, and CityJSON suitability. Unlike existing methods that typically evaluate only a single algorithm per stage, this work systematically compares four algorithms per stage across four geometric primitives, totaling 1,024 algorithmic combinations, identifies optimal thresholds through sensitivity analysis, and generates CityJSON-compliant wireframes. For the cuboid and pyramid, the best configurations achieved RMSE values of 279.49 cm³ and 69.34 cm³, indicating accurate reproduction of flat-faced geometries, with visual inspection confirming complete and accurate wireframes. For the sphere and torus, RMSE values were 55.31 cm³ and 53.93 cm³; however, visual inspection revealed incomplete and noisy wireframes. This demonstrates that while RMSE is a reliable quantitative metric for sharp-edged objects, it does not alone guarantee geometric fidelity for curved surfaces. Therefore, a combined quantitative-qualitative evaluation is necessary. For sharp-edged objects, successful edge detection was achieved as confirmed by visual inspection. Across all models, the resulting wireframes were significantly smaller than the original point clouds, supporting efficient storage and visualization. The results suggest that the proposed pipeline is effective for sharp-edged geometries in 3D city models, while smooth objects require alternative feature extraction strategies and more specialized handling in future work.
Multimodal data and machine learning techniques have emerged as a transformative approach in 3D geospatial modelling, offering enhanced precision and comprehensive spatial understanding. However, existing studies focus on single data sources or conventional machine learning techniques without systematically evaluating how multimodal integration enhances 3D geospatial modelling. This systematic literature review assesses the integration of multimodal data with machine learning techniques in 3D geospatial modelling. Using the PRISMA framework, literature published up to January 2025 from Scopus and Web of Science databases was reviewed, resulting in 26 peer-reviewed articles. The review highlighted key data modalities, including point clouds, remote sensing imagery, imaging data, GIS data layers, and non-spatial data. Further, various machine learning methods were assessed, including traditional approaches, deep learning techniques, and hybrid fusion models. This study was analysed by synthesising insights on data fusion techniques, evaluating their strengths, weaknesses, and applicability across diverse geospatial contexts. Major challenges identified include data heterogeneity, computational demands, and limited model generalisability. This review provides future research directions, emphasising opportunities for methodological advancement, enhanced interoperability, and scalable artificial intelligence frameworks suitable for diverse applications, such as urban development, environmental monitoring, precision agriculture, and disaster management.
As urban planning grows more complex, effective and structured spatial data representations are increasingly required, particularly for 3D city modelling. Point clouds serve as a primary data source, but their unstructured and dense nature makes direct integration into lightweight formats like CityJSON challenging. This study presents a point cloud to wireframe pipeline that generates line-based representations suitable for conversion into CityJSON solids. Implemented in Python, the workflow integrates downsampling, noise removal, normal estimation, plane detection, clustering, boundary extraction, and sharp edge detection, offering alternative algorithms at each stage. Four geometric primitives, a cuboid, pyramid, sphere, and torus were captured with EyesCloud3D and processed into wireframe models. These models were evaluated quantitatively using volume-based root mean square error (RMSE) relative to reference volumes, and qualitatively for completeness, edge smoothness, and CityJSON suitability. Unlike existing methods that typically evaluate only a single algorithm per stage, this work systematically compares four algorithms per stage across four geometric primitives, totaling 1,024 algorithmic combinations, identifies optimal thresholds through sensitivity analysis, and generates CityJSON-compliant wireframes. For the cuboid and pyramid, the best configurations achieved RMSE values of 279.49 cm3 and 69.34 cm3, indicating accurate reproduction of flat-faced geometries, with visual inspection confirming complete and accurate wireframes. For the sphere and torus, RMSE values were 55.31 cm3 and 53.93 cm3; however, visual inspection revealed incomplete and noisy wireframes. This demonstrates that while RMSE is a reliable quantitative metric for sharp-edged objects, it does not alone guarantee geometric fidelity for curved surfaces. Therefore, a combined quantitative-qualitative evaluation is necessary. For sharp-edged objects, successful edge detection was achieved as confirmed by visual inspection. Across all models, the resulting wireframes were significantly smaller than the original point clouds, supporting efficient storage and visualization. The results suggest that the proposed pipeline is effective for sharp-edged geometries in 3D city models, while smooth objects require alternative feature extraction strategies and more specialized handling in future work.
 Suhaibah Azri合作论文数106
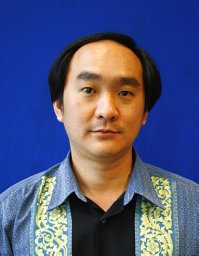 Tan Liat Choon合作论文数43
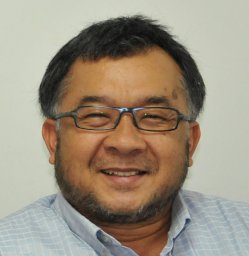 Alias Abdul Rahman合作论文数Dept . of Geoinformatics;Faculty of Geoinformation Science & Engineering;Universiti Teknologi Malaysia;Faculty of Geoinformation Science & Engineering, Universiti Teknologi Malaysia33Francois Anton合作论文数Department of Informatics and Mathematical Modeling;Technical University of Denmark17
 Darka Mioc合作论文数the Department of Geodesy and Geomatics, University of New Brunswick14
 Izham Mohamad Yusoff合作论文数Faculty of Geoinformation Science and Engineering, University Technology Malaysia (UTM)13Syahiirah Salleh合作论文数12
 Thoo Ai Chin合作论文数University of Technology Malaysia10
 Nevil Wickramathilaka合作论文数9Nurfairunnajiha Ridzuan合作论文数7
 Zulkepli Majid合作论文数Department of Geomatic Engineering;Faculty of Geoinformation Science and Engineering;Universiti Teknologi Malaysia;Faculty of Geoinformation Science and Engineering, Universiti Teknologi Malaysia7
 Tan Wee Vern合作论文数6
 Toh Ming Liang合作论文数6S. Mohd Salleh合作论文数5
 Amalin A ishah Mohd Nasir合作论文数5
 Qasim Hamakhurshid Hamamurad合作论文数5
 Dr Normal Mat Jusoh合作论文数5N. Ridzuan合作论文数4azman ariffin合作论文数4Siti Nurbaidzuri Reli合作论文数4
 Habibah Lateh合作论文数Habibah Lateh, Universiti Sains Malaysia4M. G. Cuétara合作论文数3khairul hafiz sharkawi合作论文数3Looi Kam Seng合作论文数3S. Salleh合作论文数3Shanmugapathy A. L. Kathitasapathy合作论文数3Syed Ahmad Fadhli Syed Abdul Rahman合作论文数3
 wan shafrina wan mohd jaafar合作论文数3
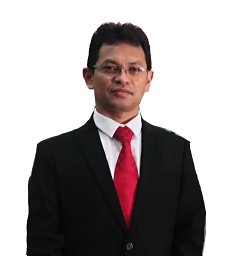 Khairul Nizam Abdul Maulud合作论文数Faculty of Engineering and Built Environment, Universiti Kebangsaan Malaysia3
 Ghazali Desa合作论文数2Zulaikha Hana Mohd合作论文数2Nur Amalina Zulkifli合作论文数2
 Zakri Tarmidi合作论文数University of Technology Malaysia2
 Nabil A. Ibrahim合作论文数Department of Pre-Treatment and Finishing of Cellulosic Fibres, Textile Research Division, National Research Centre2
 Ayob Katimon合作论文数Department of Hydraulics and Hydrology;Faculty of Civil Engineering;Universiti Teknologi Malaysia;Faculty of Civil Engineering, Universiti Teknologi Malaysia2Abdul Aziz Ab Rahman合作论文数1
 Kam Seng Looi合作论文数1Chan Keat Lim合作论文数1Haziq Kamal Mukhelas合作论文数1t a malik合作论文数1
 Norizan Mohamed Nawawi合作论文数1
 Wan Ruslan Ismail合作论文数1Goh Leong Sen合作论文数1G. De Miguel Retortillo合作论文数1M. González Cuétara合作论文数1Sarah Shaharuddin合作论文数1
 Sharifah Nurul Ain Syed Mustorpha合作论文数1
 Nafi Ahmad合作论文数Sch Elect Engn & Comp Sci, Queen Mary Univ London1
 Ahmad Nabil Md Nasir合作论文数Dept Tech & Engn Educ, Univ Teknol Malaysia1




