Introduction
We study the diffusion phenomenon of the formation of “following” links. We first conduct an analysis on the diffusion effect in 24 triadic structures and find evident patterns that facilitate the effect. We then propose a diffusion model to describe the diffusion process of the links, and learn the diffusion strength in different triadic structures by maximizing an objective function based on the model. We evaluate the learned diffusion strength through the task of link prediction.
Dataset
The dataset is crawled in the following way. To begin with the collection process, we selected the most popular user in Twitter, i.e., “Lady Gaga”, and randomly collected 10,000 of her followers. We took these users as seed users and collected all followers of these users by traversing “following” links, which produced in total 13,442,659 users and 56,893,234 links. We then monitored the change of the network structure from 10/12/2010 to 12/23/2010. From the crawled data, we extract a complete subnetwork, in which the links between all users are recorded. The complete subnetwork consists of 112,044 users and 443,399 links between them, in which there are 25,530 dynamic links from 10/12/2010 to 12/23/2010.
Data format:
First column: id of user1
Second column: id of user2
Third column: the timestamp when user1 follows user2
Samples:
0 11 1
0 4893 2
Please download the dynamic graph data from [here]
We have another sina weibo dynamic graph data, which can also be used to conduct this analysis.
Observations
We categorize the diffusion in a triadic structure into two main categories:
Follower diffusion: If a link of A following C is formed at time t', and this link triggers the formation of B following C at time t with t' <= t <= t' +d, where B is A ’s follower or followee by time t'-1 , we say that there exists an influence of the formation of eAC on the formation of eBC . Since this influence generates further followers of C from a new user, we call it follower diffusion.
Followee diffusion: If a link of B following A is formed at time t' , and this link triggers the formation of B following C at time t with t' <= t <= t'+d, where C is A ’s followee or follower (by time t'-1), we say that there exists an influence of the formation of eBA on the formation of eBC . Since this influence generates further followees of B from a new user, we call it followee diffusion.
The following figure shows the two categories of link diffusion.
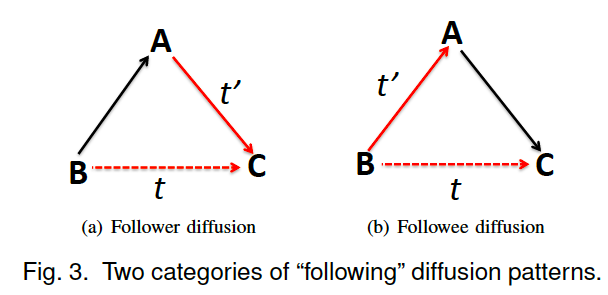
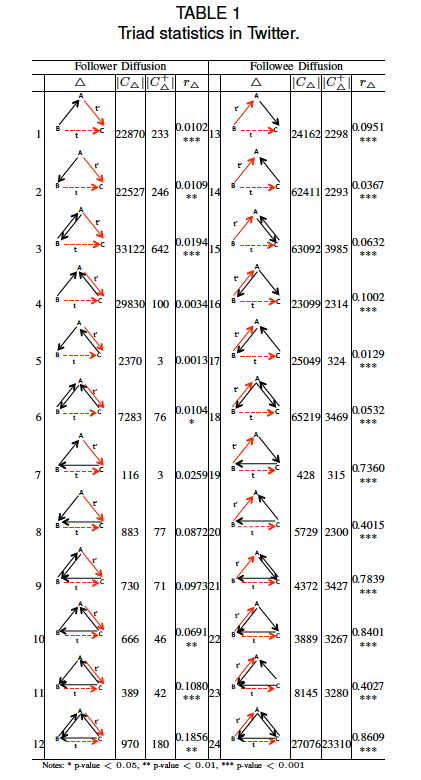
For both follower and followee diffusion, we define 12 respective categories of different triad structures. Table 1 lists the 24 triads and their statistics in the above Twitter network. Triads 1 to 12 represent follower diffusion and triads 13 to 24 represent followee diffusion. Each triad structure contains links with different directions and timestamps: (a) the black edge without timestamp represents a preexisting link; (b) the solid red edge with timestamp t' represents a link added at time t', and is the cause of the link diffusion under investigation; and (c) the dashed red edge with timestamp t represents the effect of the diffusion to be observed, and it may or may not be presented in an actual triad. The timestamps satisfy 0 <= t-t' <= d (d is set as 7 days according to our observations).
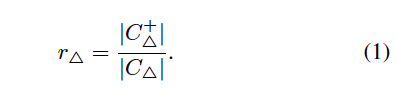
In Table 1, notation C_{\triangle} denotes the actual triadic instances with triadic structure 4 , where C_{\triangle}^+ are the instances with B following C within [t', t'+d]. |C_{\triangle}| is the number of triadic instances with regard to a \triangle. Notation r_{\triangle} represents the rate of B following C in s specific triad, which is calculated as:
Obervation summary:
1) The formation of two links in some triads is temporally dependent.
We conduct a randomization test to demonstrate the significance of the triadic patterns in Table 1. Randomization test is a model-free, computationally intensive statistical technique for hypothesis testing. The key idea is to define a null hypothesis and a test statistic. The main steps include: firstly, compute some test statistic using the set of original observations; secondly, carry out the random shuffle according to the null hypothesis a large number of times, and compute the test statistic for each random data; finally, by the law of large numbers, the permutation p-value is approximated by the proportion of randomly generated values that exceed or equal the observed value of the test statistic. If p-value is no larger than 0.05, the null hypothesis is rejected. In our setting, the null hypothesis is defined as: the formation of neighboring links is temporally independent of one another. Under this null hypothesis, we randomly shuffle the formation times of all the newly formed links, and use the test statistic as the rate defined in Eq. (1). For each triadic structure, we set the time delay as 7 days and conduct random shuffle 10000 times.
The p-values are shown in Table1. In followee diffusion category, the calculated p-values are all 0, which indicate that the followee diffusion patterns are significant. In follower diffusion category, the calculated p-values for triads 4, 5, 7, 8, 9 are larger than 0.05, which denote these patterns are insignificant. In triads 7, 8, 9, the most probable reason of B “following” C is C “following” B before and B “following” back, rather than the influence from A “following” C . However, triads 9, 10, 11, 12 are more significant because there are more two-way links in a triadic closure, which can strengthen the diffusion effect from eAC. In triads 4, 5, 6, the most probable reason why A follows C is “following” back, and thus C is more likely to be an ordinary user. Therefore, the diffusion effect of allowing C to be followed by others is relatively week. However, triad 6 is more significant because it has more two-way links. In triads 1, 2, 3, the link eAC is formed most probably due to the following” behavior from ordinary user to celebrity user. Thus the diffusion effect in triads 1,2,3 are much stronger. Henceforth, we ignore triads 4, 5, 7, 8, 9 in the following analysis and experiments.
2) Diffusion effect between two links decays over time.
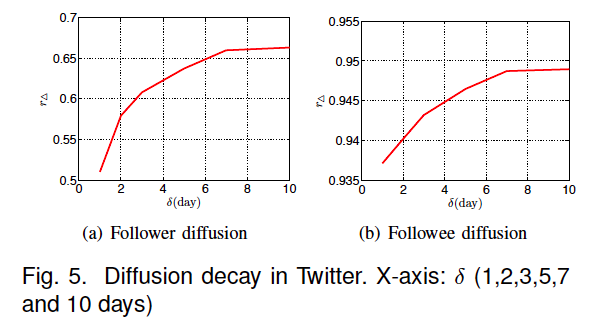
To observe the effect of link diffusion over time, we vary the value of as 1, 2, 3, 5, 7 and 10 days. For each value of , we average the observed r_{\triangle} in follower diffusion category and followee diffusion category respectively, and show the results in Figure 5. From the results, we can see that the increasing rate of r_{\triangle} becomes slower over time. When d is larger than 7 days, r_{\triangle} almost stops increasing, which implies that the diffusion effect persists for about 7 days. We also notice that compared with follower diffusion, the rate r_{\triangle} in followee diffusion is high in the first day and later it increases very slowly. This is because, in follower diffusion (Figure 3(a)), there should be some mechanism for B to discover A following C, such as via browsing A’s retweets of C’s messages. While in followee diffusion (Figure 3(b)), although B may discover A following C according to the system recommendation after a period of time, B can also discover C immediately after following A via browsing A’s retweets of C’s messages. Thus, the formation of B following C in followee diffusion is easier than that in follower diffusion. For simplicity, we uniformly choose as 7 days in the later analysis and experiments.
3) A two-way relationship between two users can trigger more links (+1%) than a one-way relationship.
In the category of follower diffusion, we discover that the diffusion strength is more significant when there is a two-way relationship between A and B . We divide triads in this category into four groups (triads 1-3, triads 10-12). In each group, the first triad only has a oneway relationship eBA, the second triad only has a one-way relationship eAB, and the third triad has both eAB and eBA. The statistics in Table 1 show that the triads with a two-way relationship between A and B exert a stronger effect on the formation of B following C than those with only a oneway relationship between A and B (about +1%). This can be explained by the intuition that two-way relationships are much more likely to be actual “social” relationships, rather than “celebrity following”, and thus can better facilitate the diffusion of “following” links.
4) A relationship directed from A to C improves the diffusion likelihood from A following C to B following C (+3-40%).
In the category of followee diffusion, we discover that the diffusion effect is more significant when there exists a one-way relationship from A to C . We also divide the triads in this category into four groups (triads 13-15, triads 16-18, triads 19-21, triads 22-24) similar to the division for follower diffusion category. We see that for all the groups, the triads with a one-way relationship from A to C exert a stronger effect on the formation of B following C than those with only a one-way relationship from C to A (+3-40%). This can be explained as a user discovery process: when a link of B following A is formed, this may trigger B to discover A’s followee C through immediately browsing A’s retweets of C’s messages, and A’s interest in C may indicate that B would be also interested in C .
Model
Diffuion model: The diffusion process of the FCM model unfolds in discrete steps according to the following stochastic rule. When a link e' is added at time t' , at each time slot from time t' to t'+d , the follower end point of e may discover the link e' with discovery probability ge'e , and once discovered, there is one chance at that time that e' influences the formation of e with the diffusion probability he'e. If failed, e' will have no chance to activate e again. In other words, the time delay r for discovery follows a geometric distribution with parameter ge'e and after discovery there is one chance at time t'+ r that e' could activate e. When multiple links activate e, e is activated at the time of the first successful attempt.
Parameter learning: Based on the FCM model, we define a likelihood function to describe the generative probability of all the links in the network. The objective is to estimate the parameters = {he'e, ge'e} through maximizing the likelihood function. The difference between our likelihood function and previous IC model-based likelihood function is that, the influence diffuses from one link to another link instead of the diffusion between nodes in the network. We incorporate the triadic structures between links into the likelihood function and estimate the diffusion strength associated with different triadic structures, which is different from estimating the diffusion strength between two nodes. we formalize the formation of each newly added link. For each newly added link, we also formalize its effect on its unformed neighboring links. The likelihood function is defined as follows:
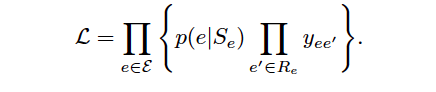
 is the set of links with observed formation times, Se is the neighboring links of e added within [te-d,te], and Re is the neighboring links of e not added before te+d.
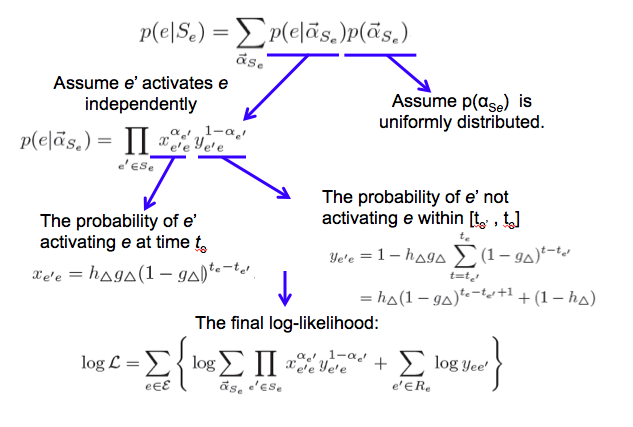
We then use EM algorihtm to learn the parameters. Specifically, we associate each link pair (e,e’) to a triad structure and aggregate different pairs with the same structure together. We then estimate the influence probabilities associated to 24 triads instead of link pairs.
Experimental Results
We evaluate the learned diffusion strength in different triads through the task of link prediction. Specically, For each dataset, we construct positive and negative instances from it. The links to be probabilistically generated are the dashed red edges with timestamp t in Table 1. These links may or may not be presented in actual triads. Links presented on the actual dataset are labeled as positive instances, while the others are treated as negative instances. Each positive or negative instance is associated with a list of features based on the empirical counts of the 24 triadic structures in Table 1. we divide the constructed positive and negative instances from the dataset into training and test set. We learn the discovery and diffusin probabilities by our model on the training data, and predict which links will be formed based on the learned parameters. We compare with classification and ranking based baselines and show the prediction results in Table 3 and Table 4.
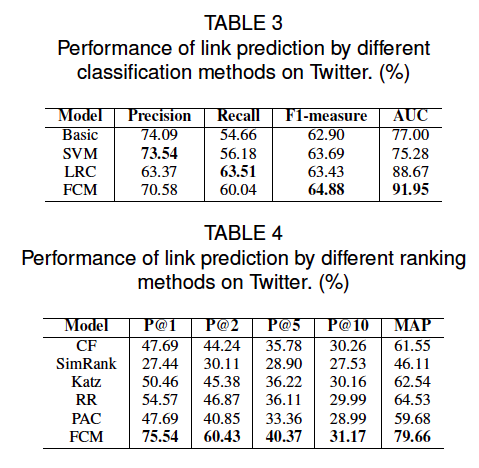
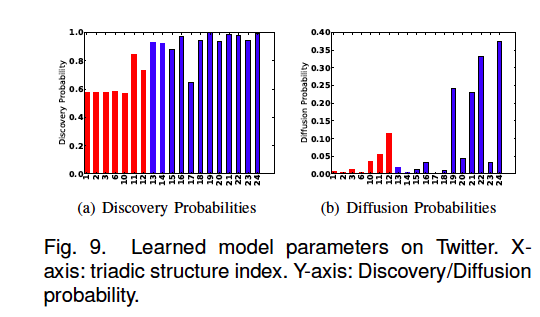
We report the learned discovery and diffusion probabilities in Figure 9, where the red bars represent the parameters learned for follower diffusion patterns, and the blue bars represent those learned for followee diffusion patterns. We can see from Figure 9(a) that the discovery probabilities learned for followee diffusion patterns are generally higher than follower diffusion patterns, which indicate that the discoveries in followee diffusion are easier than those in follower diffusion. Figure 9(b) also shows the learned diffusion probabilities are consistent with the rates in Table 1, which suggests that the diffusion effects in followee diffusion are stronger than those in follower diffusion.
Codes
Please download the codes used in the paper from [here] to reproduce the results in Table 3 and Table 4Note: please run the code under windows OS.
How to run?
1) Exectue run_setup_data.bat to copy the dataset into all the folders of Table 3 and Table 4.
2) In each sub folder under the folders of Table 3 and Table 4, first execute run_gen.bat to generate positive and negative instances, and then execute the .bat file under the sub folder to reproduce our experimental results.
Reference
Jing Zhang, Zhanpeng Fang, Wei Chen, and Jie Tang. Diffusion of “Following” Links in Microblogging Networks. IEEE Transaction on Knowledge and Data Engineering (TKDE). TKDE, 2015. 27(8):2093-2106.