Identification of super-enhancer-associated genes in DMF-treated ACHN cells, related to Figure 6.
Characteristics of patients whose tumors were used for PDOs or PDXs experiments, Related to Figure 4&7.
Supplementary Figure 5. CHD6/SMARCA2/4-coordinated SEs-promoter looping boosts the transcription of NF-κB-related targets, related to Figure 6. A. 3C assay of the indicated genes in WT, CHD6-KO Caki-2 cells with or without DMF stimulation. “Pro” means the input-pro, while “3C” means the 3C primers targeting the indicated enhancer region. B. ChIP-qPCR of H3K27ac markers in promoters or enhancers of CCL2, ICAM1, or BCL3 gene in UOK-262 cells (n = 5). C. Immunoblotting analysis of p65 immunoprecipitates in UOK-262 cells with or without CHD6 depletion. D. ChIP-qPCR of SMARCA2/4 markers in the SEs of CCL2, ICAM1, or BCL3 gene (n = 5) in CHD6-KO UOK-262 cells with or without CHD6 restoration. E. RT-qPCR analysis of mRNA level for CCL2, ICAM1 and BCL3 genes (n = 5) in UOK-262 cells transfected with indicated siRNAs targeting cBAF, PBAF, or ncBAF. F. ChIP-qPCR of H3K27ac markers in indicated SEs of CCL2, ICAM1, or BCL3 gene (n = 5) in SMARCA2/4-KD UOK-262 cells with or without CHD6 overexpression. G. MA plot of differential H3K4me1 or H3K27ac ChIP-seq signals in UOK-262 cells treated with 12 h AU-15330 versus DMSO. Log2 fold changes of peaks are plotted on the y-axis. Significantly changed peaks (FDR< 0.05) are marked in grey. H. Gene set enrichment analysis (GSEA) revealed the inhibition of CHD6-signature by AU-15330. I. Plot of CHD6/p65 co-binding intensities in UOK-262 treated with control and AU-15330 (5 μM), respectively. P values were calculated using a two-tailed Student’s t-test (B, D-F). *p < 0.05, **p < 0.01, and ***p < 0.001. ns, no significance.
JMJD6/ATF4-sustained enhancer-promoter looping drives the transcription of glutathione biosynthesis pathway.
Summary of the epigenetic regulators showing the decreased sgRNA abundance in UOK-262 and ACHN cells, respectively.
Supplementary Figure 4. CHD6 activates NF-κB signaling to potentiate FH-deficient RCC malignancy, related to Figure 5. A. Volcano plot showing differentially expressed genes in UOK-262 cells upon CHD6 knockdown. B. Unsupervised cluster analysis of differentially expressed genes in control and CHD6 knockdown UOK-262 cells. C. ATAC-seq signals showing the profiles of OCRs across the indicated peaks in UOK262 cells with versus without CHD6 knockdown. D. Heatmap exhibiting the significance of transcription factor motifs enriched in accessible loci derived from control and CHD6-KD UOK262 cells. NF-κB motif is dominantly highlighted. E. Venn diagram showing overlapping hits, defined as CHD6-signature, with CHD6 ChIP-seq peaks and changes in OCRs (ATAC-seq) and differentially expressed genes (RNA-seq). F. Western blotting assays and Co-IP analysis showing the altered CHD6-p65 interactions in UOK-262 cells with or without FH restoration. G-H. MTT (G), colony formation (H-left) assays were performed in control and p65-KD UOK-262 cells. Colony formation assays performed in p65-depleted UOK-262 cells with or without CHD6 overexpression (H-right). I. Quantification of colony formation numbers in indicated groups from (H). J. Effects of JSH-23 treatment (1 mg/kg) on UOK262-derived xenografts, as indicated (n = 6 per group, 2-way ANOVA followed by Tukey’s multiple comparisons test). Treatment started when tumors reached 50–100 mm3. K. ChIP-qPCR analysis of CHD6, Pol II-S5P and S2P in the promoter regions of the indicated genes in WT and CHD6-KO UOK-262 cells with restoration of WT CHD6. P values were calculated using 2-tailed Student’s t-test (H, K). *p < 0.05, **p < 0.01, and ***p < 0.001. ns, no significance.
Supplementary Figure 1. Library and cells used for in vivo epigenetic CRISPR screen, related to Figure 1. A. Schematic diagram of FH mutations and related distributions in the indicated protein domains. B. Intracellular fumarate levels were measured in a panel of indicated RCC cell lines. C. Lorenz curve showing the distribution of sgRNAs in the epigenetic-focused library. D. Workflow showing the generation of the UOK- or ACHN-clones without Cas9 for evaluating the distribution of guides that persist upon tumour formation from the tumour initiating cells (TICs), and the UOK- or ACHN-clones with Cas9 were used for further in vivo screens. E. Western blot showing superior Cas9 expressions in UOK-Cas9-Clone 5 and ACHN-Clone 4. F. Cell viability of UOK-Cas9-Clone 5 and ACHN-Cas9-Clone 4 transfected with sgRNAs targeting the essential gene CCND1. G. Representative tumor graph and growth curve of sgRNA library transduced UOK-Cas9-Clone 5 & ACHN-Cas9-Clone 4 subcutaneously injected into BABL/c nude mice. H. Percentage of maintained sgRNAs in mice injected with UOK-Clone 5 library (without Cas9) and ACHN-clone 4 library (without Cas9) cells. I. Volcano plot revealing the targets with altered sgRNA frequencies with a cutoff of p < 0.01 and log2 fold change (log2FC) > 2. J. MTT analysis showing the effects of siRNA KD of 9 CHD family genes on FH-deficient cells, respectively. The quantitative results shown are representative of 5 experiments. P values were calculated using a two-tailed unpaired t-test (F, J). *p < 0.05, **p < 0.01, and ***p < 0.001.
Supplementary Figure 2. FH deficiency accumulates CHD6 via inactivating Keap1, related to Figure 2&3. A. WB and co-IP analysis indicating no interactions between VHL and CHD6 proteins in WCLs of ACHN cells. B. WB analysis (left) and RT-qPCR (right) indicated the CHD6 protein or mRNA levels in control and VHL-depleted RCC cells. C. Schematic illustration of Keap1 deletion mutants. The binding capacity of Keap1 to CHD6 is indicated with the symbol. D. Western blots showing in vitro ubiquitination assays conducted by incubating the reconstituted Keap1–CUL3–RBX1 E3 ubiquitin ligase complex with E1 and E2 enzymes, ubiquitin and GST-CHD6 at 30 °C for 2 h. E. Aligning ETGE motif sequence in CHD6 and other known Keap1 substrates. F. Western blots of WCLs and co-IP samples of anti-FLAG antibody from ACHN cells transfected with the indicated plasmids and treated with 20 µM MG132 for 8 h. G. Western blots of WCLs from ACHN cells transfected with the indicated plasmids. H. Cells infected with indicated plasmids for 48 h and then treated with 50 μg/mL cycloheximide (CHX) and harvested at different time points. Quantified data were shown. I. Western blot showing the products of in vivo ubiquitination assays from ACHN cells infected with lentivirus expressing FH-specific shRNA or control for 48 h. RT-qPCR analysis (right) showing the Keap1 mRNA levels in indicated samples. J. Western blot showing the products of in vivo ubiquitination assays from UOK-262 cells with or without FH overexpression. RT-qPCR analysis (right) indicating the Keap1 mRNA levels. K. Chemical reaction process showing the generation of D2-DMF. DMAD, dimethyl acetylenedicarboxylate; PPh3, triphenylphosphine; D2O, heavy water (2H2O); THF, tetrahydrofuran. L. FH-WT cells were treated with increased DMF, and fumarate levels were detected. M. WB analysis showing Keap1 expressions in cells treated with or without DMF. N. Decreased fumarate levels were detected in control and FH-overexpressing UOK-262, Caki-2 (D238 H), and Caki-2 (E378K) cells. C1 and C2 indicate the different clones. O. Western blotting assays and Co-IP analysis showing the Keap1-CHD6 interactions in UOK-262 cells. P values were calculated using a two-tailed unpaired t-test (B, I, J, L, N). *p < 0.05, **p < 0.01, and ***p < 0.001. ns, no significance.
Supplementary Figure 3. CHD6 is essential for FH-deficient RCC cells, related to Figure 4. A-B. MTT analysis of FH-WT PRCC (A) or canonical ccRCC (B) cells with or without CHD6-KD. C. Competition-based assay to measure the effect of CHD4 shRNA on the growth of UOK-262 cells (n = 3 per time point). CHD4-KD cells were identified by coexpression of green fluorescent protein (GFP) (LMN vector). The percentage of GFP+ cells was thus tracked over 12 days and normalized to GFP percentage on day 2. D. Quantified BIL signals of orthotopic (FH-intact Caki-2) renal tumors with or without CHD6 ablation. E. Serum VEGF concentrations in treated BALC/c nude mice from indicated groups were compared. F. Ki-67 (IHC) and TUNEL (IF) staining from xenografts derived from FH-KD and FH/CHD6-KD Caki-2 cells, and the quantitative results are shown in the right panel. Scale bar, 20 μm. G. Kaplan-Meier survival curve analysis of mice from Figure 4F. H. Schematic graph showing the zebrafish tumour xenograft model construction at each time point. I. Quantified tumour sizes derived from indicated cells implanted in the zebrafish embryos. J. Quantitation of organoid sizes from human FH-WT or FM-RCC samples with or without CHD6 depletion. P values were calculated using 2-way ANOVA followed by Tukey’s multiple comparisons tests (A, B), 2-tailed Student’s t-test (C-F, I-J), and log-rank test (G). *p < 0.05, **p < 0.01, and ***p < 0.001. ns, no significance.
Supplementary Figure 6. In vitro and in vivo assessment of AU-15330 efficacy against FH-deficient RCC in multiple preclinical models, related to Figure 7. A. Dose-response curves and IC50 of FH-intact or FH-deficient cells treated with AU-15330. B. Dose-response curves of UOK-262 cells treated with AU-15330, AU-15139, or AU-16235. C-D. Mouse weight changes measurements (C) (n = 5) and complete blood counts (D) performed on vehicle control and AU-15330 treated mice as in Fig. 7A. E. Representative HE graphs showing the morphology of critical organs in mice treated with an increased amount of AU-15330. F. Representative graphs showing AU-15330 efficacy against FH-mutated RCC organoids with CHD6 depletion. Scale bar: 200 μm. G. Changes in tumour volumes of the subcutaneous PDX models receiving daily i.v. with vehicle or AU-15330 for 8 weeks (n = 8 mice per group). H. BIL signals (left) and quantification (right) of lung metastatic nodes in mice derived from indicated groups. P values were calculated using the two-tailed Student’s t-test (D), 2-way ANOVA followed by Tukey’s multiple comparisons test (F, H). *p < 0.05, **p < 0.01, and ***p < 0.001. ns, no significance.
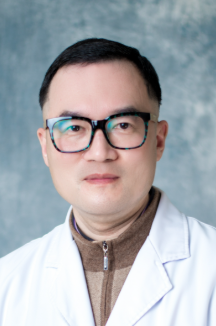 Yu Zhu (祝宇)合作论文数Ruijin Hospital, Shanghai Jiao Tong University School of Medicine51
 Zhoujun Shen (沈周俊)合作论文数Ruijin Hospital, Shanghai Jiao Tong University School of Medicine40
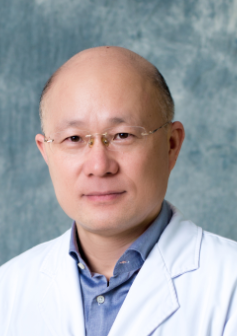 Danfeng Xu (徐丹枫)合作论文数Ruijin Hospital, Shanghai Jiao Tong University School of Medicine28
 Fukang Sun (孙福康)合作论文数Ruijin Hospital, Shanghai Jiao Tong University School of Medicine28
 JuPing Zhao (赵菊平)合作论文数27Jun Dai (戴军)合作论文数26Xiaojing Wang (王笑菁)合作论文数School of Humanities, Shanghai Jiao Tong University23Chuanjie Zhang合作论文数Shanghai Jiao Tong Univ, Ruijin Hosp, Dept Urinary Surg, Sch Med, Shanghai, Peoples R China22WenBin Rui (芮文斌)合作论文数22Haofei Wang (王浩飞)合作论文数22Xin Xie (谢欣)合作论文数21WenLong Zhou (周文龙)合作论文数21YuXuan Wu (吴瑜璇)合作论文数20L. X. Chen合作论文数18Juan Jin合作论文数17
 Qiang He (何强)合作论文数The First Affiliated Hospital, College of Medicine, Zhejiang University16
 Yi Gao (高轶)合作论文数上海长征医院泌尿外科14Huang Hai合作论文数14
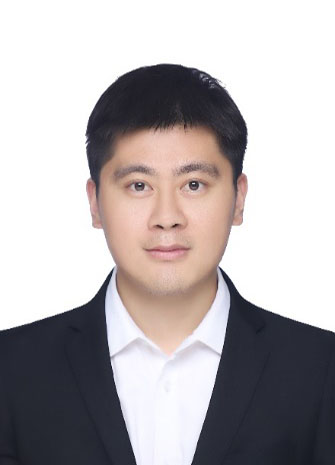 Wenjie Zhou (周文杰)合作论文数School of Medicine Songjiang Institute, Shanghai Jiao Tong University13Xu Yunze合作论文数13Yan Shen (沈艳)合作论文数12Li Qunyi合作论文数12
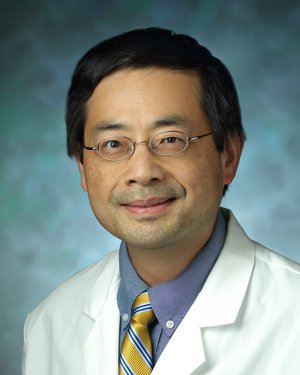 Jun Luo合作论文数Department of Urology, School of Medicine, Johns Hopkins University11
 Lianxin Liu (刘连新)合作论文数School of Clinical Medicine, Division of Life Sciences and Medicine, University of Science and Technology of China;The First Affiliated Hospital of University of Science and Technology of China11ChongYu Zhang (张翀宇)合作论文数10Jia-Yan Sheng合作论文数9DingYi Liu (刘定益)合作论文数9XiaoJing Wang (王晓晶)合作论文数8
 Guang Ning (宁光)合作论文数Ruijin Hospital, Shanghai Jiaotong University School of Medicine8Dengqiang Lin合作论文数7Chenghe Wang合作论文数7Xin Huang (黄欣)合作论文数7Jun Ji (计骏)合作论文数7
 Yuan Shao (邵远)合作论文数School of Medicine, Shanghai Jiao Tong University7Zhu Xiao-Yu合作论文数6Lin Bo合作论文数5Wenfang He合作论文数5Danna Zheng合作论文数5Xiaoqun Yang合作论文数5Xiaoyu Zhu合作论文数5Ao Liu合作论文数Shanghai Jiao Tong Univ, Sch Med, Ruijin Hosp, Dept Urol, Shanghai, Peoples R China5Qi Tang (唐崎)合作论文数5Gui Ma (马贵)合作论文数5YanFeng Zhou (周燕峰)合作论文数5ZhaoPing Xu (徐兆平)合作论文数5Wei He (何威)合作论文数5Sang Hu (胡桑)合作论文数5
 Tianyuan Xu合作论文数5
 Weiqing Wang (王卫庆)合作论文数Ruijin Hospital, School of Medicine, Shanghai Jiaotong University5




