Complex systems often comprise many kinds of components which vary over many orders of magnitude in size: Populations of cities in countries, individual and corporate wealth in economies, species abundance in ecologies, word frequency in natural language, and node degree in complex networks. Here, we introduce ‘allotaxonometry’ along with ‘rank-turbulence divergence’ (RTD), a tunable instrument for comparing any two ranked lists of components. We analytically develop our rank-based divergence in a series of steps, and then establish a rank-based allotaxonograph which pairs a map-like histogram for rank-rank pairs with an ordered list of components according to divergence contribution. We explore the performance of rank-turbulence divergence, which we view as an instrument of ‘type calculus’, for a series of distinct settings including: Language use on Twitter and in books, species abundance, baby name popularity, market capitalization, performance in sports, mortality causes, and job titles. We provide a series of supplementary flipbooks which demonstrate the tunability and storytelling power of rank-based allotaxonometry.
In real time, Twitter strongly imprints world events, popular culture, and the day-to-day, recording an ever-growing compendium of language change. Vitally, and absent from many standard corpora such as books and news archives, Twitter also encodes popularity and spreading through retweets. Here, we describe Storywrangler, an ongoing curation of over 100 billion tweets containing 1 trillion 1-grams from 2008 to 2021. For each day, we break tweets into 1-, 2-, and 3-grams across 100+ languages, generating frequencies for words, hashtags, handles, numerals, symbols, and emojis. We make the dataset available through an interactive time series viewer and as downloadable time series and daily distributions. Although Storywrangler leverages Twitter data, our method of tracking dynamic changes in n-grams can be extended to any temporally evolving corpus. Illustrating the instrument's potential, we present example use cases including social amplification, the sociotechnical dynamics of famous individuals, box office success, and social unrest.
In confronting the global spread of the coronavirus disease COVID-19 pandemic we must have coordinated medical, operational, and political responses. In all efforts, data is crucial. Fundamentally, and in the possible absence of a vaccine for 12 to 18 months, we need universal, well-documented testing for both the presence of the disease as well as confirmed recovery through serological tests for antibodies, and we need to track major socioeconomic indices. But we also need auxiliary data of all kinds, including data related to how populations are talking about the unfolding pandemic through news and stories. To in part help on the social media side, we curate a set of 2000 day-scale time series of 1- and 2-grams across 24 languages on Twitter that are most 'important' for April 2020 with respect to April 2019. We determine importance through our allotaxonometric instrument, rank-turbulence divergence. We make some basic observations about some of the time series, including a comparison to numbers of confirmed deaths due to COVID-19 over time. We broadly observe across all languages a peak for the language-specific word for 'virus' in January 2020 followed by a decline through February and then a surge through March and April. The world's collective attention dropped away while the virus spread out from China. We host the time series on Gitlab, updating them on a daily basis while relevant. Our main intent is for other researchers to use these time series to enhance whatever analyses that may be of use during the pandemic as well as for retrospective investigations.
Measuring the specific kind, temporal ordering, diversity, and turnover rate of stories surrounding any given subject is essential to developing a complete reckoning of that subject’s historical impact. Here, we use Twitter as a distributed news and opinion aggregation source to identify and track the dynamics of the dominant day-scale stories around Donald Trump, the 45th President of the United States. Working with a data set comprising around 20 billion 1-grams, we first compare each day’s 1-gram and 2-gram usage frequencies to those of a year before, to create day- and week-scale timelines for Trump stories for 2016–2021. We measure Trump’s narrative control, the extent to which stories have been about Trump or put forward by Trump. We then quantify story turbulence and collective chronopathy—the rate at which a population’s stories for a subject seem to change over time. We show that 2017 was the most turbulent overall year for Trump. In 2020, story generation slowed dramatically during the first two major waves of the COVID-19 pandemic, with rapid turnover returning first with the Black Lives Matter protests following George Floyd’s murder and then later by events leading up to and following the 2020 US presidential election, including the storming of the US Capitol six days into 2021. Trump story turnover for 2 months during the COVID-19 pandemic was on par with that of 3 days in September 2017. Our methods may be applied to any well-discussed phenomenon, and have potential to enable the computational aspects of journalism, history, and biography.
A common task in computational text analyses is to quantify how two corpora differ according to a measurement like word frequency, sentiment, or information content. However, collapsing the texts’ rich stories into a single number is often conceptually perilous, and it is difficult to confidently interpret interesting or unexpected textual patterns without looming concerns about data artifacts or measurement validity. To better capture fine-grained differences between texts, we introduce generalized word shift graphs, visualizations which yield a meaningful and interpretable summary of how individual words contribute to the variation between two texts for any measure that can be formulated as a weighted average. We show that this framework naturally encompasses many of the most commonly used approaches for comparing texts, including relative frequencies, dictionary scores, and entropy-based measures like the Kullback–Leibler and Jensen–Shannon divergences. Through a diverse set of case studies ranging from presidential speeches to tweets posted in urban green spaces, we demonstrate how generalized word shift graphs can be flexibly applied across domains for diagnostic investigation, hypothesis generation, and substantive interpretation. By providing a detailed lens into textual shifts between corpora, generalized word shift graphs help computational social scientists, digital humanists, and other text analysis practitioners fashion more robust scientific narratives.
Natural hazards are becoming increasingly expensive as climate change and development are exposing communities to greater risks. Preparation and recovery are critical for climate change resilience, and social media are being used more and more to communicate before, during, and after disasters. While there is a growing body of research aimed at understanding how people use social media surrounding disaster events, most existing work has focused on a single disaster case study. In the present study, we analyze five of the costliest disasters in the last decade in the United States (Hurricanes Irene and Sandy, two sets of tornado outbreaks, and flooding in Louisiana) through the lens of Twitter. In particular, we explore the frequency of both generic and specific food-security related terms, and quantify the relationship between network size and Twitter activity during disasters. We find differences in tweet volume for keywords depending on disaster type, with people using Twitter more frequently in preparation for Hurricanes, and for real-time or recovery information for tornado and flooding events. Further, we find that people share a host of general disaster and specific preparation and recovery terms during these events. Finally, we find that among all account types, individuals with "average" sized networks are most likely to share information during these disasters, and in most cases, do so more frequently than normal. This suggests that around disasters, an ideal form of social contagion is being engaged in which average people rather than outsized influentials are key to communication. These results provide important context for the type of disaster information and target audiences that may be most useful for disaster communication during varying extreme events.
When building a global brand of any kind—a political actor, clothing style, or belief system— developing widespread awareness is a primary goal. Short of knowing any of the stories or products of a brand, being talked about in whatever fashion—raw fame—is, as Oscar Wilde would have it, better than not being talked about at all. Here, we measure, examine, and contrast the day-to-day raw fame dynamics on Twitter for US Presidents and major US Presidential candidates from 2008 to 2020: Barack Obama, John McCain, Mitt Romney, Hillary Clinton, Donald Trump, and Joe Biden. We assign “lexical fame” to be the number and (Zipfian) rank of the (lowercased) mentions made for each individual across all languages. We show that all five political figures have at some point reached extraordinary volume levels of what we define to be “lexical ultrafame”: An overall rank of approximately 300 or less which is largely the realm of function words and demarcated by the highly stable rank of ‘god’. By this measure, ‘trump’ has become enduringly ultrafamous, from the 2016 election on. We use typical ranks for country names and function words as standards to improve perception of scale. We quantify relative fame rates and find that in the eight weeks leading up the 2008 and 2012 elections, ‘obama’ held a 1000:757 volume ratio over ‘mccain’ and 1000:892 over ‘romney’, well short of the 1000:544 and 1000:504 volumes favoring ‘trump’ over ‘hillary’ and ‘biden’ in the 8 weeks leading up to the 2016 and 2020 elections. Finally, we track how only one other entity has more sustained ultrafame than ‘trump’ on Twitter: The K-pop (Korean pop) band BTS. We chart the dramatic rise of BTS, finding their Twitter handle ‘@bts twt’ has been able to compete with ‘a’ and ‘the’, reaching a rank of three at the day scale and a rank of one at the quarter-hour scale. Our findings for BTS more generally point to K-pop’s growing economic, social, and political power.
Natural disasters are becoming increasingly expensive as climate change and development are exposing communities to greater risks. Disaster preparation and recovery are critical for climate change resilience, and social media is being used more and more to communicate before, during, and after disasters. While there is a growing body of research aimed at understanding how people use social media surrounding disaster events, most existing work has focused on a single disaster case study. In the present study, we analyze five of the costliest disasters in the last decade in the United States (Hurricanes Irene and Sandy, two sets of tornado outbreaks, and flooding in Louisiana) through the lens of Twitter. In particular, we explore the frequency of both generic and specific food-security related terms, and quantify the relationship between network size and Twitter activity during disasters. We find differences in tweet volume for keywords depending on disaster type, with people using Twitter more frequently in preparation for Hurricanes, and for real-time or recovery information for tornado and flooding events. Further, we find that people share a host of general disaster and specific preparation and recovery terms during these events. Finally, we find that among all account types, individuals with “average” sized networks are most likely to share information during these disasters, and in most cases, do so more frequently than normal. This suggests that around disasters, an ideal form of social contagion is being engaged in which average people rather than outsized influentials are key to communication. These results provide important context for the type of disaster information and target audiences that may be most useful for disaster communication during varying extreme events.
Since the shooting of Black teenager Michael Brown by White police officer Darren Wilson in Ferguson, Missouri, the protest hashtag #BlackLivesMatter has amplified critiques of extrajudicial killings of Black Americans. In response to #BlackLivesMatter, other Twitter users have adopted #AllLivesMatter, a counter-protest hashtag whose content argues that equal attention should be given to all lives regardless of race. Through a multi-level analysis of over 860,000 tweets, we study how these protests and counter-protests diverge by quantifying aspects of their discourse. We find that #AllLivesMatter facilitates opposition between #BlackLivesMatter and hashtags such as #PoliceLivesMatter and #BlueLivesMatter in such a way that historically echoes the tension between Black protesters and law enforcement. In addition, we show that a significant portion of #AllLivesMatter use stems from hijacking by #BlackLivesMatter advocates. Beyond simply injecting #AllLivesMatter with #BlackLivesMatter content, these hijackers use the hashtag to directly confront the counter-protest notion of "All lives matter." Our findings suggest that Black Lives Matter movement was able to grow, exhibit diverse conversations, and avoid derailment on social media by making discussion of counter-protest opinions a central topic of #AllLivesMatter, rather than the movement itself.
The English language has evolved dramatically throughout its lifespan, to the extent that a modern speaker of Old English would be incomprehensible without translation. One concrete indicator of this process is the movement from irregular to regular (-ed) forms for the past tense of verbs. In this study we quantify the extent of verb regularization using two vastly disparate datasets: (1) Six years of published books scanned by Google (2003-2008), and (2) A decade of social media messages posted to Twitter (2008-2017). We find that the extent of verb regularization is greater on Twitter, taken as a whole, than in English Fiction books. Regularization is also greater for tweets geotagged in the United States relative to American English books, but the opposite is true for tweets geotagged in the United Kingdom relative to British English books. We also find interesting regional variations in regularization across counties in the United States. However, once differences in population are accounted for, we do not identify strong correlations with socio-demographic variables such as education or income.
Tweet IDs for all tweets studied in The Lexicocalorimeter: Gauging public health through caloric input and output on social media.Best version of the paper is on the aXiv at https://arxiv.org/abs/1507.05098Paper also published by PLoS ONE.
Given the growing assortment of sentiment measuring instruments, it is imperative to understand which aspects of sentiment dictionaries contribute to both their classification accuracy and their ability to provide richer understanding of texts. Here, we perform detailed, quantitative tests and qualitative assessments of 6 dictionary-based methods applied, and briefly examine a further 20 methods. We show that while inappropriate for sentences, dictionary-based methods are generally robust in their classification accuracy for longer texts. Stories often following distinct emotional trajectories, forming patterns that are meaningful to us. By classifying the emotional arcs for a filtered subset of 4,803 stories from Project Gutenberg's fiction collection, we find a set of six core trajectories which form the building blocks of complex narratives. Of profound scientific interest will be the degree to which we can eventually understand the full landscape of human stories, and data driven approaches will play a crucial role. Finally, we utilize web-scale data from Twitter to study the limits of what social data can tell us about public health, mental illness, discourse around the protest movement of #BlackLivesMatter, discourse around climate change, and hidden networks. We conclude with a review of published works in complex systems that separately analyze charitable donations, the happiness of words in 10 languages, 100 years of daily temperature data across the United States, and Australian Rules Football games.
The emergence and global adoption of social media has rendered possible the real-time estimation of population-scale sentiment, an extraordinary capacity which has profound implications for our understanding of human behavior. Given the growing assortment of sentiment-measuring instruments, it is imperative to understand which aspects of sentiment dictionaries contribute to both their classification accuracy and their ability to provide richer understanding of texts. Here, we perform detailed, quantitative tests and qualitative assessments of 6 dictionary-based methods applied to 4 different corpora, and briefly examine a further 20 methods. We show that while inappropriate for sentences, dictionary-based methods are generally robust in their classification accuracy for longer texts. Most importantly they can aid understanding of texts with reliable and meaningful word shift graphs if (1) the dictionary covers a sufficiently large portion of a given text’s lexicon when weighted by word usage frequency; and (2) words are scored on a continuous scale.
We developed computational models to predict the emergence of depression and Post-Traumatic Stress Disorder in Twitter users. Twitter data and details of depression history were collected from 204 individuals (105 depressed, 99 healthy). We extracted predictive features measuring affect, linguistic style, and context from participant tweets (N = 279,951) and built models using these features with supervised learning algorithms. Resulting models successfully discriminated between depressed and healthy content, and compared favorably to general practitioners' average success rates in diagnosing depression, albeit in a separate population. Results held even when the analysis was restricted to content posted before first depression diagnosis. State-space temporal analysis suggests that onset of depression may be detectable from Twitter data several months prior to diagnosis. Predictive results were replicated with a separate sample of individuals diagnosed with PTSD (N-users = 174, N-tweets = 243,775). A state-space time series model revealed indicators of PTSD almost immediately post-trauma, often many months prior to clinical diagnosis. These methods suggest a data-driven, predictive approach for early screening and detection of mental illness.
We propose and develop a Lexicocalorimeter: an online, interactive instrument for measuring the "caloric content" of social media and other large-scale texts. We do so by constructing extensive yet improvable tables of food and activity related phrases, and respectively assigning them with sourced estimates of caloric intake and expenditure. We show that for Twitter, our naive measures of "caloric input", "caloric output", and the ratio of these measures are all strong correlates with health and well-being measures for the contiguous United States. Our caloric balance measure in many cases outperforms both its constituent quantities; is tunable to specific health and well-being measures such as diabetes rates; has the capability of providing a real-time signal reflecting a population's health; and has the potential to be used alongside traditional survey data in the development of public policy and collective self-awareness. Because our Lexicocalorimeter is a linear superposition of principled phrase scores, we also show we can move beyond correlations to explore what people talk about in collective detail, and assist in the understanding and explanation of how population-scale conditions vary, a capacity unavailable to black-box type methods.
Herbert Simon's classic rich-get-richer model is one of the simplest empirically supported mechanisms capable of generating heavy-tail size distributions for complex systems. Simon argued analytically that a population of flavored elements growing by either adding a novel element or randomly replicating an existing one would afford a distribution of group sizes with a power-law tail. Here, we show that, in fact, Simon's model does not produce a simple power-law size distribution as the initial element has a dominant first-mover advantage, and will be overrepresented by a factor proportional to the inverse of the innovation probability. The first group's size discrepancy cannot be explained away as a transient of the model, and may therefore be many orders of magnitude greater than expected. We demonstrate how Simon's analysis was correct but incomplete, and expand our alternate analysis to quantify the variability of long term rankings for all groups. We find that the expected time for a first replication is infinite, and show how an incipient group must break the mechanism to improve their odds of success. We present an example of citation counts for a specific field that demonstrates a first-mover advantage consistent with our revised view of the rich-get-richer mechanism. Our findings call for a reexamination of preceding work invoking Simon's model and provide an expanded understanding going forward.
A thermal convection loop is a annular chamber filled with water, heated on the bottom half and cooled on the top half. With sufficiently large forcing of heat, the direction of fluid flow in the loop oscillates chaotically, dynamics analogous to the Earth's weather. As is the case for state-of-the-art weather models, we only observe the statistics over a small region of state space, making prediction difficult. To overcome this challenge, data assimilation (DA) methods, and specifically ensemble methods, use the computational model itself to estimate the uncertainty of the model to optimally combine these observations into an initial condition for predicting the future state. Here, we build and verify four distinct DA methods, and then, we perform a twin model experiment with the computational fluid dynamics simulation of the loop using the Ensemble Transform Kalman Filter (ETKF) to assimilate observations and predict flow reversals. We show that using adaptively shaped localized covariance outperforms static localized covariance with the ETKF, and allows for the use of less observations in predicting flow reversals. We also show that a Dynamic Mode Decomposition (DMD) of the temperature and velocity fields recovers the low dimensional system underlying reversals, finding specific modes which together are predictive of reversal direction.
Solicited public opinion surveys reach a limited subpopulation of willing participants and are expensive to conduct, leading to poor time resolution and a restricted pool of expert-chosen survey topics. In this study, we demonstrate that unsolicited public opinion polling through sentiment analysis applied to Twitter correlates well with a range of traditional measures, and has predictive power for issues of global importance. We also examine Twitter's potential to canvas topics seldom surveyed, including ideas, personal feelings, and perceptions of commercial enterprises. Two of our major observations are that appropriately filtered Twitter sentiment (1) predicts President Obama's job approval three months in advance, and (2) correlates well with surveyed consumer sentiment. To make possible a full examination of our work and to enable others' research, we make public over 10,000 data sets, each a seven-year series of daily word counts for tweets containing a frequently used search term.
Sports are spontaneous generators of stories. Through skill and chance, the script of each game is dynamically written in real time by players acting out possible trajectories allowed by a sport's rules. By properly characterizing a given sport's ecology of "game stories," we are able to capture the sport's capacity for unfolding interesting narratives, in part by contrasting them with random walks. Here we explore the game story space afforded by a data set of 1310 Australian Football League (AFL) score lines. We find that AFL games exhibit a continuous spectrum of stories rather than distinct clusters. We show how coarse graining reveals identifiable motifs ranging from last-minute comeback wins to one-sided blowouts. Through an extensive comparison with biased random walks, we show that real AFL games deliver a broader array of motifs than null models, and we provide consequent insights into the narrative appeal of real games.
Advances in computing power, natural language processing, and digitization of text now make it possible to study a culture's evolution through its texts using a "big data" lens. Our ability to communicate relies in part upon a shared emotional experience, with stories often following distinct emotional trajectories and forming patterns that are meaningful to us. Here, by classifying the emotional arcs for a filtered subset of 1,327 stories from Project Gutenberg's fiction collection, we find a set of six core emotional arcs which form the essential building blocks of complex emotional trajectories. We strengthen our findings by separately applying Matrix decomposition, supervised learning, and unsupervised learning. For each of these six core emotional arcs, we examine the closest characteristic stories in publication today and find that particular emotional arcs enjoy greater success, as measured by downloads.
 Peter Sheridan Dodds合作论文数Department of Computer Science, College of Engineering and Mathematical Sciences, University of Vermont28
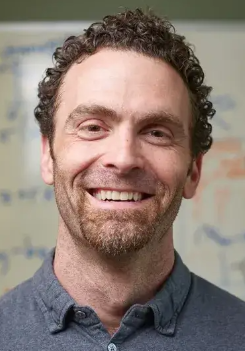 Chris Danforth合作论文数Department of Mathematics and Statistics, College of Engineering and Mathematical Sciences, University of Vermont27
 Jake Ryland Williams合作论文数Computational Story Lab, Vermont Advanced Computing Core;Vermont Complex Systems Center, University of Vermont;Vermont Complex Systems Center, University of Vermont9
 Mitchell Lewis合作论文数813B Stellar-Chance Laboratories, Department of Biochemistry and Biophysics, Perelman School of Medicine, University of Pennsylvania8
 Jane Lydia Adams合作论文数Department of Computer Science, Northeastern University5
 Thayer Alshaabi合作论文数Advanced Bioimaging Center, University of California5
 Frank Morgan合作论文数Department of Mathematics & Statistics, Williams College5
 Michael Arnold合作论文数Historical and Philosophical Studies, University of Melbourne5
 Joshua R. Minot (Josh Minot)合作论文数Computational Story Lab, University of Vermont5
 Brian F. Tivnan合作论文数The MITRE Corporation5
 James P. Bagrow合作论文数University of Vermont5
 Sharon E. Alajajian合作论文数4David Rushing Dewhurst合作论文数Univ Vermont, Vermont Complex Syst Ctr, Dept Math & Stat, Computat Story Lab,Vermont Adv Comp Core, Burlington, VT 05401 USA4emily m cody合作论文数3
 Suma Desu合作论文数Department of Electrical and Computer Engineering, University of Massachusetts3
 Benjamin F. Emery合作论文数Sandia Natl Labs2Tyler J. Gray合作论文数Vermont Adv Comp Core, Univ Vermont2
 Ryan J. Gallagher合作论文数Network Science Institute, Northeastern University2Eric Clark合作论文数2Matthew T. McMahon合作论文数The MITRE Corporation2
 Meredith T. Niles合作论文数2
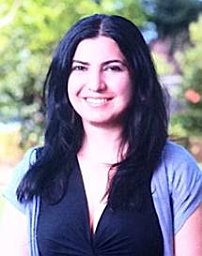 Karine Megerdoomian合作论文数The MITRE Corporation2
 Kameron Decker Harris合作论文数Appl Math, Univ Washington2
 Isabel Kloumann合作论文数Meta;Facebook2Jacob Lahne合作论文数1Dilan Kiley合作论文数1
 Katharina Lix合作论文数Engineering Dept., Stanford U."1
 Colin M. Van Oort合作论文数Complex Syst Ctr, Univ Vermont1Dewhurst David Rushing合作论文数1
 Reece Andrew合作论文数1Gottesman William L合作论文数Computational Story Lab, University of Vermont1Michael J. Smith合作论文数Medical Research Council Laboratory of Molecular Biology, Hills Road, Cambridge CB2 2QH, UK1
 Yves Dubief合作论文数School of Engineering;Mechanical Engineering Program;University of Vermont;School of Engineering, University of Vermont1
 Narine Manukyan合作论文数University of Vermont1
 Lashon B. Booker合作论文数MITRE Corporation1
 Roby Muhamad合作论文数Columbia University1Karl Branting合作论文数Information Discovery and Understanding Department, The MITRE Corporation1
 Ellen Jane Langer合作论文数Department of Psychology, Harvard University1
 Eric Bloedorn合作论文数MITRE Corporation1
 Josh Bongard合作论文数Department of Computer Science, College of Engineering and Mathematical Sciences, The University of Vermont;Morphology, Evolution & Cognition Laboratory1




