Tidal wetlands, located at the dynamic land-sea interface, provide vital ecosystem services, yet face increasing threats from human activities and climate change. Accurate and up-to-date global mapping of tidal wetlands is essential for assessing their status and advancing conservation efforts. However, challenges such as tidal fluctuations and limited data availability lead to inconsistencies across existing datasets. Moreover, previous studies have largely overlooked the adjacent terrestrial environments of tidal wetlands, reducing our understanding of coastal dynamics and associated environmental drivers. To address these critical issues, this study proposes a novel global coastal mapping framework with three key components. First, using the ocean tide model EOT20, we systematically analyzed tidal variations observed in Sentinel-1 and Sentinel-2 imagery between 2019 and 2021, facilitating the development of an adaptive image selection strategy to ensure low-tide coverage. Second, we integrated multi-source global datasets and employed a knowledge-driven, semi-automatic sampling approach to generate training samples for tidal wetlands and adjacent land covers. Third, we iteratively trained and refined random forest models using tide-level and phenological features extracted from composite optical and radar imagery, producing a global coastal dataset centered on 2020 with 11 distinct land cover types. The mapping result was cross-compared with multiple global and regional coastal datasets and validated using the temporally cleaned external dataset, achieving an overall accuracy of 92.7%. By optimizing the selection of Sentinel scenes to approximately 10-50 in time-series composite mapping, this approach balances computational efficiency with intertidal classification accuracy. The dataset delineates the global distribution of tidal wetlands and their adjacent environments at a 10-m resolution; specifically, tidal wetlands-including mangroves, tidal marshes, and tidal flats, amount to 425,509 +/- 932 km2. This fine-resolution and multi-category mapping framework enables a more precise identification of potential trade-offs between conservation and development, providing valuable references for sustainable coastal management.
The statistical distributions of surface reflectance (SR) are foundational to statistical modeling, learning, and inference in optical remote sensing. However, common assumptions, such as the Gaussian distribution, lack a rigorous theoretical basis and comprehensive validation, fundamentally limiting the advancement of statistical methodologies in remote sensing. This study addresses this long-standing gap based on the principles of statistical optics and revealed that SR in homogeneous surface regions follows a Gamma distribution and that its logarithm (logSR) approximately follows a Gaussian distribution under additional conditions. The derived properties were systematically validated using an extensive dataset, including 13,976 fine-scale samples, 4,498 meso-scale samples and four global-scale land cover sample sets. The Gamma distribution was validated with a high conformity rate of 0.73 at fine scales (approx. 1 km), with its robustness strengthening as region size increases. Moreover, it consistently outperformed the empirical Gaussian assumption, yielding 60% to 125% higher conformance rates in general scenarios. To apply our findings, we integrated the Gaussian property of logSR into a Bayesian framework to develop an interpretable method: Approximate Bayesian Optimal Classifier (ABOC). Surpassing the limited interpretability of "black-box" AI models, ABOC provides clear physical insights and allows for the explicit tracing of classification errors. Requiring no features engineering, ABOC achieved an overall accuracy of 73.7% on a global multi-season dataset of 128,822 validation samples, outperforming Cat-Boost (71.9%), LightGBM (71.5%) and Random Forest (70.7%) across all seasons. Furthermore, it surpassed global land cover products like Dynamic World and GLC_FCS30D by a substantial margin over 10%. This demonstrates the significant performance gain unlocked by embedding the statistical distribution of SR into a classification framework. This work reveals a general statistical law for SR, providing a solid theoretical basis that bridges remote sensing physics with machine learning to enable a new generation of physically-grounded, highly accurate, and robust algorithms.
Long-term land cover dynamics are a key regulator of regional carbon storage, yet most assessments still rely on a few temporal snapshots and therefore overlook how land transitions unfold over time. Here we reconstruct annual land cover in Hunan Province, China, from 1990 to 2023 using a multi-task deep learning framework, and combine it with climate-corrected carbon accounting, driver attribution and future scenario simulation. Although total carbon storage increased from 2122.74 Mt in 1990 to 2209.98 Mt in 2023 in Hunan, this net gain masked pronounced spatial heterogeneity and distinct carbon responses to land cover transition frequency and pathways. Trajectory analysis further showed that different change frequencies and transition pathways produced distinct carbon consequences, with return-type pathways tending toward near-neutral responses and directional pathways leading to clearer carbon gains or losses. The dominant drivers of carbon storage were also not stationary, with vegetation condition prevailing in 2000 and 2020, whereas population density became most important in 2010. Interactions among vegetation condition, topography, and population density mainly shaped spatial heterogeneity in carbon storage. Historical-trend simulation further indicates that regional carbon storage growth may decelerate sharply by 2030, with only a marginal increase of 1.35 Mt relative to 2020. These findings are particularly concerning because the potential to offset the carbon costs of continued urban expansion through land conversion alone may be increasingly limited, making the protection of existing high-carbon ecological spaces more urgent.
Artificial Night-Time Light (NTL) remote sensing is a vital proxy for quantifying the intensity and spatial distribution of human activities. Although the NPP-VIIRS sensor provides high-quality NTL observations, its temporal coverage, which begins in 2012, restricts long-term time-series studies that extend to earlier periods. Current extended VIIRS-like NTL data products suffer from two significant shortcomings: the underestimation of light intensity and the omission of structural details. To overcome these limitations, we present the Extended VIIRS-like Artificial Nighttime Light (EVAL) dataset, a new annual NTL dataset for China spanning from 1986 to 2024. This dataset was generated using a novel two-stage deep learning model designed to address the aforementioned shortcomings. The model first constructs an initial estimate and subsequently refines fine-grained structural details using high-resolution impervious surface data as guidance. Quantitative evaluations demonstrate that EVAL significantly outperforms state-of-the-art products, exhibiting superior temporal consistency and a stronger correlation with socioeconomic indicators.
High-quality reference samples have become a central bottleneck for large-scale remote sensing mapping as Earth observation data, machine learning models, and computing resources become increasingly abundant. Quantitatively characterizing the learning curve, namely the relationship between sample size (N) and model performance (P), is therefore critical for diagnosing mapping systems, assessing learning efficiency, forecasting performance, and optimizing sample use. Here, we establish a Scaling Law framework for remote sensing mapping. We formulate a unified Log-Logistic Scaling Law for both performance metrics that increase with N and (error metrics that decrease with N, P(N) = P infinity + (P0 - P infinity)/ 1 + a(N -1)k ), where P infinity represents the asymptotic performance limit, k represents learning efficiency and a controls the sample-size transition scale. We further interpret this relationship through statistical learning, distribution matching, and convergence of remote sensing data distributions. We validate the Scaling Law across land cover classification and biomass estimation; across point-level and patch-level annotations; and across multiple models, feature settings, evaluation metrics, uncertainty analyses, and controlled label-noise conditions. The fitted curves consistently captured the empirical learning curves, with fitting errors remaining at very low orders of magnitude for classification tasks, including approximately 10-4 for stable model settings and generally 0.0005-0.0025 across feature and model-complexity experiments. For biomass estimation, although absolute RMSE was much larger because of global heterogeneity and GEDI target uncertainty, the decreasing RMSE trajectory still conformed to the Scaling Law. Simulation experiments further showed that the fitted P infinity approached the theoretical limit, supporting its interpretation as a meaningful estimate of attainable model performance. To operationalize this principle, we develop ScaL-Frame for early-stage performance prediction and optimal sample size estimation. Under Static Validation, using only 10% of the available sample pool produced endpoint prediction tolerances of 0.031 OA for FAST, 0.050 OA for CoastTrain, and 24.707 Mg/ha for AGBD. ScaL-Frame also produced stable optimal sample size estimates under Target Gap and Marginal Gain criteria, with Marginal Gain generally providing more robust early-stage estimates. Overall, this study provides a predictive and quantitative foundation for designing, diagnosing, and optimizing sample-intensive remote sensing mapping projects.
The Ramsar Convention is a global endeavor for the protection of wetlands. However, there is limited research on its efficacy in safeguarding China’s wetlands. This study aims to identify differences within Chinese Ramsar sites and their surrounding areas over the past three decades. This assessment was conducted using extensive land cover maps created by ESA CCI (European Space Agency Climate Change Initiative) through the classification of remote sensing data using the LCCS (Land Cover Classification System) and other systems specified by the IPCC (Intergovernmental Panel on Climate Change), in addition to ecoregion maps. Three primary assessments were performed: detection of change in land covers, fragmentation using effective mesh size and driver analysis using a random forest classifier. The findings indicate significant land cover changes within both Ramsar sites and their surrounding areas. Tree cover and grasslands showed the largest decrease in land cover while flooded shrubs and herbaceous cover showed the largest increase within the Ramsar sites. In contrast, urban areas had the largest overall change in the surrounding areas, with twice the increase compared to the areas within the Ramsar sites. Most land cover changes within the Ramsar sites occurred closest to their boundaries where more human interactions occurred. It was also found that the fragmentation of flooded vegetation and water was also greater in areas surrounding the Ramsar sites in comparison to areas within the sites. This study also identified human activity as the primary driver of all observed changes, especially for wetlands. The differences observed indicate the effectiveness of Chinese Ramsar sites in wetlands protection and provide invaluable information for future strategic planning.
Trees are recognized as a pivotal nature-based solution for mitigating urban thermal stress. Urban tree cooling efficiency (CE), defined as the temperature reduction per 1 % increase in tree coverage percentage (TCP), serves as an effective metric to optimize the cooling benefits of trees given limited urban spaces. Despite vast literature on CE of urban trees, however, the spatial heterogeneity of CE within and across cities remains poorly understood. To address this gap, this study proposed a unified framework to quantify CE as a function of TCP. We used land cover dataset with high resolution and Landsat land surface temperature (LST), coupled with a nonlinear modeling approach to assess CE across 302 Chinese cities. The results reveal a U-shaped pattern of CE as TCP increases within a city: areas with low and high tree coverage exhibit notable CE, while CE diminishes in areas with moderate tree cover. This U-shaped pattern is observed in over 75 % of the studied cities, with over 80 % in Eastern and Southwest China, while a lower percentage of 40% is shown in Northern China. CE variations across cities are driven by different factors as TCP changes. In areas with less than 70 % tree cover, human-induced factors of the cities such as socioeconomic development and urban morphology dominate. Whereas, in areas with higher tree cover, natural factors including air temperature, precipitation and urban greenness play a more significant role. Among these factors, the impacts of building height and air temperature on CE differ significantly between high-TCP areas and medium-to low-TCP areas. Our findings provide novel insights into the marginal cooling effect of increasing urban trees at varying tree cover levels and the dynamic interplay between anthropogenic environment and local climate. These insights provide valuable guidance for urban planning and management strategies aimed at promoting thermally sustainable cities.
Rising natural hazards amid a warming climate increasingly threaten human health and sustainable development. While infrastructure serves as a critical buffer against these risks, the relationships between hazard exposure, infrastructure access, and health outcomes remain unclear. Here, we assess global human exposure to joint flooding and extreme heat risks since 2000 and examine their interactions with infrastructure access in shaping human health. Results reveal stark inequalities, with 48% of the global population (~ 4 billion people) living in areas highly exposed to both hazards. Low-income countries are disproportionately affected, facing 5.37 times the flood exposure and 1.98 times the extreme heat exposure of other income groups, yet having only 30% of their critical infrastructure access. Enhanced infrastructure access is significantly associated with longer life expectancy (p < 0.05), but high levels of hazard exposure diminish these benefits. Future projections under the Shared Socioeconomic Pathway (SSP) 1-2.6, 2-4.5, and 5-8.5 scenarios indicate substantial increases in country-level hazard exposure by 2100 relative to baseline levels: 40%–393% for floods and 22%–161% for extreme heat. The share of areas simultaneously exposed to high levels of both hazards rises from 15%–18% in 2030 to 22%–51% by 2100, potentially widening existing gaps in infrastructure access and health disparities. These findings highlight the urgent need for targeted interventions that enhance infrastructure equity in climate adaptation and health strategies, especially for vulnerable populations.
Tree height is a key indicator in forest ecology, reflecting tree growth status and ecosystem structure. Traditional methods of tree height measurement rely on ground-based measurements, which are limited by cost and time. In recent years, the development of machine learning and multi-source remotely sensed technologies has provided new ways to measure tree height. In this study, we utilized light detection and ranging and satellite data to extract spectral, vegetation, texture, polarization, terrain, and season features. By integrating these features with machine learning, deep learning, and optimization methods, we dynamically estimated tree heights in Shenzhen during summer and winter from 2018 to 2023 and validated seasonal and regional scalability. It was found that (a) the seasonal tree height neural network demonstrated the highest prediction accuracy in tree height estimation (R2 = 0.72, mean absolute error = 1.89 m), and the optimization process of Shapley additive explanations reduced 23 features, which improved the prediction accuracy (R2 = 0.80, mean absolute error = 1.58 m) and saved computational resources; (b) the seasonal tree height neural network has a strong generalizability for estimating tree height across seasons and regions; and (c) during 2018 to 2023, tree heights in Shenzhen were mainly concentrated in 6 to 14 m, and the spatial distribution has a strong autocorrelation. Tree canopy heights in winter are generally lower than those in summer, and the tree growth rate shows spatial heterogeneity. Overall, this study uncovers the intricate interplay between tree growth and seasonal variations in its traits throughout the urbanization process in Shenzhen. It offers valuable data support and a theoretical foundation for urban greening management and ecological protection.
Urban trees serve as vital nature-based solutions for improving thermal sustainability and livability. While many studies have examined the effects of urban trees on temperature given their horizontal distribution, the effects of their vertical structure, especially in relation to surrounding buildings, remain underexplored. To address this knowledge gap, this study investigates the influence of tree height on land surface temperature (LST) during summer across 305 Chinese cities, using high-resolution datasets on tree cover and their vertical structures. The results reveal a similar magnitude of tree height on LST to the effect of horizontal canopy coverage variations. At a given tree cover level, increasing tree height initially elevates LST but eventually leads to cooling as tree height continues to rise. This reversal of covariation between LST and tree height stems from two competing processes-warming due to increased shortwave radiation capture as tree height rises vs. cooling from enhanced evapotranspiration. The critical threshold, where cooling outweighs warming, is observed at a median tree height of 4.3 m below surrounding buildings. The cooling effect is more significant in regions south of 30 degrees N. These findings highlight the importance of accounting for vertical interactions between urban trees and buildings to enhance our understanding of their combined effects on thermal environment.
Accurate, detailed, and up-to-date urban land use information plays a key role in understanding the urban environment, enhancing urban planning, and promoting sustainable urban development. Recent advancements have focused on refining urban land use classification methods and generating data products at various scales. However, detailed parcel-level urban land use mapping across China remains insufficient with low accuracy. To address this issue, we propose an enhanced mapping framework of essential urban land use categories by integrating multi-modal deep learning models and multi-source geospatial data. Utilizing complete, accurate land parcels derived from the combined OpenStreetMap and Tianditu road networks as the smallest classification units, we have developed an enhanced Essential Urban Land Use Categories (EULUC) map covering all cities in China for 2022, termed EULUC-China 2.0. The mapping results show that residential, industrial, and park and greenspace are the dominant land use categories, collectively accounting for nearly 78% of the urban area. Compared to its predecessor, EULUC-China 1.0, the updated 2.0 version offers more detailed, spatially explicit information that reveals distinct spatial patterns within diverse land use compositions of each city. Our evaluation demonstrates that the overall accuracies of Level-I and Level-II classification reach up to 79 % and 72 %, respectively, representing substantial enhancements across all categories over the previous product. These improvements are primarily attributed to the effectiveness of deep learning in processing multi-modal inputs, particularly through the graph modeling of Point-of-interest (POI) data. The publicly accessible product (https://zenodo.org/records/15180905) and the insights derived from this study offer a valuable dataset and references for researchers and practitioners addressing critical challenges in urbanization.
Economic, social and environmental infrastructure forms a fundamental pillar of societal development. Ensuring equitable access to infrastructure for all residents is crucial for achieving the Sustainable Development Goals, yet knowledge gaps remain in infrastructure accessibility and inequality and their associations with human health. Here we generate gridded maps of economic, social and environmental infrastructure distribution and apply population-weighted exposure models and mixed-effects regressions to investigate differences in population access to infrastructure and their health implications across 166 countries. The results reveal contrasting inequalities in infrastructure access across regions and infrastructure types. Global South countries experience only 50-80% of the infrastructure access of Global North countries, whereas their associated inequality levels are 9-44% higher. Both infrastructure access and inequality are linked to health outcomes, with this relationship being especially pronounced in economic infrastructure. These findings underscore the necessity of informed decision-making to rectify infrastructure disparities for promoting human well-being.
According to the World Meteorological Organization (WMO), 2024 was the hottest year on record. China had unprecedented heat and heavy precipitation, with a national average temperature of 10 center dot 9 degrees C, 1 center dot 01 degrees C higher than the historical average (1991-2020), and annual precipitation of 697 center dot 7 mm, which is 9 center dot 0% higher than the average. As 2025 marks the 10th anniversary of the Paris Agreement and a key juncture for submitting new contributions, accelerating global climate action is imperative, especially in cities, which account for 58% of the world's population and 70% of total carbon emissions. The sixth annual Lancet Countdown China report on health and climate change, led by the Lancet Countdown Asia Centre at Tsinghua University and coauthored by 80 experts from 27 institutions, tracks 33 indicators across five domains. This year's report features several key updates. Methodologically, the Countdown used the China Meteorological Administration's Chinese global land-surface reanalysis product (CRA40) reanalysis dataset to replace European reanalysis product (ERA5, the fifth generation European Centre for Medium-Range Weather Forecasts reanalysis dataset) data for improved accuracy. The report expanded 17 indicators from the provincial to city level to support targeted local policy making. Furthermore, the report introduced three new indicators-sleep loss (indicator 1.1.4), compound heatwaves (indicator 1.1.5), and the Greenspace Exposure Inequality Index (indicator 2.2.3), along with two new panels on city-level research. As with previous years, where possible, all indicators have been updated with the latest data and methodological refinements.
The year 2023 marked a pivotal moment for climate change globally, across Asia, and within China. China experienced its highest recorded average annual temperature of 10.71 degrees C (0.82 degrees C above the 1981-2010 average), its second-lowest annual rainfall since 2012, and endured significant flood and drought events. The 1.5 degrees C warming limit set by the Paris Agreement is on the verge of being exceeded, posing severe threats to human health, underscoring the urgent need for immediate action. In 2024, the Lancet Countdown Asia Centre, leading a collaboration of 77 experts from 28 prominent research institutions, released the fifth China Report of the Lancet Countdown on health and climate change. This report tracks China's progress in addressing health and climate change.The report is structured around five thematic domains encompassing 31 indicators: (1) climate change impacts, exposures, and vulnerability; (2) adaptation, planning, and resilience for health; (3) mitigation actions and health co-benefits; (4) economics and finance; (5) public and political engagement. The report in this year adopted a forward-looking perspective, including predictive analyses of climate-related health risks and tracks trends in compound exposures (Pannel 2), emphasizing the urgent need for adaptive measures. Two new indicators are introduced this year: health-care sector emissions (Indicator 3.4) and stranded coal assets from the low-carbon transition (Indicator 4.2.5), both underscoring the necessity of mitigation efforts to safeguard public health. The findings reveal that health risks are already severe and are projected to worsen significantly. In 2023, the average number of heatwave exposure days per capita in China reached 16 days, over three times the historical average (1986-2005). Heatwave-related mortality surged by 1.9 times, while heat-related losses in labor productivity increased by approximately 24%, and safe outdoor activity hours dropped by 60%. Compound hot and dry days also rose sharply, with 2023 recording 30 times the average from 1986-2005. By 2060, compared to the baseline (1986-2005), annual average heatwave-related mortality is projected to increase by 183%-275%, and labor productivity losses by 28%-37%. By 2030, mortality attributable to wildfires are expected to rise by 28%-36% compared to the baseline. Moreover, compared to 2013-2019 levels, the annual excess risk of dengue fever incidence is anticipated to increase by 15.3%-15.5%by 2060, with provinces such as Hainan, Guangdong, Jiangsu, and Shanxi facing a surge of 30%-60%. Based on the findings, the following recommendations are put forth to safeguard against the climate change-related health risks: Establish an effective inter-departmental coordination mechanism for responding to health risks from climate change. China should implement a ministerial coordination mechanism at the national level to coordinate resources, and explore best practices for establishing local coordination mechanisms. Accelerate the implementation of the control of overall carbon emissions at the regional level. With national policies now issued, regions need to quickly expand renewable energy, reduce the carbon intensity of energy, and enhance carbon emissions control to avoid future risks of stranded assets and health damages. Advance climate and health-friendly investment and financing. China will need to cut fossil fuel subsidies and increase financial support for essential mitigation and adaptation technologies. Develop a low-carbon health-care system. China should set China will need to cut fossil fuel subsidies and increase financial support for essential mitigation and adaptation technologies. Provide high-quality health meteorological services. Current tailored weather-related health services should be expanded to other parts in China. These services should offer personalised warnings that consider the specific geographical location, the prevalent diseases in the area, and individual susceptibilities.
Amid renewed commitments to healthy city agendas, the "Space and Health" nexus has become a critical interdisciplinary frontier, garnering increasing attention from urban planners, geographic information scientists, environment designers, and public health experts. Despite advances in data analytics and rapidly expanding literature, notable gaps remain in conceptual clarity, problem identification, mechanism construction, and policy translation. To address these challenges, Frontiers of Urban and Rural Planning convened a roundtable on Healthy City Science and Health GIS at the 2025 Healthy City Science Conference, bringing together scholars from leading Chinese and international universities to discuss conceptual foundations, applications of novel data and methods, and directions for advancing spatial health research. The discussion converged on an agenda that prioritizes scientific knowledge production and its implications to interventions. Panelists underscored the need to define “health” and “space” in context to anchor problem identification and design feasible interventions. They highlighted the opportunities to improve exposure measurement with new data and to open the black box between objective environments and subjective perception through interdisciplinary approaches. These endeavors lay the groundwork for elucidating causal pathways linking space and health. Panelists also called for research designed with policy relevance, supported by interdisciplinary collaborations and the use of emerging analytical tools. This roundtable discussion presents a reflection on current theoretical critiques and innovative propositions within spatial health research. It provides guidance for building a coherent theoretical and applied framework for Health City Science and Planning and enhances the academic and practical value of space-health research within broader agendas for global health and sustainable urban development.
Maintenance hemodialysis patients are at increased risk of cardiovascular complications and mortality following COVID-19 infection due to compromised immune function. This study aims to evaluate the impact of the COVID-19 vaccine (CoronaVac) on cardiac function and survival in this population. Background/Objectives: We aimed to examine whether CoronaVac vaccination affects heart function and survival rates in maintenance hemodialysis patients. Specifically, we assessed changes in heart ultrasound (echocardiographic) measurements, B-type natriuretic peptide (BNP) levels, and survival outcomes by comparing vaccinated and unvaccinated patients. Methods: A retrospective analysis was conducted on 531 maintenance hemodialysis patients, including 79 who received CoronaVac and 452 who did not. We compared the pre- and post-infection changes in heart function (echocardiographic parameters) and BNP levels between the two groups and assessed their association with the survival rates. Results: The vaccinated patients were younger (60.54 ± 13.51 vs. 65.21 ± 13.76 years, p = 0.006) and had shorter dialysis durations (56.04 ± 51.88 vs. 73.73 ± 64.79 months, p = 0.022). The mortality rate was also significantly lower in the vaccinated group (6.33% vs. 14.38%, p = 0.049). After infection, the unvaccinated patients showed significant declines in heart function and increased B-type natriuretic peptide levels, while the vaccinated patients demonstrated no significant deterioration. Older age, coronary artery disease, inflammation levels, and heart abnormalities were identified as the key risk factors for mortality. Conclusions: CoronaVac was linked to lower mortality and better heart function in maintenance hemodialysis patients. The vaccine may help to reduce infection severity, lower strain on the heart, and improve the overall prognosis.
Hemorrhagic Fever with Renal Syndrome (HFRS) is a zoonotic disease caused by hantaviruses, remains a significant public health challenge in China. Despite a decline in national incidence, persistent regional outbreaks highlight a need to understand how scientific research corresponds to these evolving epidemiological patterns to better inform public health strategies. We aimed to identify the spatiotemporal correlations between HFRS incidence and research publication output in China, identifying trends and disparities to inform future research priorities. We conducted a bibliometric and spatial analysis of 3,304 Chinese articles from the China National Knowledge Infrastructure (CNKI) and 556 English articles from Web of Science (WOS) from 1981 to 2023. Provincial HFRS incidence data were correlated with publication output using Spearman’s correlation and the Geographical Detector model across distinct analytical phases. HFRS incidence declined nationally but remained concentrated in specific regions. Domestic publications (CNKI) peaked during Phase 2 (1992–2006; 120–226/year), while international publications (WOS) surged in Phase 3 (2007–2023). A strong and consistent spatial correlation was found between HFRS incidence and CNKI publication output (q > 0.49). In contrast, the correlation with WOS publications only became significance in Phase 3 (q = 0.271). Thematic analyses revealed differing research priorities: CNKI publications emphasized clinical and epidemiological research, while WOS focused more on epidemiological and mechanistic research. Collaboration networks became increasingly international in Phase 3, with Beijing and Shaanxi emerging as central hubs. This study reveals a strong spatial correspondence between research output and disease incidence in high-incidence province. However, it also underscores significant research gaps in some highly affected yet under-resourced regions. The diverging thematic focus and collaboration patterns between domestic and international publications reflect the evolution of China’s research ecosystem. Integrating bibliometric with epidemiological analysis provides a robust, evidence-based framework to help guide equitable resource allocation and foster collaborations that address the persistent challenges of HFRS.
Crop residue burning (CRB) is a major contributor to air pollution in China. Current fire detection methods, however, are limited by either temporal resolution or accuracy, hindering the analysis of CRB's diurnal characteristics. Here we explore the diurnal spatiotemporal patterns and environmental impacts of CRB in China from 2019 to 2021 using the recently released NSMC-Himawari-8 hourly fire product. Our analysis identifies a decreasing directionality in CRB distribution in the Northeast and a notable southward shift of the CRB center, especially in winter, averaging an annual southward movement of 7.5°. Additionally, we observe a pronounced skewed distribution in daily CRB, predominantly between 17:00 and 20:00. Notably, nighttime CRB in China for the years 2019, 2020, and 2021 accounted for 51.9%, 48.5%, and 38.0% respectively, underscoring its significant environmental impact. The study further quantifies the hourly emissions from CRB in China over this period, with total emissions of CO, PM10, and PM2.5 amounting to 12,236, 2,530, and 2,258 Gg, respectively. Our findings also reveal variable lag effects of CRB on regional air quality and pollutants across different seasons, with the strongest impacts in spring and more immediate effects in late autumn. This research provides valuable insights for the regulation and control of diurnal CRB before and after large-scale agricultural activities in China, as well as the associated haze and other pollution weather conditions it causes.
Based on the millimeter-wave cloud radar detection data from the western region of Liaoning Province, China (hereinafter referred to as western Liaoning) in 2020, the vertical structure characteristics of clouds were studied. The analysis results show that: (1) The occurrence frequency of clouds is 25.50%, while single-layer clouds occurrence frequency is 19.45% accounted for the largest proportion. The diurnal variation of occurrence rates differs across seasons. High clouds have the highest occurrence frequency, accounting for 40.03% of all clouds. (2) The average rainfall intensity of cloud precipitation throughout the year is 3.1 mm/h, and the precipitation mainly originates from single-layer and double-layer clouds. The rainfall intensity weakens as the number of cloud layers increases, and the precipitation of multi-layer clouds is mainly produced by low-layer clouds. (3) The average thickness of the cloud interlayer for precipitating clouds is 1.4 km, with 82.1% of cloud interlayer thicknesses being less than 2 km. The average thickness of the cloud interlayer for non-precipitating clouds is 1.84 km, with 70.8% of cloud interlayer thicknesses being less than 2 km. The cloud interlayer thickness generally decreases with the increase in the number of cloud layers.
 Peng Gong (宫鹏)合作论文数Department of Geography, The University of Hong Kong;Tsinghua University75
 Huaiyu Tian (田怀玉)合作论文数College of Global Change and Earth System Science, Beijing Normal University34
 Yuqi Bai (白玉琪)合作论文数Department of Earth System Science, Tsinghua University30
 Shanqian Huang合作论文数21
 Ying Tu (屠滢)合作论文数18
 Ziyue Chen (陈子悦)合作论文数Faculty of Geographical Science, Beijing Normal University;State Key Laboratory of Remote Sensing and Digital Earth, Beijing Normal University18
 Le Yu (俞乐)合作论文数Department of Earth System Science, Tsinghua University18
 Jing Yang (杨静)合作论文数Faculty of Geographical Science, Beijing Normal University17
 Jun Yang (杨军)合作论文数Department of Earth System Science, Tsinghua University17Zhou, S.Z.合作论文数16
 Jun Cai (蔡俊)合作论文数Department of Epidemiology, School of Public Health, Fudan University16
 Ruiyun Li (李瑞云)合作论文数Department of Epidemiology, School of Public Health, Nanjing Medical University15
 Qiyong Liu (刘起勇)合作论文数National Institute for Communicable Disease Control and Prevention, Chinese Center for Disease Control and Prevention;School of Public Health, Shandong Second Medical University15
 Bo Xu合作论文数14
 Zhehao Ren (任浙豪)合作论文数Key Lab Earth Syst Modeling, Tsinghua Univ13
 Dabo Guan (关大博)合作论文数Department of Earth System Science, Tsinghua University;The Bartlett School of Sustainable Construction, University College London13
 Yong Luo (罗勇)合作论文数Department of Earth System Science, Tsinghua University13
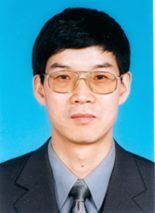 Tianxiang Yue (岳天祥)合作论文数Institute of Geographic Sciences and Natural Resources Research, Chinese Academy of Sciences;University of Chinese Academy of Sciences13
 Bernard Cazelles合作论文数Sorbonne University;Ecole Normale Supérieure13Jie Wang (王洁)合作论文数School of Hydrology and Water Resources, Nanjing University of Information Science & Technology12Liang Lu (鲁亮)合作论文数National Institute for Communicable Disease Control and Prevention, Chinese Center for Disease Control and Prevention12
 Tao Zhang (张涛)合作论文数School of Architecture, Tsinghua university12
 Wenjia Cai (蔡闻佳)合作论文数Department of Earth System Science, Tsinghua University12
 Nils Chr. Stenseth (尼尔斯·克里斯蒂安·斯坦塞斯)合作论文数Centre for Ecological and Evolutionary Synthesis, Department of Biosciences, Faculty of Mathematics and Natural Sciences, University of Oslo;Vanke School of Public Health, Tsinghua University12
 Yimeng Song合作论文数Dept Land Surveying & Geoinformat, Hong Kong Polytech Univ11PengBo Yu (余鹏博)合作论文数11
 Lifan Chen合作论文数11Jingjun Wang合作论文数11
 Ryo Michishita合作论文数11
 Bingbo Gao (高秉博)合作论文数College of Land Science and Technology, China Agricultural University11
 Xiaoxu Wu (吴晓旭)合作论文数School of Geospatial Engineering and Science, Sun Yat-Sen University10
 Song Liang合作论文数Department of Environmental & Global Health, College of Public Health and Professions, University of Florida10
 Jianyu Chang (常建宇)合作论文数College of Veterinary Medicine, China Agricultural University10
 Bo Huang (黄波)合作论文数Department of Geography and Resource Management, The Chinese University of Hong Kong;Faculty of Geosciences and Engineering, Southwest Jiaotong University;Department of Geography, The University of Hong Kong10
 Bin Chen (陈彬)合作论文数School of Environment, Beijing Normal University10Karen Kie Yan Chan合作论文数10Zhiben Jiang合作论文数9ChaoFeng Ma (马超锋)合作论文数9
 Hui Xiong (熊辉)合作论文数The Hong Kong University of Science and Technology (Guangzhou)9
 Hong Huang (黄弘)合作论文数Department of Engineering Physics, Tsinghua University;School of Safety Science, Tsinghua University9
 Jing Su (苏婧)合作论文数清华大学国际传播研究中心9
 Zhu Liu (刘竹)合作论文数Department of Earth System Science, Tsinghua University;Belfer Center for Science and International Affairs, Harvard University8
 Chenxi Lu合作论文数Tsinghua Univ, Dept Earth Syst Sci, Beijing 100084, Peoples R China8Liangliang Cheng合作论文数8
 Chao Ren (任超)合作论文数Division of Landscape Architecture, Faculty of Architecture, The University of Hong Kong8
 Lei Xu (许磊)合作论文数Vanke School of Public Health, Tsinghua University8
 Quanjiao Chen (陈全姣)合作论文数中国科学院武汉病毒研究所8Zhenyu Jin合作论文数8




