In this paper, we study the propagation of data uncertainty through the marching cubes algorithm for isosurface visualization for correlated uncertain data. Consideration of correlation has been shown paramount for avoiding errors in uncertainty quantification and visualization in multiple prior studies. Although the problem of isosurface uncertainty with spatial data correlation has been previously addressed, there are two major limitations to prior treatments. First, there are no analytical formulations for uncertainty quantification of isosurfaces when the data uncertainty is characterized by a Gaussian distribution with spatial correlation. Second, as a consequence of the lack of analytical formulations, existing techniques resort to a Monte Carlo sampling approach, which is expensive and difficult to integrate into visualization tools. To address these limitations, we present a closed-form framework to efficiently derive uncertainty in marching cubes level-sets for Gaussian uncertain data with spatial correlation (MAGIC). To derive closed-form solutions, we leverage the Hinkley's derivation on the ratio of Gaussian distributions. With our analytical framework, we achieve a significant speed-up and enhanced accuracy of uncertainty quantification over classical Monte Carlo methods. We further accelerate our analytical solutions using many-core processors to achieve speed-ups up to $\text{585} \times$585× and integrability with production visualization tools for broader impact. We demonstrate the effectiveness of our correlation-aware uncertainty framework through experiments on meteorology, urban flow, and astrophysics simulation datasets.
Applications of Implicit Neural Representations (INRs) have emerged as a promising deep learning approach for compactly representing large volumetric datasets. These models can act as surrogates for volume data, enabling efficient storage and on-demand reconstruction via model predictions. However, conventional deterministic INRs only provide value predictions without insights into the model's prediction uncertainty or the impact of inherent noisiness in the data. This limitation can lead to unreliable data interpretation and visualization due to prediction inaccuracies in the reconstructed volume. Identifying erroneous results extracted from model-predicted data may be infeasible, as raw data may be unavailable due to its large size. To address this challenge, we introduce REV-INR, Regularized Evidential Implicit Neural Representation, which learns to predict data values accurately along with the associated coordinate-level data uncertainty and model uncertainty using only a single forward pass of the trained REV-INR during inference. By comprehensively comparing and contrasting REV-INR with existing well-established deep uncertainty estimation methods, we show that REV-INR achieves the best volume reconstruction quality with robust data (aleatoric) and model (epistemic) uncertainty estimates using the fastest inference time. Consequently, we demonstrate that REV-INR facilitates assessment of the reliability and trustworthiness of the extracted isosurfaces and volume visualization results, enabling analyses to be solely driven by model-predicted data.
Broadening the reach of uncertainty visualization requires overcoming the technical barriers of delivering complex, multi-view interfaces across diverse devices. We present WebUVisBox, a framework that addresses these challenges through a modular, scenario-based architecture. By employing a registry pattern and declarative configuration, the framework decouples domain-specific visualization logic from core infrastructure, facilitating rapid extensibility. Simultaneously, its reactive state management and responsive layout engine ensure accessibility, automatically adapting complex analytical tools for both desktop workspaces and mobile field environments. We demonstrate the framework's capabilities through two case studies-wildfire ensemble forecasts and neural network flow uncertainty. The results validate that WebUVisBox effectively balances developer flexibility with the rigorous demands of reproducible, cross-platform scientific analysis
In inverse problems, one attempts to infer spatially variable functions from indirect measurements of a system. To practitioners of inverse problems, the concept of "information" is familiar when discussing key questions such as which parts of the function can be inferred accurately and which cannot. For example, it is generally understood that we can identify system parameters accurately only close to detectors, or along ray paths between sources and detectors, because we have "the most information" for these places. Although referenced in many publications, the "information" that is invoked in such contexts is not a well understood and clearly defined quantity. Herein, we present a definition of information density that is based on the variance of coefficients as derived from a Bayesian reformulation of the inverse problem. We then discuss three areas in which this information density can be useful in practical algorithms for the solution of inverse problems, and illustrate the usefulness in one of these areas -- how to choose the discretization mesh for the function to be reconstructed -- using numerical experiments.
Hyper-differential sensitivity analysis with respect to model discrepancy was recently developed to enable uncertainty quantification for optimization problems. The approach consists of two primary steps: (i) Bayesian calibration of the discrepancy between high- and low-fidelity models, and (ii) propagating the model discrepancy uncertainty through the optimization problem. When high-fidelity model evaluations are limited, as is common in practice, the prior discrepancy distribution plays a crucial role in the uncertainty analysis. However, specification of this prior is challenging due to its mathematical complexity and many hyper-parameters. This article presents a novel approach to specify the prior distribution. Our approach consists of two parts: (1) an algorithmic initialization of the prior hyper-parameters that uses existing data to initialize a hyper-parameter estimate, and (2) a visualization framework to systematically explore properties of the prior and guide tuning of the hyper-parameters to ensure that the prior captures the appropriate range of uncertainty. We provide detailed mathematical analysis and a collection of numerical examples that elucidate properties of the prior that are crucial to ensure uncertainty quantification.
Principal Component Analysis (PCA) is widely used for dimensionality reduction and data analysis. However, PCA results are adversely affected by outliers often observed in real-world data. Existing robust PCA methods are often computationally expensive or exhibit limited robustness. In this work, we introduce a Fast Iterative Robust (FIR) PCA method by efficiently estimating the inliers center location and covariance. Our approach leverages Incremental PCA (IPCA) to iteratively construct a subset of data points that ensures improved location and covariance estimation that effectively mitigates the influence of outliers on PCA projection. We demonstrate that our method achieves competitive accuracy and performance compared to existing robust location and covariance methods while offering improved robustness to outlier contamination. We utilize simulated and real-world datasets to evaluate and demonstrate the efficacy of our approach in identifying and preserving underlying data structures in the presence of contamination.
This work focuses on visualizing uncertainty of local divergence of two-dimensional vector fields. Divergence is one of the fundamental attributes of fluid flows, as it can help domain scientists analyze potential positions of sources (positive divergence) and sinks (negative divergence) in the flow. However, uncertainty inherent in vector field data can lead to erroneous divergence computations, adversely impacting downstream analysis. While Monte Carlo (MC) sampling is a classical approach for estimating divergence uncertainty, it suffers from slow convergence and poor scalability with increasing data size and sample counts. Thus, we present a two-fold contribution that tackles the challenges of slow convergence and limited scalability of the MC approach. (1) We derive a closed-form approach for highly efficient and accurate uncertainty visualization of local divergence, assuming independently Gaussian-distributed vector uncertainties. (2) We further integrate our approach into Viskores, a platform-portable parallel library, to accelerate uncertainty visualization. In our results, we demonstrate significantly enhanced efficiency and accuracy of our serial analytical (speed-up up to 1946X) and parallel Viskores (speed-up up to 19698X) algorithms over the classical serial MC approach. We also demonstrate qualitative improvements of our probabilistic divergence visualizations over traditional mean-field visualization, which disregards uncertainty. We validate the accuracy and efficiency of our methods on wind forecast and ocean simulation datasets.
In this paper, we study uncertainty quantification and visualization of orientation distribution functions (ODF), which corresponds to the diffusion profile of high angular resolution diffusion imaging (HARDI) data. The shape inclusion probability (SIP) function is the state‐of‐the‐art method for capturing the uncertainty of ODF ensembles. The current method of computing the SIP function with a volumetric basis exhibits high computational and memory costs, which can be a bottleneck to integrating uncertainty into HARDI visualization techniques and tools. We propose a novel spherical sampling framework for faster computation of the SIP function with lower memory usage and increased accuracy. In particular, we propose direct extraction of SIP isosurfaces, which represent confidence intervals indicating spatial uncertainty of HARDI glyphs, by performing spherical sampling of ODFs. Our spherical sampling approach requires much less sampling than the state‐of‐the‐art volume sampling method, thus providing significantly enhanced performance, scalability, and the ability to perform implicit ray tracing. Our experiments demonstrate that the SIP isosurfaces extracted with our spherical sampling approach can achieve up to 8164× speedup, 37282× memory reduction, and 50.2% less SIP isosurface error compared to the classical volume sampling approach. We demonstrate the efficacy of our methods through experiments on synthetic and human‐brain HARDI datasets.
Predicting particle trajectories with neural networks (NNs) has substantially enhanced many scientific and engineering domains. However, effectively quantifying and visualizing the inherent uncertainty in predictions remains challenging. Without an understanding of the uncertainty, the reliability of NN models in applications where trustworthiness is paramount is significantly compromised. This paper introduces the uncertainty tube, a novel, computationally efficient visualization method designed to represent this uncertainty in NN-derived particle paths. Our key innovation is the design and implementation of a superelliptical tube that accurately captures and intuitively conveys nonsymmetric uncertainty. By integrating well-established uncertainty quantification techniques, such as Deep Ensembles, Monte Carlo Dropout (MC Dropout), and Stochastic Weight Averaging-Gaussian (SWAG), we demonstrate the practical utility of the uncertainty tube, showcasing its application on both synthetic and simulation datasets.
Transfer function design is crucial in volume rendering, as it directly influences the visual representation and interpretation of volumetric data. However, creating effective transfer functions that align with users' visual objectives is often challenging due to the complex parameter space and the semantic gap between transfer function values and features of interest within the volume. In this work, we propose a novel approach that leverages recent advancements in language-vision models to bridge this semantic gap. By employing a fully differentiable rendering pipeline and an image-based loss function guided by language descriptions, our method generates transfer functions that yield volume-rendered images closely matching the user's intent. We demonstrate the effectiveness of our approach in creating meaningful transfer functions from simple descriptions, empowering users to intuitively express their desired visual outcomes with minimal effort. This advancement streamlines the transfer function design process and makes volume rendering more accessible to a wider range of users.
Over the past two decades Biomedical Engineering has emerged as a major discipline that bridges societal needs of human health care with the development of novel technologies. Every medical institution is now equipped at varying degrees of sophistication with the ability to monitor human health in both non-invasive and invasive modes. The multiple scales at which human physiology can be interrogated provide a profound perspective on health and disease. We are at the nexus of creating “avatars” (herein defined as an extension of “digital twins”) of human patho/physiology to serve as paradigms for interrogation and potential intervention. Motivated by the emergence of these new capabilities, the IEEE Engineering in Medicine and Biology Society, the Departments of Biomedical Engineering at Johns Hopkins University and Bioengineering at University of California at San Diego sponsored an interdisciplinary workshop to define the grand challenges that face biomedical engineering and the mechanisms to address these challenges. The Workshop identified five grand challenges with cross-cutting themes and provided a roadmap for new technologies, identified new training needs, and defined the types of interdisciplinary teams needed for addressing these challenges. The themes presented in this paper include: 1) accumedicine through creation of avatars of cells, tissues, organs and whole human; 2) development of smart and responsive devices for human function augmentation; 3) exocortical technologies to understand brain function and treat neuropathologies; 4) the development of approaches to harness the human immune system for health and wellness; and 5) new strategies to engineer genomes and cells.
Wildfires pose substantial risks to our health, environment, and economy. Studying wildfires is challenging due to their complex interaction with the atmosphere dynamics and the terrain. Researchers have employed ensemble simulations to study the relationship among variables and mitigate uncertainties in unpredictable initial conditions. However, many wildfire researchers are unaware of the advanced visualization available for conveying uncertainty. We designed and implemented an interactive visualization system for studying the uncertainties of fire spread patterns utilizing band-depth-based order statistics and contour boxplots. We also augment the visualization system with the summary of changes in the burned area and fuel content to help scientists identify interesting temporal events. In this paper, we demonstrate how our system can support wildfire experts in studying fire spread patterns, identifying outlier simulations, and navigating to interesting times based on a summary of events.
Lagrangian representations of flow fields have gained prominence for enabling fast, accurate analysis and exploration of time-varying flow behaviors. In this paper, we present a comprehensive evaluation to establish a robust and efficient framework for Lagrangian-based particle tracing using deep neural networks (DNNs). Han et al. (2021) first proposed a DNN-based approach to learn Lagrangian representations and demonstrated accurate particle tracing for an analytic 2D flow field. In this paper, we extend and build upon this prior work in significant ways. First, we evaluate the performance of DNN models to accurately trace particles in various settings, including 2D and 3D time-varying flow fields, flow fields from multiple applications, flow fields with varying complexity, as well as structured and unstructured input data. Second, we conduct an empirical study to inform best practices with respect to particle tracing model architectures, activation functions, and training data structures. Third, we conduct a comparative evaluation of prior techniques that employ flow maps as input for exploratory flow visualization. Specifically, we compare our extended model against its predecessor by Han et al. (2021), as well as the conventional approach that uses triangulation and Barycentric coordinate interpolation. Finally, we consider the integration and adaptation of our particle tracing model with different viewers. We provide an interactive web-based visualization interface by leveraging the efficiencies of our framework, and perform high-fidelity interactive visualization by integrating it with an OSPRay-based viewer. Overall, our experiments demonstrate that using a trained DNN model to predict new particle trajectories requires a low memory footprint and results in rapid inference. Following best practices for large 3D datasets, our deep learning approach using GPUs for inference is shown to require approximately 46 times less memory while being more than 400 times faster than the conventional methods.
Functional depth is a well-known technique used to derive descriptive statistics (e.g., median, quartiles, and outliers) for 1D data. Surface boxplots extend this concept to ensembles of images, helping scientists and users identify representative and outlier images. However, the computational time for surface boxplots increases cubically with the number of ensemble members, making it impractical for integration into visualization tools. In this paper, we propose a deep-learning solution for efficient depth prediction and computation of surface boxplots for time-varying ensemble data. Our deep learning framework accurately predicts member depths in a surface boxplot, achieving average speedups of 6X on a CPU and 15X on a GPU for the 2D Red Sea dataset with 50 ensemble members compared to the traditional depth computation algorithm. Our approach achieves at least a 99% level of rank preservation, with order flipping occurring only at pairs with extremely similar depth values that pose no statistical differences. This local flipping does not significantly impact the overall depth order of the ensemble members.
This paper presents a novel end-to-end framework for closed-form computation and visualization of critical point uncertainty in 2D uncertain scalar fields. Critical points are fundamental topological descriptors used in the visualization and analysis of scalar fields. The uncertainty inherent in data (e.g., observational and experimental data, approximations in simulations, and compression), however, creates uncertainty regarding critical point positions. Uncertainty in critical point positions, therefore, cannot be ignored, given their impact on downstream data analysis tasks. In this work, we study uncertainty in critical points as a function of uncertainty in data modeled with probability distributions. Although Monte Carlo (MC) sampling techniques have been used in prior studies to quantify critical point uncertainty, they are often expensive and are infrequently used in production-quality visualization software. We, therefore, propose a new end-to-end framework to address these challenges that comprises a threefold contribution. First, we derive the critical point uncertainty in closed form, which is more accurate and efficient than the conventional MC sampling methods. Specifically, we provide the closed-form and semianalytical (a mix of closed-form and MC methods) solutions for parametric (e.g., uniform, Epanechnikov) and nonparametric models (e.g., histograms) with finite support. Second, we accelerate critical point probability computations using a parallel implementation with the VTK-m library, which is platform portable. Finally, we demonstrate the integration of our implementation with the ParaView software system to demonstrate near-real-time results for real datasets.
The increasing adoption of Deep Neural Networks (DNNs) has led to their application in many challenging scientific visualization tasks. While advanced DNNs offer impressive generalization capabilities, understanding factors such as model prediction quality, robustness, and uncertainty is crucial. These insights can enable domain scientists to make informed decisions about their data. However, DNNs inherently lack ability to estimate prediction uncertainty, necessitating new research to construct robust uncertainty-aware visualization techniques tailored for various visualization tasks. In this work, we propose uncertainty-aware implicit neural representations to model scalar field data sets effectively and comprehensively study the efficacy and benefits of estimated uncertainty information for volume visualization tasks. We evaluate the effectiveness of two principled deep uncertainty estimation techniques: (1) Deep Ensemble and (2) Monte Carlo Dropout (MC-Dropout). These techniques enable uncertainty-informed volume visualization in scalar field data sets. Our extensive exploration across multiple data sets demonstrates that uncertainty-aware models produce informative volume visualization results. Moreover, integrating prediction uncertainty enhances the trustworthiness of our DNN model, making it suitable for robustly analyzing and visualizing real-world scientific volumetric data sets.
The article offers a behind-the-scenes look at the creation process of last year's special issue article commemorating five decades of SIGGRAPH conferences. In this edited transcription of an interview, the article's editors, Mary Whitton, Chris Johnson, and Dave Kasik, share insights on how the project evolved from a conventional idea to an unconventional groundbreaking collection of personal stories. The interview delves into the inception of the project, the challenges faced in gathering contributions, the innovative methods employed for outreach, and the surprises encountered along the way. From the initial concept to the final publication, the editors recount the collaborative effort involved in producing a comprehensive and visually captivating retrospective. The impact of the article on the SIGGRAPH community especially and the computer graphics community in general is reflected in feedback received, highlighting its value as a repository of memories and a testament to the enduring legacy of the conference. Through personal anecdotes and reflections, the interview captures the spirit of camaraderie and innovation that has characterized SIGGRAPH over the past half-century.
Uncertainty visualization is an emerging research topic in data visualization because neglecting uncertainty in visualization can lead to inaccurate assessments. In this paper, we study the propagation of multivariate data uncertainty in visualization. Although there have been a few advancements in probabilistic uncertainty visualization of multivariate data, three critical challenges remain to be addressed. First, the state-of-the-art probabilistic uncertainty visualization framework is limited to bivariate data (two variables). Second, existing uncertainty visualization algorithms use computationally intensive techniques and lack support for cross-platform portability. Third, as a consequence of the computational expense, integration into production visualization tools is impractical. In this work, we address all three issues and make a threefold contribution. First, we take a step to generalize the state-of-the-art probabilistic framework for bivariate data to multivariate data with an arbitrary number of variables. Second, through utilization of VTK-m’s shared-memory parallelism and cross-platform compatibility features, we demonstrate acceleration of multivariate uncertainty visualization on different many-core architectures, including OpenMP and AMD GPUs. Third, we demonstrate the integration of our algorithms with the ParaView software. We demonstrate the utility of our algorithms through experiments on multivariate simulation data with three and four variables.
Visualization is an important tool for scientists to extract understanding from complex scientific data. Scientists need to understand the uncertainty inherent in all scientific data in order to interpret the data correctly. Uncertainty visualization has been an active and growing area of research to address this challenge. Algorithms for uncertainty visualization can be expensive, and research efforts have been focused mainly on structured grid types. Further, support for uncertainty visualization in production tools is limited. In this paper, we adapt an algorithm for computing key metrics for visualizing uncertainty in Marching Cubes (MC) to multi-core devices and present the design, implementation, and evaluation for a Filter for uncertainty visualization of Marching Cubes on Multi-Core devices (FunMC2). FunMC2 accelerates the uncertainty visualization of MC significantly, and it is portable across multi-core CPUs and GPUs. Evaluation results show that FunMC2 based on OpenMP runs around 11× to 41× faster on multi-core CPUs than the corresponding serial version using one CPU core. FunMC2 based on a single GPU is around 5× to 9× faster than FunMC2 running by OpenMP. Moreover, FunMC2 is flexible enough to process ensemble data with both structured and unstructured mesh types. Furthermore, we demonstrate that FunMC2 can be seamlessly integrated as a plugin into ParaView, a production visualization tool for post-processing.
 David M. Weinstein合作论文数NVIDIA;Westminster College27
 Steven Parker合作论文数NVIDIA23
 Tushar Athawale合作论文数Oak Ridge National Laboratory;Department of Electrical Engineering and Computer Science, University of Tennessee20
 Charles (Chuck) Hansen合作论文数School of Computing, University of Utah;Scientific Computing and Imaging Institute, University of Utah;Linköping University19
 Valerio Pascucci合作论文数Kahlert School of Computing, University of Utah;Center for Extreme Data Management Analysis and Visualization, University of Utah;Scientific Computing and Imaging Institute, School of Computing, University of Utah;National Science Data Fabric;Pacific Northwest National Laboratory15
 Leonid E Zhukov合作论文数BCG X;School of Data Analysis and Artificial Intelligence, Faculty of Computer Science, National Research University - Higher School of Economics15
 Rob MacLeod合作论文数Scientific Computing and Imaging Institute, University of Utah;Department of Biomedical Engineering, John and Marcia Price College of Engineering, University of Utah;Computing in Cardiology15
 Han-Wei Shen合作论文数Department of Computer Science and Engineering, Ohio State University13Allen R. Sanderson合作论文数University of Utah13Kristin Potter合作论文数Scientific Computing and Imaging Institute;University of Utah;Scientific Computing and Imaging Institute, University of Utah13
 Mike Kirby合作论文数Scientific Computing and Imaging Institute, School of Computing, University of Utah12
 Hank Childs合作论文数Lawrence Berkeley National Laboratory11Sudhanshu Sane合作论文数10
 Greg Jones合作论文数10
 Dave Pugmire合作论文数Computer Science and Mathematics Division, Oak Ridge National Laboratory10
 Claudio Silva合作论文数Polytechnic Institute, Tandon School of Engineering, New York University9
 Yarden Livnat合作论文数Scientific Computing and Imaging Institute, University of Utah;School of Medicine, University of Utah9
 Will Usher合作论文数Luminary Cloud8
 Yalchin Efendiev合作论文数Texas A&M University Department of Mathematics8
 Kenneth Moreland合作论文数Oak Ridge National Laboratory8Martin J. Cole合作论文数8
 Craig C. Douglas合作论文数Department of Mathematics and Statistics, University of Wyoming8Alexey A. Samsonov合作论文数Department of Medical Physics, University of Wisconsin-Madison8
 Mengjiao Han合作论文数Univ Utah, SCI Inst, Salt Lake City, UT 84112 USA7
 Charles Keller合作论文数Children’s Cancer Therapy Development Institute7
 Bernd Hamann合作论文数Stratovan Corporation;Department of Computer Science, University of California, Davis7
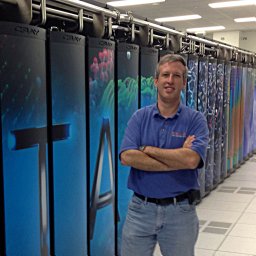 Sean Ahern合作论文数Oak Ridge National Laboratory7
 Feng Wang合作论文数Univ Utah, Sci Comp & Imaging Inst, Salt Lake City, UT 84112 USA6
 Xavier Tricoche合作论文数Department of Computer Science, Purdue University6
 Raytcho D. Lazarov合作论文数Department of Mathematics;Texas A&M University;Department of Mathematics, Texas A&M University6
 Timo Bremer合作论文数Center for Applied Scientific Computing, Lawrence Livermore National Laboratory;Scientific Computing and Imaging Institute, Center of Extreme Data Management Analysis and Visualization, University of Utah6
 Daniel Weiskopf合作论文数Institut für Visualisierung und Interaktive Systeme, Universitat Stuttgart6
 Yaniv Gur合作论文数IBM Research6
 Dafang Wang合作论文数Harbin Institute of Technology, Harbin Institute of Technology6
 George Ostrouchov合作论文数Department of Business Analytics & Statistics, Haslam College of Business, The University of Tennessee, Knoxville6Richard Ewing合作论文数Mathematics, The University of Texas at Austin, 1974.
M.A., Mathematics, The University of Texas at Austin, 1972.
B.A., Mathematics, The University of Texas at Austin, 19696
George Ostrouchov合作论文数Department of Business Analytics & Statistics, Haslam College of Business, The University of Tennessee, Knoxville6Richard Ewing合作论文数Mathematics, The University of Texas at Austin, 1974.
M.A., Mathematics, The University of Texas at Austin, 1972.
B.A., Mathematics, The University of Texas at Austin, 19696 Eugene G Kholmovski合作论文数5
 Liang Zhou (周亮)合作论文数National Institute of Health Data Science, Peking University5
 Hanspeter Pfister合作论文数Harvard John A. Paulson School of Engineering and Applied Sciences, Harvard University5
 Ingo Wald合作论文数NVIDIA;University of Utah5
 Jeremy S. Meredith合作论文数Oak Ridge National Laboratory5
 Scott Klasky合作论文数Scientific Computing Group within the National Center for Computational Sciences (NCCS)5
 Gordon Kindlmann合作论文数Department of Computer Science, University of Chicago5
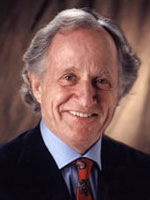 Mario R. Capecchi合作论文数Department of Human Genetics, School of Medicine, University of Utah;Eccles Institute of Human Genetics, School of Medicine, University of Utah;Howard Hughes Medical Institute4
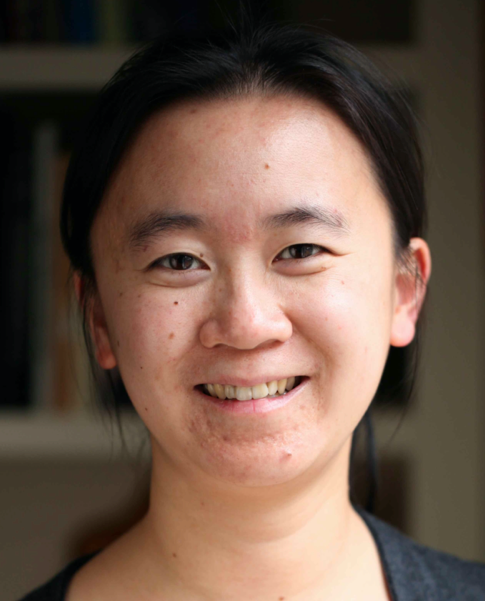 Bei Wang Phillips合作论文数Kahlert School of Computing, University of Utah;Scientific Computing and Imaging Institute, University of Utah4
 Paul Rosen合作论文数Scientific Computing and Imaging Institute, Kahlert School of Computing, University of Utah4
 Christoph Garth合作论文数Scientific Visualization Laboratory, Department of Computer Science, Rheinland-Pfälzische Technische Universität Kaiserslautern-Landau4Rupert K. Schmidt-Ullrich合作论文数4
 Tamara Munzner合作论文数Imager Graphics, Visualization and HCI Lab, Department of Computer Science, Faculty of Science, The University of British Columbia4




