Objective:To analyze demographic characteristics, treatment, and outcome of patients with Kawasaki disease (KD), an acute vasculitis of children with unknown etiology, to gain insight into variation in care and epidemiologic clues regarding the etiology of KD. Study design: We analyzed the first admission for children diagnosed with KD and treated with intravenous immunoglobulin (IVIG) between 2015 to 2019 across the U.S. and studied the monthly diagnosisof KD by age group and geographic location. We evaluated the use of adjunctive therapies, including patients with giant coronary artery aneurysm (gCAA) who were treated with systemic anticoagulation after IVIG treatment. Results: We identified 8,037 acute KD patients in 45 hospitals. The seasonal cycle of patients ≤ 6 months old differed from other age groups, with regional variability noted between the Western and Southern U.S. The rate of adjunctive therapy use ranged from 14.8% - 85.6% at individual hospitals. There was significant variability in the choice of adjunctive agents, with regional differences in the use of corticosteroids and infliximab. There were 138 patients with gCAA (1.7%), of whom 42 (30.4%) received no additional anti-inflammatory therapy beyond IVIG, despite 26.8% of these aneurysms being present at the time of diagnosis. Conclusions: Distinct temporal signatures of KD diagnosis across age groups suggest different age-related mechanisms of exposure. Significant practice variation exists in the use of adjunctive therapy in KD patients with and without gCAA. Future head-to-head comparisons of adjunctive agents in high-risk patients will be necessary to guide best practice.
Ensemble datasets are ever more prevalent in various scientific domains. In climate science, ensemble datasets are used to capture variability in projections under plausible future conditions including greenhouse and aerosol emissions. Each ensemble model run produces projections that are fundamentally similar yet meaningfully distinct. Understanding this variability among ensemble model runs and analyzing its magnitude and patterns is a vital task for climate scientists. In this paper, we present ClimateSOM, a visual analysis workflow that leverages a self-organizing map (SOM) and Large Language Models (LLMs) to support interactive exploration and interpretation of climate ensemble datasets. The workflow abstracts climate ensemble model runs - spatiotemporal time series - into a distribution over a 2D space that captures the variability among the ensemble model runs using a SOM. LLMs are integrated to assist in sensemaking of this SOM-defined 2D space, the basis for the visual analysis tasks. In all, ClimateSOM enables users to explore the variability among ensemble model runs, identify patterns, compare and cluster the ensemble model runs. To demonstrate the utility of ClimateSOM, we apply the workflow to an ensemble dataset of precipitation projections over California and the Northwestern United States. Furthermore, we conduct a short evaluation of our LLM integration, and conduct an expert review of the visual workflow and the insights from the case studies with six domain experts to evaluate our approach and its utility.
Seasonal precipitation over the Southwestern United States (SWUS) has been historically linked to Equatorial Pacific Sea Surface Temperature (SST) anomalies associated with El Niño–Southern Oscillation (ENSO) phases. However, the strength and spatial expression of this teleconnection vary over time, and ENSO does not always produce the expected canonical precipitation response. Precipitation anomalies opposite to those predicted by the canonical ENSO signal are referred to as heretical; atmospheric rivers play an important role in these unexpected outcomes. This study evaluates how well CMIP6 models represent the historical ENSO-SWUS precipitation teleconnection (ESP Teleconnection) and explores its possible future variability under climate change. Using observations and CMIP6 simulations, we analyze correlations between December Niño3.4 SST anomalies and January–March precipitation. The temporal variability of the ESP Teleconnection is examined based on 31-year running window correlations and compared with stochastic envelopes derived from synthetic time series. Observations show that the ESP Teleconnection operates intermittently, being strongest around 1970–2000, weakest before 1950, and weakening again in recent decades, consistent with stochastic sampling variability. CMIP6 models reproduce a wide range of ESP Teleconnection strengths, within the stochastic variability envelopes, but most simulations overrepresent the canonical ENSO influence on SWUS precipitation. Although heretical winters might be underrepresented in models, their occurrence, as in observations, is often associated with anomalous atmospheric river activity. Future projections do not indicate a robust strengthening or weakening of the ESP Teleconnection across models; even models that capture the observed range of historical variability show divergent futures.
California’s large urban populations and valuable agricultural sectors are increasingly vulnerable to intensifying droughts driven by climate variability and change. Droughts are typically assessed in a sector-specific manner, with meteorological drought indices applied to urban systems and soil moisture-based indices used for agricultural impacts. However, meteorological and agricultural droughts are interconnected in space and time through soil moisture dynamics, which are critical to understand for effective cross-sector water management and climate change adaptation. We quantify meteorological drought using the Standardized Precipitation Index (SPI) and agricultural drought using the Standardized Soil Moisture Index (SSMI). We evaluate Coupled Model Intercomparison Project Phase 6 (CMIP6) and Variable Infiltration Capacity (VIC) modeled historical (1950-2014) and projected (2015 - 2100) drought across California, with emphasis on spring and summer months, when drought impacts are most acute across both urban and agricultural systems. We examine compound drought as the co-occurrence of meteorological and agricultural drought, represented by the SPI and SSMI, respectively, to identify periods when both conditions overlap and intensify and to assess how the frequency, severity, and temporal alignment of their joint occurrence change over time. This work introduces a novel conceptualization of compound drought as joint susceptibility to soil moisture-mediated meteorological and agricultural droughts impacting urban and agricultural sectors with connected water supply sources and thus compound risk.
In spite of forecasts for anomalous dryness based on the canonical La Niña signal, Water Years 2011, 2017, and 2023 brought copious precipitation to California and the Southwestern United States (SWUS). Although El Niño–Southern Oscillation (ENSO) is the main source of seasonal precipitation predictability for the region, outstanding Atmospheric River (AR) activity produced the unexpected regional wetness in each of these heretical water years (WYs). We define heretical WYs as those that result in precipitation anomalies that oppose those expected based on ENSO canon. We assess the contribution of ARs and other storms to these WYs, finding that heretical La Niña/El Niño WYs were characterized by anomalously robust/deficient AR activity. In California, precipitation accumulation during the heretical La Niña WYs was comparable to or even exceeded that observed during the exceedingly wet WY1998—the textbook canonical El Niño year. Our findings indicate a weaker/stronger relationship between ENSO and AR/non-AR precipitation, primarily driven by storm frequency. Although ARs can disrupt the ENSO-precipitation signal, ENSO still influences the frequency of AR precipitation in the southwestern U.S. desert, the region influenced by ARs that make landfall in Baja California, Mexico. These results highlight the complexity of ENSO's impact on precipitation in the Western US and underscore the need for a nuanced understanding of ENSO’s influence on ARs to improve seasonal precipitation prediction.
Urban firestorms are a growing hazard in fire-prone regions worldwide due to increasingly dry vegetation and expanding populations at the wildland-urban interface. In January 2025, the city of Los Angeles, California (USA), experienced an unprecedented fire disaster that destroyed over 16,000 structures and caused 31fatalities. The event was driven by a rare “jet-forced Santa Ana” wind subtype featuring an amplified upper-level ridge over the West Coast and retrograding trough over the central/eastern U.S., producing extreme northerly flow, large-scale subsidence, and mountain wave activity that impeded aerial fire suppression. While the extreme surface winds were not unprecedented, their occurrence ahead of the first winter rain was uncommon. Despite accurate multi-day forecasts, response systems were overwhelmed. Our analysis shows how upper-level atmospheric support can drive surface fire weather, compounding hazard in even well-developed areas. This underscores the importance of aligning long-range prediction with operational preparedness and communication strategies in California’s variable hydroclimate.
California experienced a historic run of nine consecutive landfalling atmospheric rivers (ARs) in three weeks' time during winter 2022/23. Following three years of drought from 2020 to 2022, intense landfalling ARs across California in December 2022-January 2023 were responsible for bringing reservoirs back to historical averages and producing damaging floods and debris flows. In recent years, the Center for Western Weather and Water Extremes and collaborating institutions have developed and routinely provided to end users peer-reviewed experimental seasonal (1-6 month lead time) and subseasonal (2-6 week lead time) prediction tools for western U.S. ARs, circulation regimes, and precipitation. Here, we evaluate the performance of experimental seasonal precipitation forecasts for winter 2022/23, along with experimental subseasonal AR activity and circulation forecasts during the December 2022 regime shift from dry conditions to persistent troughing and record AR-driven wetness over the western United States. Experimental seasonal precipitation forecasts were too dry across Southern California (likely due to their overreliance on La Nina), and the observed above-normal precipitation across Northern and Central California was underpredicted. However, experimental subseasonal forecasts skillfully captured the regime shift from dry to wet conditions in late December 2022 at 2-3 week lead time. During this time, an active MJO shift from phases 4 and 5 to 6 and 7 occurred, which historically tilts the odds toward increased AR activity over California. New experimental seasonal and subseasonal synthesis forecast products, designed to aggregate information across institutions and methods, are introduced in the context of this historic winter to provide situational awareness guidance to western U.S. water managers.
Background Autumn and winter Santa Ana Winds (SAW) are responsible for the largest and most destructive wildfires in southern California. Aims (1) To contrast fires ignited on SAW days vs non-SAW days, (2) evaluate the predictive ability of the Canadian Fire Weather Index (CFWI) for these two fire types, and (3) determine climate and weather factors responsible for the largest wildfires. Methods CAL FIRE (California Department of Forestry and Fire Protection) FRAP (Fire and Resource Assessment Program) fire data were coupled with hourly climate data from four stations, and with regional indices of SAW wind speed, and with seasonal drought data from the Palmer Drought Severity Index. Key results Fires on non-SAW days were more numerous and burned more area, and were substantial from May to October. CFWI indices were tied to fire occurrence and size for both non-SAW and SAW days, and in the days following ignition. Multiple regression models for months with the greatest area burned explained up to a quarter of variation in area burned. Conclusions The drivers of fire size differ between non-SAW and SAW fires. The best predictor of fire size for non-SAW fires was drought during the prior 5 years, followed by a current year vapour pressure deficit. For SAW fires, wind speed followed by drought were most important.
A new set of CMIP6 data downscaled using the localized constructed analogs (LOCA) statistical method has been produced, covering central Mexico through southern Canada at 6-km resolution. Output from 27 CMIP6 Earth system models is included, with up to 10 ensemble members per model and 3 SSPs (245, 370, and 585). Improvements from the previous CMIP5 downscaled data result in higher daily precipitation extremes, which have significant societal and eco-nomic implications. The improvements are accomplished by using a precipitation training dataset that better represents daily extremes and by implementing an ensemble bias correction that allows a more realistic representation of extreme high daily precipitation values in models with numerous ensemble members. Over southern Canada and the CONUS ex-clusive of Arizona (AZ) and New Mexico (NM), seasonal increases in daily precipitation extremes are largest in winter (-25% in SSP370). Over Mexico, AZ, and NM, seasonal increases are largest in autumn (-15%). Summer is the outlier season, with low model agreement except in New England and little changes in 5-yr return values, but substantial increases in the CONUS and Canada in the 500-yr return value. One-in-100-yr historical daily precipitation events become substan-tially more frequent in the future, as often as once in 30-40 years in the southeastern United States and Pacific Northwest by the end of the century under SSP 370. Impacts of the higher precipitation extremes in the LOCA version 2 downscaled CMIP6 product relative to the LOCA downscaled CMIP5 product, even for similar anthropogenic emissions, may need to be considered by end-users.
The Sierra Nevada and Southern Cascades—California’s snowy mountains—are primary freshwater sources and natural reservoirs for the states of California and Nevada. These mountains receive precipitation overwhelmingly from wintertime storms including atmospheric rivers (ARs), much of it falling as snow at the higher elevations. Using a seven-decade record of daily observed temperature and precipitation as well as a snow reanalysis and downscaled climate projections, we documented historical and future changes in snow accumulation and snowlines. In four key subregions of California’s snowy mountains, we quantified the progressing contribution of ARs and non-AR storms to the evolving and projected snow accumulation and snowlines (elevation of the snow-to-rain transition), exploring their climatology, variability and trends. Historically, snow makes up roughly a third of the precipitation affecting California’s mountains. While ARs make up only a quarter of all precipitating days and, due to their relative warmth, produce snowlines higher than do other storms, they contribute over 40% of the total seasonal snow. Under projected unabated warming, snow accumulation would decline to less than half of historical by the late twenty-first century, with the greatest snow loss at mid elevations (from 1500 to 3300 m by the mountain sub-regions) during fall and spring. Central and Southern Sierra Nevada peaks above 3400 m might see occasionally extreme snow accumulations in January–February resulting entirely from wetter ARs. AR-related snowlines are projected to increase by more than 700 m, compared to about 500 m for other storms. We discuss likely impacts of the changing climate for water resources as well as for winter recreation.
Abstract Low‐level stratiform clouds modulate California's coastal climate during the warm season. Previous work describing the seasonal and daily variability of coastal low cloudiness (CLC) suggests that in July, August, and September southern California's CLC is under the influence of an additional driver, which has less impact in northern California. In this work, we introduce the link in which free‐tropospheric moisture dictated by North American Monsoon (NAM) processes can impact southern California CLC. We use in situ and remote sensing observations, as well as reanalysis and single column model simulations to identify and investigate this previously missing component. We find that monsoonal moisture advected by southeasterly flow from the core NAM region into southern California reduces CLC by diminishing cloud‐top longwave cooling. To add to an already complex brew of known factors influencing coastal cloudiness, another one is hereby introduced and should be accounted for in future work.
The growing season start and duration, along with other temperature-related measures of importance to premium wine grapes in Napa Valley, California have changed as climate over the western United States has warmed. The growing season start has varied from year to year with a standard deviation of about 3 weeks, but over the 1958-2016 record a linear fit to the time sequence shows it advanced by more than 4 weeks. Over the study period, advances in the growing season were strongly influenced by temperature increases beginning in the late 1960s with warm anomalies generally persisting through recent years. The date upon which the growing season accumulated 1400 growing degree-days also shifted earlier by about 4 weeks. Other measures swung to a warmer status, including the mean temperature of the last 45 days of the growing season, which warmed by over 1.5 & DEG;C. Warming days and especially warming nights contributed to the growing season advance as well as trends towards warmer expressions of other viticultural measures. Years with earlier and warmer growing seasons experienced a substantial reduction in the number of daily cool extremes, and an increase in daily warm extremes, including the number of days whose temperature reaches or exceeds 35 & DEG;C.
Over the past four decades, annual area burned has increased significantly in California and across the western USA. This trend reflects a confluence of intersecting factors that affect wildfire regimes. It is correlated with increasing temperatures and atmospheric vapour pressure deficit. Anthropogenic climate change is the driver behind much of this change, in addition to influencing other climate-related factors, such as compression of the winter wet season. These climatic trends and associated increases in fire activity are projected to continue into the future. Additionally, factors related to the suppression of the Indigenous use of fire, aggressive fire suppression and, in some cases, changes in logging practices or fuel management intensity, collectively have produced large build-ups of vegetative fuels in some ecosystems. Human activities provide the most common ignition source for California's wildfires. Despite its human toll, fire provides a range of ecological benefits to many California ecosystems. Given the diversity of vegetation types and fire regimes found in the state, addressing California's wildfire challenges will require multi-faceted and locally targeted responses in terms of fuel management, human-caused ignitions, building regulations and restrictions, integrative urban and ecosystem planning, and collaboration with Tribes to support the reinvigoration of traditional burning regimes.
Rainfall in southern California is highly variable, with some fluctuations explainable by climate patterns. Resulting runoff and heightened streamflow from rain events introduces freshwater plumes into the coastal ocean. Here we use a 105-year daily sea surface salinity record collected at Scripps Pier in La Jolla, California to show that El Niño Southern Oscillation and Pacific Decadal Oscillation both have signatures in coastal sea surface salinity. Averaging the freshest quantile of sea surface salinity over each year’s winter season provides a useful metric for connecting the coastal ocean to interannual winter rainfall variability, through the influence of freshwater plumes originating, at closest, 7.5 km north of Scripps Pier. This salinity metric has a clear relationship with dominant climate phases: negative Pacific Decadal Oscillation and La Niña conditions correspond consistently with lack of salinity anomaly/ dry winters. Fresh salinity anomalies (i.e., wet winters) occur during positive phase Pacific Decadal Oscillation and El Niño winters, although not consistently. This analysis emphasizes the strong influence that precipitation and consequent streamflow has on the coastal ocean, even in a region of overall low freshwater input, and provides an ocean-based metric for assessing decadal rainfall variability.
Assessments of the potential responses of animal species to climate change often rely on correlations between long-term average temperature or precipitation and species’ occurrence or abundance. Such assessments do not account for the potential predictive capacity of either climate extremes and variability or the indirect effects of climate as mediated by plant phenology. By contrast, we projected responses of wildlife in desert grasslands of the southwestern United States to future climate means, extremes, and variability and changes in the timing and magnitude of primary productivity. We used historical climate data and remotely sensed phenology metrics to develop predictive models of climate-phenology relations and to project phenology given anticipated future climate. We used wildlife survey data to develop models of wildlife-climate and wildlife-phenology relations. Then, on the basis of the modeled relations between climate and phenology variables, and expectations of future climate change, we projected the occurrence or density of four species of management interest associated with these grasslands: Gambel’s Quail ( Callipepla gambelii ), Scaled Quail ( Callipepla squamat ), Gunnison’s prairie dog ( Cynomys gunnisoni ), and American pronghorn ( Antilocapra americana ). Our results illustrated that climate extremes and plant phenology may contribute more to projecting wildlife responses to climate change than climate means. Monthly climate extremes and phenology variables were influential predictors of population measures of all four species. For three species, models that included climate extremes as predictors outperformed models that did not include extremes. The most important predictors, and months in which the predictors were most relevant to wildlife occurrence or density, varied among species. Our results highlighted that spatial and temporal variability in climate, phenology, and population measures may limit the utility of climate averages-based bioclimatic niche models for informing wildlife management actions, and may suggest priorities for sustained data collection and continued analysis.
Three generations of global climate models (GCMs), Coupled Model Intercomparison Project version 3 (CMIP3), CMIP5, and CMIP6, are evaluated for performance simulating seasonal mean and annual‐to‐decadal variability of temperature and precipitation in the Upper Colorado River Basin. Low‐frequency precipitation variability associated with drought is a particular focus and found to be a significant model shortcoming. The evaluation includes remote teleconnected atmospheric responses to the Pacific Ocean, including the El Niño/Southern Oscillation and Pacific Decadal Oscillation. GCMs have improved their simulation of the Upper Basin over model generations, but primarily in atmospheric circulation metrics. Persistent winter precipitation biases have changed little, including in multiyear precipitation variability. Users generally bias‐corrected GCM data before use; evaluation using a simple spatially and temporally averaged bias correction shows that the CMIP6 models outperform earlier generations after the bias correction, although more complex precipitation biases remain even after the simple bias correction. These model rankings will be useful when selecting GCMs for a variety of hydrological and ecological climate studies in the Upper Basin.
Atmospheric rivers (ARs) generate most of the economic losses associated with flooding in the western United States and are projected to increase in intensity with climate change. This is of concern as flood damages have been shown to increase exponentially with AR intensity. To assess how AR-related flood damages are likely to respond to climate change, we constructed county-level damage models for the western 11 conterminous states using 40 years of flood insurance data linked to characteristics of ARs at landfall. Damage functions were applied to 14 CMIP5 global climate models under the RCP4.5 “intermediate emissions” and RCP8.5 “high emissions” scenarios, under the assumption that spatial patterns of exposure, vulnerability, and flood protection remain constant at present day levels. The models predict that annual expected AR-related flood damages in the western United States could increase from $1 billion in the historical period to $2.3 billion in the 2090s under the RCP4.5 scenario or to $3.2 billion under the RCP8.5 scenario. County-level projections were developed to identify counties at greatest risk, allowing policymakers to target efforts to increase resilience to climate change.
Background California’s South Coast has experienced peak burned area in autumn. Following typically dry, warm summers, precipitation events and Santa Ana winds (SAWs) each occur with increasing frequency from autumn to winter and may affect fire outcomes. Aims We investigate historical records to understand how these counteracting influences have affected fires. Methods We defined autumn precipitation onset as the first 3 days when precipitation ≥8.5 mm, and assessed how onset timing and SAWs were associated with frequency of ≥100 ha fires and area burned during 1948–2018. Key results Timing of autumn precipitation onset had negligible trend but varied considerably from year to year. A total of 90% of area burned in autumn through winter occurred from fires started before onset. Early onset autumns experienced considerably fewer fires and area burned than late onset autumns. SAWs were involved in many of the large fires before onset and nearly all of the lesser number after onset. Conclusions Risk of large fires is reduced after autumn precipitation onset, but may resurge during SAWs, which provide high risk weather required to generate a large fire. Implications During autumn before onset, and particularly during late onset autumns, high levels of preparation and vigilance are needed to avoid great fire impacts.
Autumn and winter Santa Ana wind (SAW)-driven wildfires play a substantial role in area burned and societal losses in southern California. Temperature during the event and antecedent precipitation in the week or month prior play a minor role in determining area burned. Burning is dependent on wind intensity and number of human-ignited fires. Over 75% of all SAW events generate no fires; rather, fires during a SAW event are dependent on a fire being ignited. Models explained 40 to 50% of area burned, with number of ignitions being the strongest variable. One hundred percent of SAW fires were human caused, and in the past decade, powerline failures have been the dominant cause. Future fire losses can be reduced by greater emphasis on maintenance of utility lines and attention to planning urban growth in ways that reduce the potential for powerline ignitions.
 Michael D. Dettinger (Michael Dettinger)合作论文数Department of Geography, Mackay School of Geosciences and Engineering, University of Nevada, Reno139David Pierce合作论文数Division of Climate, Atmospheric Sciences, and Physical Oceanography, Scripps Institution of Oceanography54
 Alexander Gershunov合作论文数Geography Department;University of California , Santa Barbara;Geography Department, University of California , Santa Barbara51
 Tapash Das合作论文数Scripps Institution of Oceanography, La Jolla, CA, USA47
 Hugo Hidalgo合作论文数Scripps Institution of Oceanography;University of California San Diego;Scripps Institution of Oceanography, University of California San Diego30Mary Tyree合作论文数26
 Edwin P. Maurer合作论文数Department of Civil, Environmental and Sustainable Engineering, School of Engineering, Santa Clara University26
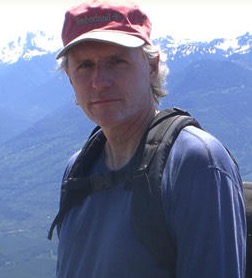 David Peterson合作论文数School of Environmental and Forest Sciences, College of Forest Resources, University of Washington21
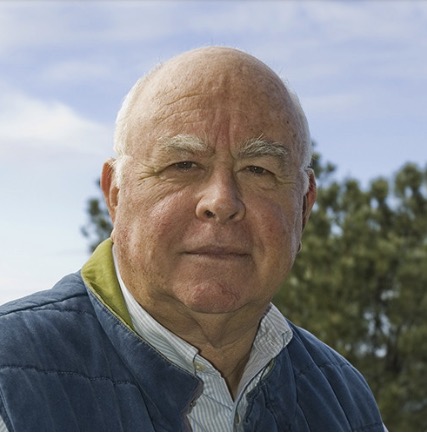 Tim Barnett合作论文数Scripps Institution of Oceanography, University of California San Diego18Noah Knowles合作论文数U. S. Geological Survey18Sam F. Iacobellis合作论文数17
 Jessica D. Lundquist合作论文数Department of Civil & Environmental Engineering, University of Washington16Kelly T. Redmond合作论文数16
 Celine J. W Bonfils合作论文数Lawrence Livermore National Laboratory14
 Fred Martin Ralph合作论文数Center for Western Weather and Water Extremes, Scripps Institution of Oceanography, University of California14
 Peter Bromirski合作论文数Scripps Institution of Oceanography, University of California, San Diego13Warren B White合作论文数Scripps Institution of Oceanography, University of California, San Diego13
 Art Miller合作论文数Scripps Institution of Oceanography, University of California, San Diego12Guido Franco合作论文数11
 Michael J. DeFlorio合作论文数Univ Calif San Diego, Scripps Inst Oceanog, Ctr Western Weather & Water Extremes, La Jolla, CA 92093 USA10
 Konstantine Georgakakos合作论文数Hydrologic Research Center;Scripps Institution of Oceanography, University of California, San Diego10
 Iris Stewart-Frey合作论文数Department of Environmental Studies and Sciences, College of Arts and Sciences, Santa Clara University10Kristen Guirguis合作论文数Climate, Atmospheric Science and Physical Oceanography (CASPO) Research Division, Center for Western Weather and Water Extremes (CW3E), Scripps Institution of Oceanography, University of California, San Diego, 9500 Gilman Drive, 92093, La Jolla, CA, USA10
 Benjamin David Santer (Benjamin D. Santer)合作论文数Lawrence Livermore National Laboratory, University of California10
 A. Le Roy Westerling合作论文数Sierra Nevada Research Institute, University of California, Merced;Department of Management of Complex Systems, University of California, Merced9Masao Kanamitsu合作论文数9Reinhard E Flick合作论文数Scripps Institution of Oceanography, University of California San Diego9
 Allen B. White合作论文数Physical Sciences Division (PSD), NOAA Earth System Research Laboratory9Laurence G. Riddle合作论文数8
 Kei Yoshimura (芳村圭)合作论文数Institute of Industrial Science, The University of Tokyo;Atmosphere and Ocean Research Institute, The University of Tokyo;Department of Human and Social Systems, The University of Tokyo8Katharine Hayhoe合作论文数8Rachel E. S. Clemesha合作论文数Scripps Inst Oceanog, Univ Calif San Diego7
 Jane Burns合作论文数Harvard Chan-NIEHS Center for Environmental Health, Harvard T.H. Chan School of Public Health, Harvard University;Department of Environmental Health, Harvard T.H. Chan School of Public Health, Harvard University7
 Andy Wood合作论文数National Center for Atmospheric Research7G. Bala合作论文数6Julie F. Kalansky合作论文数6
 Thomas W. Corringham合作论文数Univ Calif San Diego, Scripps Inst Oceanog, Ctr Western Weather & Water Extremes, La Jolla, CA 92093 USA6
 Edwin Sumargo合作论文数Ctr Western Weather & Water Extremes, Univ Calif San Diego6
 Susanne C. Moser合作论文数Aspen Global Change Institute;Susanne Moser Research & Consulting;Environmental Studies Department, Antioch University New England;Department of Landscape Architecture and Regional Planning, University of Massachusetts-Amherst6
 Franco Biondi合作论文数Department of Natural Resources and Environmental Sciences, College of Agriculture & Biotechnology and Natural Sciences, University of Nevada6
 Malcolm Hughes合作论文数School of Renewable Natural Resources, The University of Arizona;College of Science, The University of Arizona6
 Philip B. Duffy合作论文数Atmospheric Science Division;Lawrence Livermore National Labora;Atmospheric Science Division, Lawrence Livermore National Labora6Nicholas E. Graham合作论文数6Laurence E. Schemel合作论文数6Emelia Bainto合作论文数5F. Martin Ralph合作论文数5Adriana H Tremoulet合作论文数5Dh Peterson合作论文数5Tamara Shulgina合作论文数Ctr Western Weather & Water Extremes, Univ Calif San Diego5




