Climate change and associated sea-level rise (SLR) threaten rocky intertidal environments. The coarse temporal and spatial resolution of currently used field methods limit their use for studying SLR effects on rocky intertidal zones. Uncrewed aircraft systems (UAS), light detection and ranging (LiDAR), and structure from motion (SfM) photogrammetry offer options for comprehensive mapping and monitoring from a novel perspective and scale. We collected, processed and analysed UAS LiDAR and SfM photogrammetry datasets for three Multi-Agency Rocky Intertidal Network (MARINe) biological monitoring sites in Laguna Beach, California. Orthomosaics, point clouds, and digital surface models (DSM) were analysed and compared to assess the potential for UAS LiDAR and SfM technologies for monitoring rocky intertidal zones. The resultant data products are similar; the SfM products yield greater point density for DSM and slightly finer spatial resolution for orthoimage mosaics. Both approaches were useful in mapping intertidal substrates, zonation patterns, and barriers to sea-level rise, and in identifying several species monitored by MARINe. Work remains in SLR inundation modelling and in addressing the impacts of wave action and tides, and difficulty in image matching in optically homogenous areas.
Portions of Southern California's native shrubland communities are being invaded and sometimes replaced by herbaceous vegetation that increases the risk of wildfire ignition and spread in a positive feedback loop called the grass-fire cycle. The objective of this study was to assess the extent to which herbaceous cover has expanded and replaced woody vegetation over the last three decades in San Diego County shrublands. To do this, we reconstructed the spatial-temporal distribution of herbaceous growth form cover using spectral mixture analysis (SMA) applied to Landsat multispectral data from 1988 to 2020. The average error in herbaceous cover maps generated from images captured during four single years within the 33-year study period exhibited a mean absolute error (MAE) = 13.30%, root mean square error (RMSE) = 17.62%, and coefficient of determination (R-2) = 0.76 relative to reference data derived from orthoimagery. Error estimates for absolute change in herbaceous cover from the earliest (1988) and recent (2020) dates were MAE = 12.17% and RMSE = 15.57% (assessed using 94 reference sampling grids). Between 1988 and 2020, 26.61% of the full study area exhibited an increase in herbaceous cover >20% and 4.98% experienced a decrease in herbaceous cover <-20%, with the greatest concentration of change occurring in wildland-urban interface (WUI) areas. The factors most strongly associated with a substantial increase in herbaceous cover included fire return interval, drought, proximity to development, and elevation. In addition to the overall expansion of herbaceous cover, we also identified locations with evidence of vegetation-type conversion from woody- to herbaceous-dominated fractional cover. These results suggest that a grass-fire cycle has been established in Southern California. The methods from this work can be applied to Mediterranean-type ecosystems around the world to quantify and monitor herbaceous vegetation change over time.
Portions of Southern California's native shrubland communities are being replaced by invasive herbaceous vegetation. These non-native species can increase the risk of wildfire ignition and spread. Expansion of these competitive invasive species in recently burned areas following a wildfire can lead to complete conversion and replacement of native shrubs and trees, which in turn increases the likelihood of future wildfire that spreads rapidly and widely through a positive feedback loop: the grass-fire cycle. Despite the association between herbaceous abundance and wildfire risk, image processing approaches for identification and quantification of fractional herbaceous cover in Southern California shrublands are not well established. The objective of this study is to comparatively assess the accuracy of herbaceous cover estimation and mapping based on three different unmixing models applied to Landsat multispectral data for San Diego County, U.S.A. during 2020. The models included: spectral mixture analysis (SMA) using a single set of spectral endmembers; multiple endmember SMA (MESMA); and temporal mixture model (TMM) analysis of year-long stacks of spectral indices computed from multiple Landsat acquisitions. Feature inputs included single date, multi-date, and spectral reflectance and spectral vegetation index (normalized difference infrared index (NDII) and normalized difference vegetation index (NDVI)) combinations. When compared to reference data generated from aerial imagery, results demonstrated that SMA applied to a date during the summer season (August) estimated unburned and intact herbaceous cover most accurately (mean absolute error (MAE), root mean square error (RMSE), and coefficient of determination (R2) values of 8.85%, 12.02%, and 0.85, respectively). Therefore, Landsat unmixing model results suggest that mapping, reconstructing, and monitoring of herbaceous cover at the 10% accuracy level is appropriate. These methods will enable improved detection of sensitive habitats in Mediterranean-type ecosystems around the world by satellite for wildfire-prone communities and identify target areas for monitoring and mitigating the grass-fire cycle.
In this study, we investigated the influence of pre-fire tree mortality on fire behavior. Although other studies have focused on the environmental factors affecting wildfire, the influence of pre-fire tree mortality has not been explored in detail. We used high-spatial-resolution (1.6 m) airborne multispectral orthoimages to detect and map pre-fire dead trees in a portion of the San Bernardino Mountains, where the ‘Old Fire’ burned in 2003, and assessed whether spatial patterns of fire intensity and burn severity coincide with patterns of tree mortality. Dead trees were mapped through a hybrid deep learning classification and manual editing approach and facilitated with Google Earth Pro historical images. Apparent thermal infrared (TIR) brightness temperature captured during the Old Fire was derived from maximum digital number values from FireMapper airborne thermal infrared imagery (7 m) as a measure of fire intensity. Burn severity was analyzed using normalized burn ratio maps derived from pre- and post-fire Landsat 5 satellite imagery (30 m). Pre-fire dead trees were prevalent with 192 dead trees and 108 live trees per ha, with most dead trees clustered near the northwestern part of the study area east of Lake Arrowhead. The degree of spatial correspondence among dead tree density, fire intensity, and burn severity was analyzed using graphical and statistical analyses. The results revealed a significant but weak spatial association of dead trees with fire intensity (R2 = 0.31) and burn severity (R2 = 0.14). The findings revealed that areas impacted by pre-fire tree mortality were subject to higher fire intensity, followed by severe burn effects, though other biophysical factors also influenced these fire behavior variables. These results contradict a previous study that found no effect of tree mortality on the behavior of the Old Fire.
With traditional survey methods such as ground-based counting, camera trapping, and aerial surveys, monitoring wild deer in Nepal's Chitwan National Park is challenging due to the dense tall vegetation that often conceals them. However, the thermal signatures of wild deer contrast sharply against the cooler background, facilitating detection via thermal imaging. This study explores the use of Unmanned Aerial Vehicles (UAVs) equipped with thermal cameras to monitor wild deer. A large volume of images can be captured, where wild animals appear as small objects. Reviewing these images manually is labor-intensive and time-consuming. To address this, we developed an object detection model using modified Faster R-CNN that automatically identifies small deer objects in the thermal images. Instead of VGG 16, the Feature Pyramid Network and Residual Neural Network (ResNet152) were employed to enhance feature extraction from these images, constructing multi-scale feature maps that enrich the feature information for small object detection. Customized anchor boxes were also designed to handle the wide variation in object scale and aspect ratios. To improve species identification accuracy for small Regions of Interest, a multi-scale aggregation method was proposed, which fuses features from multiple feature maps via Multi-scale RoIAlign pooling. The model proposed in this paper was evaluated by the COCO metrics. The experimental results obtained for the detection of deer and other animals in UAV thermal images with the resolution of 640× 512 , showing mean Average Precision of 92.3
Accurate representation of the location and amount of burned areas is vital to the understanding of patterns and impacts of fires. Some extant burned area maps appear to have high commission errors, which lead to an overrepresentation of burned area. The primary research objective of this study was to assess whether region-specific training data used for machine learning routines improve accuracy of burned area products for western San Diego County. We used training data derived from fine-scale aerial orthoimagery to create and compare three training sets, each with a different Landsat scale sub-pixel burn threshold: 20%, 50%, or 80%. Meaning either 20%, 50%, or 80% of a 30 m x 30 m pixel had to burn for the entire pixel to be classified as burned. High-resolution orthoimagery was used for the creation of the training/testing data as well as determining which sub-pixel threshold leads to more accurate burned area representation. These training data were input into a gradient-boosted regression model. We compared the burned area product from the region-specific gradient boosted model (L-GBRM) to the three products: Monitoring Trends in Burn Severity, Fire and Resource Assessment Program, and the Landsat Burned Area product. We found >20% sub-pixel burn threshold of a Landsat pixel yielded the most accurate classification results. We used a 50% sub-pixel burn threshold for the reference data to compare the results to since the burned area associated with it is closely aligned with the high-resolution orthoimagery determined burn area. The L-GBRM was the most accurate product while also mapping the smallest area burned, suggesting that the extant products have relatively high commission errors. Using region-specific training data achieved a higher accuracy than nationwide training data. Looking at sub-pixel burn thresholds for creating a burned area map could prove to make a more accurate map in terms of area burned represented.
Studies on estimating cumulative fire intensity from spreading wildland fires based on fire radiative energy density (FRED) have primarily been conducted through controlled experiments. The objective of this study was to assess the potential for estimating FRED for freely-burning wildfires at landscape scales. Airborne thermal infrared image sequences collected 8 and 9 December 2017 during the Thomas Fire were used for surface temperature derivation and FRED estimation. Sensitivity of varying ambient temperatures, and a newly developed method that adjusts for ash radiances on fire radiative flux density (FRFD) and FRED estimates were tested. Pixel-level image classification was run to identify FRFD time sequences that were complete or incomplete because of cloud obscuration and provided the basis for an obscuration gap filling technique. Variations in estimated ambient temperature used to estimate FRFD had little impact on FRED estimates, while our ash adjustment led to notable differences. An exponential decay model characterized FRFD time sequences well, providing a basis for gap filling irregular sequences caused by atmospheric obscuration. FRED estimates were regressed on rate of spread (ROS) magnitudes and found to be positively and significantly correlated. FRED magnitudes were higher on 9 December when the Thomas Fire burned under higher wind speeds and lower relative humidity levels (Santa Ana weather conditions) than on 8 December.
Concurrently implemented green initiatives to combat global environmental crises may be curtailed or even sacrificed given the ongoing global economic contraction. We collected empirical data and information about green initiatives from 15 sites or countries worldwide. We systematically explored how specific policy, intended behaviors, and gains of given green initiative may interact with those of other green initiatives concurrently implemented in the same geographic area or involving the same recipients. Surprisingly, we found that spillover effects were very divergent: one initiative could reduce the gain of another by 22 % similar to 100 %, representing alarming losses, while in other instances, substantial co -benefits could arise as one initiative can increase the gain of another by 9 % similar to 310 %. Leveraging these effects will help countries keep green initiatives with significant co benefits but stop initiatives with substantial spillover losses in the face of widespread budget cuts, better meeting the United Nations ' sustainable development goals.
Deer surveys play an important role in the estimation of local ecological balance. In the Chitwan National Park of Nepal, the dense tree canopies and tall vegetation often obscure the presence of wild deer, which has a negative effect on the accurate population surveys of wild deer. UAVs equipped with infrared sensors have been increasingly used to monitor wild deer by capturing a lot of images. How to automatically recognize and obtain the number of deer objects from thermal images is becoming an important research topic. Due to the difference between thermal images and true-color images, as well as the variations in deer object sizes in these two types of images, current ready-to-use object detection models, designed for true-color imagery, are ill-suited for the task of detecting small deer objects within thermal imagery. In this paper, an enhanced Faster R-CNN was constructed to detect small deer objects from thermal images, in which a Feature Pyramid Network (FPN) based on a residual network is used to improve feature extraction for small deer objects and multi-scale feature map constrution for the subsequent region proposals searching, bounding box regression, and regions of interest (RoIs) classification. In addition, small-scaled anchor boxes and a multi-scale feature map selection criterion are devised to improve the detection accuracy of small objects. Finally, based on Faster R-CNN, FPN, and different residual networks including ResNet18, ResNet34, ResNet50, ResNet101, and ResNet152, we constructed five object detection models, and evaluated their detection performance by using COCO evaluation matrix. Under the condition of IoU >= 0.5, the integration of Faster R-CNN, FPN, and ResNet18 demonstrated to perform better than others. Specifically, The COCO evaluation results revealed an Average Precision (AP) score of 91.6% for all deer objects. Small deer objects (area <= 200 pixels) achieved an AP score of 73.6%, medium deer objects (200 < area <= 400 pixels) demonstrated an AP score of 93.4%, and large deer objects (area > 400 pixels) achieved the highest AP score of 94.3%. Our research is helpful for effective wild deer monitoring and conservation and can be a valuable reference for the exploration of small object detection from low-resolution thermal images.
The rapid expansion of cities and continuous urban population growth underscores a need for sustainable urban development. Sustainable development is that which addresses human needs, contributes to well-being, is economically viable, and utilizes natural resources at a degree sustainable by the surrounding environmental systems. Urban green spaces, green roofs, and solar panels are examples of environmentally sustainable urban development (ESUD), or development that focuses on environmental impact, but also presents the potential to achieve social and economic sustainability. The aim of this study was to map and compare amounts of ESUD c. 2010 and c. 2019 through an object-based image analysis (OBIA) approach using National Agricultural Imagery Program (NAIP) aerial orthoimagery for six mid- to large-size cities in the USA. The results of this study indicate a hybrid OBIA and manual interpretation approach applied to NAIP orthoimagery may allow for reliable mapping and areal estimation of urban green space and green roof changes in urban areas. The reliability of OBIA-only mapping and estimation of areal extents of existing green roofs, and new and existing solar panels, is inconclusive due to low mapping accuracy and coarse spatial resolution of aerial orthoimagery relative to some ESUD features. The three urban study areas in humid continental climate zones (Dfa) were estimated to have greater areal extent of new and existing urban green space and existing green roofs, but less areal extent of new green roofs and existing solar panels compared to the three study areas in humid subtropical climate zones (Cfa).
Geovisualization tools can supplement the statistical analyses of landscape-level wildfire behavior by enabling the discovery of nuanced information regarding the relationships between fire spread, topography, fuels, and weather. The objectives of this study were to develop and evaluate the effectiveness of geovisualization tools for analyzing wildfire behavior and specifically to apply those tools to study portions of the Thomas and Detwiler wildfire events that occurred in California in 2017. Fire features such as active fire fronts and rate of spread (ROS) vectors derived from repetitive airborne thermal infrared (ATIR) imagery sequences were incorporated into geovisualization tools hosted in a web geographic information systems application. This geovisualization application included ATIR imagery, fire features derived from ATIR imagery (rate of spread vectors and fire front delineations), growth form maps derived from NAIP imagery, and enhanced topographic rasters for visualizing changes in local topography. These tools aided in visualizing and analyzing landscape-level wildfire behavior for study portions of the Thomas and Detwiler fires. The primary components or processes of fire behavior analyzed in this study were ROS, spotting, fire spread impedance, and fire spread over multidirectional slopes. Professionals and researchers specializing in wildfire-related topics provided feedback on the effectiveness and utility of the geovisualization tools. The geovisualization tools were generally effective for visualizing and analyzing (1) fire spread over multidirectional slopes; (2) differences in spread magnitudes within and between sequences over time; and (3) the relative contributions of fuels, slope, and weather at any given point within the sequences. Survey respondents found the tools to be moderately effective, with an average effectiveness score of 6.6 (n = 5) for the visualization tools on a scale of 1 (ineffective) to 10 (effective) for postfire spread analysis and visualizing fire spread over multidirectional slopes. The results of the descriptive analysis indicate that medium- and fine-scale topographic features, roads, and riparian fuels coincided with cases of fire spread impedance and exerted control over fire behavior. Major topographic features such as ridges and valleys slowed, or halted, fire spread consistently between study areas. The relationships between spotting, fuels, and topography were inconclusive.
An important component of wildlife management and conservation is monitoring the health and population size of wildlife species. Monitoring the population size of an animal group can inform researchers of habitat use, potential changes in habitat and resulting behavioral adaptations, individual health, and the effectiveness of conservation efforts. Arboreal monkeys are difficult to monitor as their habitat is often poorly accessible and most monkey species have some degree of camouflage, making them hard to observe in and below the tree canopy. Surveys conducted using uninhabited aerial vehicles (UAVs) equipped with thermal infrared (TIR) cameras can help overcome these limitations by flying above the canopy and using the contrast between the warm body temperature of the monkeys and the cooler background vegetation, reducing issues with impassable terrain and animal camouflage. We evaluated the technical and procedural elements associated with conducting UAV-TIR surveys for arboreal and terrestrial macaque species. Primary imaging missions and analyses were conducted over a monkey park housing approximately 160 semi-free-ranging Japanese macaques (Macaca fuscata). We demonstrate Repeat Station Imaging (RSI) procedures using co-registered TIR image pairs facilitate the use of image differencing to detect targets that were moving during rapid sequence imaging passes. We also show that 3D point clouds may be generated from highly overlapping UAV-TIR image sets in a forested setting using structure from motion (SfM) image processing techniques. A point cloud showing area-wide elevation values was generated from TIR imagery, but it lacked sufficient point density to reliably determine the 3D locations of monkeys.
The application of ultra-high spatial resolution imagery from small unpiloted aerial systems (sUAS) can provide valuable information about the status of built infrastructure following natural disasters. This study employs three methods for improving the value of sUAS imagery: (1) repeating the positioning of image stations over time using a bi-temporal imaging approach called repeat station imaging (RSI) (compared here against traditional (non-RSI) imaging), (2) co-registration of bi-temporal image pairs, and (3) damage detection using Mask R-CNN, a convolutional neural network (CNN) algorithm applied to co-registered image pairs. Infrastructure features included roads, buildings, and bridges, with simulated cracks representing damage. The accuracies of platform navigation and camera station positioning, image co-registration, and resultant Mask R-CNN damage detection were assessed for image pairs, derived with RSI and non-RSI acquisition. In all cases, the RSI approach yielded the highest accuracies, with repeated sUAS navigation accuracy within 0.16 m mean absolute error (MAE) horizontally and vertically, image co-registration accuracy of 2.2 pixels MAE, and damage detection accuracy of 83.7% mean intersection over union.
Annual burned area has increased in California over the past three decades as a result of rising temperatures and a greater atmospheric demand for moisture, a trend that is projected to continue throughout the 21st century as a result of climate change. Here, we implement a bias-correction and statistical downscaling technique to obtain high resolution, daily meteorological conditions for input into two fire weather indices: vapor pressure deficit (VPD) and the Canadian Fire Weather Index System (FWI). We focus our analysis on 10 ecoregions that together account for the diverse range of climates, ecosystems, topographies, and vegetation types found across the state of California. Our results provide evidence that fire weather conditions will become more extreme and extend into the spring and fall seasons in most areas of California by 2100, extending the amount of time vegetation is exposed to increased atmospheric demand for moisture, and heightening the overall risk for the ignition and spread of large wildfire. The ecoregion-level spatial scale adopted for this study increases the spatial specificity of fire weather information, as well as the resolution with which fire and land managers can implement strategies and counter-measures when addressing issues related to climate change.
The extensive record of Landsat imagery is commonly used to map urban land-cover and land-use change. Random forest (RF) classification was applied for mapping more detailed urban land-use and change categories than is typically attempted with Landsat data. Two dates of Landsat imagery (1990 and 2015) were utilized with surface reflectance, Vegetation-Impervious-Soil (V-I-S) fractions, grey-level cooccurrence matrix (GLCM) of V-I-S, and temporal variation of V-I-S inputs. GLCM V-I-S and temporal variation of Vegetation as input features of RF classifiers slightly improved accuracies of land use maps. A change map derived from an overlay analysis between the 2015 map and a Landsat-derived urban expansion map was more accurate than one from post-classification comparison of 1990 and 2015 maps. For the Taiwan study area, Transportation Corridor land use tended to lead conversion to Residential and Employment types in relatively undeveloped districts, and extensive urban land-use change occurred in peri-urban areas.
Urban expansion is a form of land cover and land use change (LCLUC) that occurs globally, and population growth can be a driver of and be driven by LCLUC. Determining the cause–effect relationship is challenging because the temporal resolution of population data is limited by decadal censuses for most countries. The purpose of this study is to explore the relationship and relative timing between population change and land use change based on a case study of northern Taiwan from 1990 to 2015. A unique dataset on population was acquired from annually-updated governmental-based population registers maintained at the district level, and land-use expansion data (Residential, Employment, and Transportation Corridor categories) were derived from dense time series of Landsat imagery. Linear regression was applied to understand the general relationship between population and land use and their changes. The strongest relationships were found between population and areal extent of Residential land use, and between population change and Residential areal change. Lagged correlation analysis was implemented for identifying the time lag between population growth and land use change. Most districts exhibited Residential and Employment expansion prior to population growth, especially for districts in the periphery of metropolitan areas. Conversely, the core of metropolitan areas exhibited population growth prior to Residential and Employment expansion. Residential and Employment expansion were deemed to be drivers of population change, so population change was modeled with ordinary least square and geographically weighted regression with Residential and Employment expansion in both synchronized and time lag manners. Estimated population growth was found to be the most accurate when geographic differences and time lags from urban land use expansion were both incorporated.
Wildfire burn severity has important implications for postfire vegetation recovery and boundary-layer climate. We used a collection of Moderate Resolution Imaging Spectroradiometer (MODIS) datasets to investigate the impact of burn severity (relative differenced Normalized Burn Ratio, RdNBR) on vegetation recovery (Enhanced Vegetation Index, EVI), albedo change, and land surface temperature in seven California ecoregions, including: Southern California Mountains (SCM), Southern California Coast (SCC), Central California Foothills (CCF), Klamath (K), Cascades (C), Eastern Cascades (EC), and Sierra Nevada (SN). A statewide MODIS-derived RdNBR dataset was used to analyze the impact of burn severity on the five-year postfire early-summer averages of each biophysical variable between the years 2003-2020. We found that prefire EVI values were largest, and prefire albedo and temperature were lowest in the K, C, EC, and SN ecoregions. Furthermore, the largest changes between prefire and first-year postfire biophysical response tended to occur in the moderate and high burn severity classes across all ecoregions. First-year postfire albedo decreased in the K, C, EC, and SN but increased in the SCM, SCC, and CCF ecoregions. The greatest decreases, but most rapid recovery, of EVI occurred after high severity fires in all ecoregions. After five-years post-fire, EVI and land surface temperature did not return to prefire levels in any burn severity class in any ecoregion.
The objectives of this study were to evaluate spatial sampling and statistical aspects of landscape-level wildfire rate of spread (ROS) estimates derived from airborne thermal infrared imagery (ATIR). Wildfire progression maps and ROS estimates were derived from repetitive ATIR image sequences collected during the 2017 Thomas and Detwiler wildfire events in California. Three separate landscape sampling unit (LSU) sizes were used to extract remotely sensed environmental covariates known to influence fire behavior. Statistical relationships between fire spread rates and landscape covariates were analyzed using (1) bivariate regression, (2) multiple stepwise regression, (3) geographically weighted regression (GWR), (4) eigenvector spatial filtering (ESF) regression, (5) regression trees (RT), and (6) and random forest (RF) regression. GWR and ESF regressions reveal that relationships between covariates and ROS estimates are substantially non-stationary and suggest that the global association of fire spread controls are locally differentiated on landscape scales. Directional slope is by far the most strongly associated covariate of ROS for the imaging sequences analyzed and the size of LSUs has little influence on any of the covariate relationships.
In many terrestrial systems, indirect effects of predator presence on herbivores have been shown to have dramatic effects on vegetation consumption (Apfelbach et al., 2005; Borowski, 1998), with resulting behavioral changes rippling through the ecosystem (Ripple and Beschta, 2003).In addition to our main experiment, we incorporated predator cues from major predators of lemmings in order to examine the potential for indirect effects of predators on herbivory rates (Beckerman et al., 1997;Schmitz, 2005).These predators include the snowy owl, parasitic jaeger (arctic skua), arctic fox, and ermine (Fauteux et al., 2018a, b).In doing so, we wanted to better understand how the presence of predator cues could impact lemming behavior and thus impact vegetation.We predicted predator cues would elicit a fear response in the lemmings, therefore decreasing the time spent consuming vegetation and altering carbon cycling.
From a conservation perspective, quantifying potential refugial capacity has been predominantly focused on climate refugia, which is critical for maintaining the persistence of species and ecosystems. However, protection from other stressors, such as human-induced changes in fire and hydrology, that cause habitat loss, degradation, and fragmentation is also necessary to ensure that conservation efforts focused on climate are not undermined by other threats. Thus, conceptual and methodological advances for quantifying potential refugia from multiple anthropogenic stressors are important to support conservation efforts. We devised a new conceptual approach, the domains of refugia, for assessing refugial capacity that identifies areas where exposure to multiple stressors is low. In our framework, patterns of environmental variability (e.g., increased frequency of warm summers), thresholds of resilience, and extent and intensity of stressors are used to identify areas of potential refugia from a suite of ongoing anthropogenic stressors (e.g., changes in fire regime). To demonstrate its utility, we applied the framework to a Southern California landscape. Sites with high refugial capacity (super-refugia sites) had on average 30% fewer extremely warm summers, 20% fewer fire events, 10% less exposure to altered river channels and riparian areas, and 50% fewer recreational trails than the surrounding landscape. Our results suggest that super-refugia sites (∼8200 km2 ) for some natural communities are underrepresented in the existing protected area network, a finding that can inform efforts to expand protected areas. Our case study highlights how considering exposure to multiple stressors can inform planning and practice to conserve biodiversity in a changing world.
 Lloyd Coulter合作论文数43
 Allen S. Hope合作论文数33
 John R Weeks合作论文数Dept Geog, San Diego State Univ23
 Christopher D. Lippitt合作论文数School of Geography, Clark University20John F. O'Leary合作论文数18Allen S Hope合作论文数16
 Dar Roberts合作论文数Department of Geography, Bren School of Environmental Science & Management, University of California, Santa Barbara16Philip J. Riggan合作论文数15
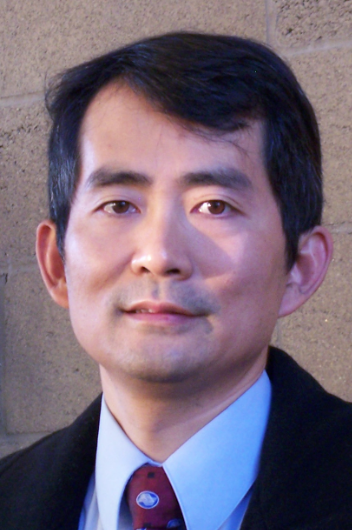 Li An合作论文数College of Forestry, Wildlife, and Environment, Auburn University;Center for Human-Earth System Science, Auburn University14
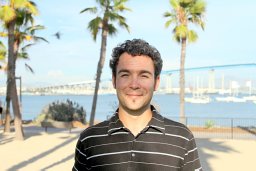 Emanuel A. Storey合作论文数Department of Geography, San Diego State University13
 Yu Hsin Tsai合作论文数13
 Walter Oechel合作论文数Coastal and Marine Institute, San Diego State University;Department of Biology, San Diego State University11
 Hsiao-Chien Shih合作论文数10
 Kellie Uyeda合作论文数University of California, University of California10
 Janet Franklin合作论文数Vegetation and Landscape Ecology Lab, Center for Open Geospatial Sciences, Department of Geography, San Diego State University;Geospatial Sciences Center, University of California, Riverside10
 Engstrom, Ryan合作论文数Department of Geography, George Washington University;c;Department of Geography, George Washington University9
 Sory ibrahim Toure合作论文数Department of Geography, San Diego State University9
 Dongmei Chen合作论文数Department of Geography, Queen’s University9
 Rebecca Lewison合作论文数Department of Biology, College of Sciences, San Diego State University9John Kaiser合作论文数8Coulter, L.合作论文数8J. E. Estes合作论文数7
 Andrew Christopher Loerch合作论文数6Atsushi Nara合作论文数Department of Geography, San Diego State University5
 Keith Clarke合作论文数Department of Geography, University of California, Santa Barbara5
 Hamada Yuki合作论文数5
 López-Carr David合作论文数Department of Geography, University of California, Santa Barbara5
 Lei Shi合作论文数Google Deepmind5
 George L. Vourlitis合作论文数5J. B. Fleming合作论文数5S. Daeschner合作论文数5
 Stuart Phinn合作论文数School of the Environment, Faculty of Science, The University of Queensland5grant w fraley合作论文数4
 Hsiang Ling Chen合作论文数4Robert G. Tissell合作论文数4Gavin Schag合作论文数Dept Geog, San Diego State Univ4S Westmoreland合作论文数4
 Jie Dai合作论文数Dept Geog, San Diego State Univ4
 Magdalena Benza合作论文数4
 Arthur Getis合作论文数Department of Geography, San Diego State University4
 David Douglas合作论文数U.S. Geological Survey4
 Daniel Sousa合作论文数Head and Neck Surgery Department, Instituto Português de Oncologia de Lisboa4Howard H. Chang合作论文数San Diego State University4Andrew Kerr合作论文数3
 Megan K. Jennings合作论文数Department of Biology, San Diego State University3Julie Lambert合作论文数3
 Eve Bohnett合作论文数Dept Biol, San Diego State Univ3
 Liming Zhou合作论文数Department of Atmospheric and Environmental Sciences, University at Albany State University of New York3
 Frank Davis合作论文数Bren School of Environmental Science& Management, University of California, Santa Barbara3




