Flood hazards and their disastrous consequences disrupt economic activity and threaten human lives globally. From a remote sensing perspective, since floods are often triggered by extreme climatic events, such as heavy rainstorms or tropical cyclones, the efficacy of using optical remote sensing data for disaster and damage mapping is significantly compromised. In many flood events, obtaining cloud-free images covering the affected area remains challenging. Nonetheless, considering that floods are the most frequent type of natural disaster on Earth, optical remote sensing data should be fully exploited. In this article, firstly, we will present a critical review of remote sensing data and machine learning methods for global flood-induced damage detection and mapping. We will primarily consider two types of remote sensing data: moderate-resolution multi-spectral data and high-resolution true-color or panchromatic data. Big and semantic databases available for advanced machine learning to date will be introduced. We will develop a set of best-use case scenarios for using these two data types to conduct water-body and built-up area mapping with no to moderate cloud coverage. We will cross-verify traditional machine learning and current deep learning methods and provide both benchmark databases and algorithms for the research community. Last, with this suite of data and algorithms, we will demonstrate the development of a cloud-computing-supported computing gateway, which houses the services of both our remote-sensing-based machine learning engine and a web-based user interface. Under this gateway, optical satellite data will be retrieved based on a global flood alerting system. Near-real-time pre- and post-event flood analytics are then showcased for end-user decision-making, providing insights such as the extent of severely flooded areas, an estimated number of affected buildings, and spatial trends of damage. In summary, this paper’s novel contributions include (1) a critical synthesis of operational readiness in flood mapping, (2) a multi-sensor-aware review of optical limitations, (3) the deployment of a lightweight ML pipeline for near-real-time mapping, and (4) a proposal of the GloFIM platform for field-level disaster support.
Flooding is one of the most frequent and costliest extreme weather events. The Model of Models (MoM) generates integrated products using ensembled hydrologic models and flood outputs derived from Earth observations. MoM provides global flood early warning and near-real time flood severity estimation. MoM results are shared via the Pacific Disaster Center’s (PDC) DisasterAWARE® multi-hazard alerting platform to the global community. Currently, DisasterAWARE incorporates Model of Models (MoM) outputs as flood “incidents,” visually depicting potential floods in the context of population and infrastructure that may become affected. Automated procedures categorize MoM outputs as DisasterAWARE “hazards,” allowing for their dissemination to users along with other flood products that assess potential impacts.
Flooding is a frequent extreme weather event that causes significant financial and societal losses. According to the International Disaster Database (EM-DAT), during January through July 2023, 87 flooding events caused about 2000 deaths and ${\$}$13 billions in damages globally. Among the impacted, low- and medium-income countries with resource scarcity tend to experience high mortality, displacement of people, unmitigated damages, and long-term recovery. Currently, several hydrologic models and Earth observation (EO) datasets are used to forecast flood severity and impacts. However, not all of these models are globally operational or publicly available. The variability in outputs in terms of accuracy, scale, and content also limits their usage for emergency response activities. The Model of Models (MoM), an ensemble approach, integrates hydrologic models and EO datasets 1) to forecast flood risk (probability of occurrence) globally every 24 h at a subwatershed level and 2) to disseminate alert messages and potential impact information to at-risk communities using the Pacific Disaster Center's DisasterAWARE platform. MoM is operational and designed to assist countries with flood risk management and mitigation by providing early warning and situational awareness information. An accuracy assessment of MoM from user-perspective across nine different flood types revealed that 1) the model reliably generated early warning for 100% of the flooded subwatersheds in seven events, and 2) during 2022 flooding, 61% and 89% of the flooded subwatersheds that were identified to be in Watch and Warning categories in Pakistan and Chad, respectively, were detected to be flooding by the Copernicus Global Flood Monitoring system.
安徽省高速公路在21世纪初期进入快速发展期,在2010以前建成一大批高速公路服务区,伴随着社会经济的高速发展,高速公路交通量快速增长,国家可持续发展的要求逐渐加大,2010年以前建成的高速公路服务区(后面简称老旧服务区)已不能满足目前和未来的高速公路服务需要及国家战略要求。通过对安徽省多对老旧老旧高速公路服务区现状进行实地调研,本文对此类服务区结合高速公路服务区存在的问题进行系统的梳理,提出针对性的升级发展措施,推动安徽高速公路服务区可持续发展,全方位提升服务区的服务质量。
At the global level, several flood related tools are available for free, ranging from observations to modeling and forecasting, using field data, remotely sensed observations as well as hydrologic and hydrodynamic models (for more details of available tools, see EOTEC DevNet’s tool tracking capacity building resources for flooding at https://eotec-dev.ceos.org/tools/). In this context, the Global Flood Awareness System (GloFAS) managed by Copernicus, for instance, aims to facilitate response to flooding, particularly in countries that cannot forecast these events on their own.However, having an EWS available to all globally, with consistent accuracy and reliability, for alerting at different severity levels, will not only aid with reduction of flood impacts, but also assist with improving resilience of these counties. In this paper, we present the model of models (MoM), which is an ensembled model that forecasts flood severity daily, globally at sub-watershed level. MoM integrates the outputs of GloFAS, GFMS, and HWRF models to forecast severity and uses MODIS and VIIRS outputs for calibration and validation of severity scores.The flood severity risk score is used to obtain and process high-resolution Earth observation data to assess flood depth and extent at granular level and estimate flood impact on critical infrastructure.The flood severity score is used to trigger dissemination of alerts using PDC’s DisasterAWARE® platform.We present a number of real event cases where MoM has been activated to alert and assist with event response activities, including performance validation with high-resolution satellite flood maps.
Flooding is a major hydro-meteorological event that impacts billions of people across the world daily. Models and Earth observation data are used for forecasting flood severity, extent, and depth, but these models and derived products are often not globally operational, and they often provide different outputs. Looking at recent disastrous events at a global level and the importance recently attributed to the need for early warning systems, it may seem that not much is being done to warn the public early enough, respond appropriately, or mitigate impacts. This is far from the truth. Worldwide, many organizations monitor hydrometeorological, geological and other types of hazards in order to allow the design, preparation and execution of an adequate response. The Model of Models (MoM) approach that leverages hydrologic models and Earth Observation datasets in an integrated manner is designed to provide flood risk information to assist emergency responders.
Abstract We use UAVSAR interferograms to characterize fault slip, triggered by the Mw 7.2 El Mayor‐Cucapah earthquake on the 1 San Andreas Fault in the Coachella Valley providing comprehensive maps of short‐term geodetic surface deformation that complement in situ measurements. Creepmeters and geological mapping of fault offsets on Durmid Hill recorded 4 and 8 mm of average triggered slip respectively on the fault, in contrast to radar views that reveal significant off‐fault dextral deformation averaging 20 mm. Unlike slip in previous triggered slip events on the southernmost San Andreas fault, dextral shear in 2010 is not confined to transpressional hills in the Coachella valley. Edge detection and gradient estimation applied to the 50‐m‐sampled interferogram data identify the location (to 20 m) and local strike (to <4°) of secondary surface ruptures. Transverse curve fitting applied to these local detections provides local estimates of the radar‐projected dextral slip and a parameter indicating the transverse width of the slip, which we equate with the depth of subsurface shear. These estimates are partially validated by fault‐transverse interferogram profiles generated using the GeoGateway UAVSAR tool, and appear consistent for radar‐projected slip greater than about 5 mm. An unexpected finding is that creep and triggered slip on the San Andreas fault terminate in the shallow subsurface below a surface shear zone that resists the simple expression of aseismic fault slip. We introduce the notion of a surface locking depth above which fault slip is manifest as distributed shear, and evaluate its depth as 6–27 m.
Despite significant progress over the past two decades, numerous economic, technical and non-technical challenges have hampered the deployment of carbon capture and storage (CCS) technologies. Recent advances in integrated assessment software have provided powerful new decision support tools to help overcome such challenges and to better evaluate investment and other risks in the integrated capture, transport and storage system. Specifically, the SimCCS software framework provides novel decision support capabilities for CCS project development. In this paper, we illustrate how the development of a new online science gateway platform of the SimCCS software termed SimCCS Gateway is now rapidly expanding the accessibility of this powerful tool. Applications in the SimCCS Gateway platform have been designed to facilitate engagement across the entire CCUS community, including commercial project developers, researchers in the technical and policy spheres, educational users (higher education and K-12) and the general public. The Gateway is providing an innovative new approach to technology transfer as well as outreach to communities in which CCS projects are being proposed and planned. Current applications include projects throughout the US and China, but nations such as Canada and Australia are poised for future implementation owing to availability of key datasets. In this way, the SimCCS Gateway software platform aims to provide a valuable new tool to facilitate the rapid deployment of CCS technologies around the globe.
GeoGateway (http://geo-gateway.org) is a web-based interface for analysis and modeling of geodetic imaging data and to support response to related disasters. Geodetic imaging data product currently supported by GeoGateway include Global Navigation Satellite System (GNSS) daily position time series and derived velocities and displacements and airborne Interferometric Synthetic Aperture Radar (InSAR) from NASA's UAVSAR platform. GeoGateway allows users to layer data products in a web map interface and extract information from various tools. Extracted products can be downloaded for further analysis. GeoGateway includes overlays of California fault traces, seismicity from user selected search parameters, and user supplied map files. GeoGateway also provides earthquake nowcasts and hazard maps as well as products created for related response to natural disasters. A user guide is present in the GeoGateway interface. The GeoGateway development team is also growing the user base through workshops, webinars, and video tutorials. GeoGateway is used in the classroom and for research by experts and non-experts including by students.
Flooding is one of the most prevalent and costliest global disasters. Disaster managers face significant challenges in managing essential information for preparedness, response, and recovery efforts. The development of an open access global flood alerting system for effective classification of potential impacts and the formulation of effective emergency response measures requires the incorporation of a wide variety of flood outputs derived from hydrologic and hydraulic models as well as from remote sensing derived data sets from multiple satellite/sensor platforms. We seek to rapidly classify flood severity using a model of models (MoM) approach that leverages products of existing flood models and incorporates Synthetic Aperture Radar (SAR) derived outputs for ground-truthing of model results and delineation of flood impact areas. The flood severity classification along with potential impacts estimated by using optical imagery will be disseminated as alerts using the Pacific Disaster Center's DisasterAWARE® decision support platform to users globally.
We present a data‐driven approach to clustering or grouping Global Navigation Satellite System (GNSS) stations according to observed velocities, displacements or other selected characteristics. Clustering GNSS stations provides useful scientific information, and is a necessary initial step in other analysis, such as detecting aseismic transient signals (Granat et al., 2013, https://doi.org/10.1785/0220130039 ). Desired features of the data can be selected for clustering, including some subset of displacement or velocity components, uncertainty estimates, station location, and other relevant information. Based on those selections, the clustering procedure autonomously groups the GNSS stations according to a selected clustering method. We have implemented this approach as a Python application, allowing us to draw upon the full range of open source clustering methods available in Python's scikit‐learn package (Pedregosa et al., 2011, https://doi.org/10.5555/1953048.2078195 ). The application returns the stations labeled by group as a table and color coded KML file and is designed to work with the GNSS information available from GeoGateway (Donnellan et al., 2021, https://doi.org/10.1007/s12145-020-00561-7 ; Heflin et al., 2020, https://doi.org/10.1029/2019ea000644 ) but is easily extensible. We demonstrate the methodology on California and western Nevada. The results show partitions that follow faults or geologic boundaries, including for recent large earthquakes and post‐seismic motion. The San Andreas fault system is most prominent, reflecting Pacific‐North American plate boundary motion. Deformation reflected as class boundaries is distributed north and south of the central California creeping section. For most models a cluster boundary connects the southernmost San Andreas fault with the Eastern California Shear Zone (ECSZ) rather than continuing through the San Gorgonio Pass.
With increased big data and computing power, machine learning is predominantly used for classification to object detection and forecasting of phenomena and relationships. Forecasting, mapping and impact assessment of flood events is one such area where machine learning is gaining momentum. While machine learning has been widely used for forecasting of flood extent and depth using rainfall/runoff datasets, impact assessment based on flood severity distribution using machine learning is still a long way from maturity. In this study, we used several machine learning classifiers such as Decision Tree (DT), Random Forest (RF), Gradient Boosting (GB), Support Vector Machine (SVM) and Multinomial Logit (ML) to classify flood severity into four classes: Information, Advisory, Watch and Warning based on the training datasets obtained from the Model of Models. The Model of Models is an ensemble model which integrates flood forecasting models to determine flood severity globally at sub-watershed level based on spatial extent and duration of flooding, risk scores associated with historic flooding events. The severity classes are used to disseminate alerts to stakeholders globally. The initial results reveal that the GB followed by DT and RF classifier performed better for classifying severity based on the performance assessment metrics. While this study has implemented a first version machine learner, future advancements will focus on deploying adaptive learners to increase the forecasting ability of the machine learner with new datasets generated daily.
We carried out six targeted structure from motion surveys using small uninhabited aerial systems over the M-w 6.4 and 7.1 ruptures of the Ridgecrest earthquake sequence in the first three months after the events. The surveys cover approximately 500 x 500 m areas just south of Highway 178 with an average ground sample distance of 1.5 cm. The first survey took place five days after the M-w 6.4 foreshock on 9 July 2019. The final survey took place on 27 September 2019. The time between surveys increased over time, with the first five surveys taking place in the first month after the earthquake. Comparison of imagery from before and after the M-w 7.1 earthquake shows variation in slip on the main rupture and a small amount of distributed slip across the scene. Cracks can be observed and mapped in the high-resolution imagery, which show en echelon cracking, fault splays, and a northeast-striking conjugate fault at the M-w 7.1 rupture south of Highway 178 and near the dirt road. Initial postseismic results show little fault afterslip, but possible subsidence in the first 7-10 days after the earthquake, followed by uplift.
Abstract This paper describes the methods used to estimate positions, velocities, breaks, and seasonal terms from daily Global Navigation Satellite System (GNSS) measurements. Break detection and outlier removal have been automated so that decades of daily measurements from thousands of stations can be processed in a few hours. New measurements are added, and parameters are updated every week. Model parameters allow separation of interseismic, annual, coseismic, and postseismic signals. Tools available through GeoGateway (http://geo-gateway.org) allow rapid visualization and analysis of these terms for results that can be subsetted in time or space. Results show highly variable and nonlinear motion for GPS stations in southern California. The variable motion is related to seasonal motions, distributed tectonic motion, earthquakes, and postseismic motions that can continue for years. In some areas results suggest that additional processes are responsible for the observed motions. In general, following earthquakes, stations return to their long‐term motions after 2–3 years, though some exceptions occur. The use of the tools shows nonlinear motion in the Salton Trough of southern California related to the 2010 M7.2 El Mayor‐Cucapah earthquake, 2012 Brawley earthquake swarm, and a creep event on the Superstition Hills fault in 2017.
In this manuscript, we describe the FutureWater Science Gateway, which simulates regional watersheds spatially and temporally to derive hydrological changes due to changes in critical effectors such as climate, land use and management, and soil conditions. We also discuss the gateway design, creation, and production deployment and how the resulting data is organized and explored. The FutureWater gateway is built based on the Apache Airavata gateway middleware framework and hosted under the SciGaP project at Indiana University. The gateway provides an integrated infrastructure for simulations based on parallelized Soil and Water Assessment Tool (SWAT) and SWAT-MODFLOW software execution on Extreme Science and Engineering Discovery Environment (XSEDE) and Indiana University’s (IU’s) HPC resources. It organizes data in optimized relational databases and enables intuitive simulation result data exploration. The visualization involves geographical map integration and dynamic data provisioning using the R-Shiny application deployed in the gateway. The gateway provides simple, intuitive user interfaces for providing simulation input data and combines available model data; it makes it possible to set up and execute the simulation on HPC systems and ingest the results into the databases. The portal addresses the needs of diverse stakeholder communities for education, research, exploration, and planning in academic, governmental, and non-governmental organizations.
Floods are happening regularly in almost all places of the world and impact people, societies and economies, causing widespread devastation that can be hard to recover from. Yet, accurately predicting and alerting for floods is challenging, primarily since flood events are very local in nature and processes causing a flood can be very complex. In an era of open-access geospatial data proliferation as well as data and model interoperability, it makes sense to leverage on existing data and models, many of which are underutilized by decision-making applications. Thus, the objective of the project is to develop an open-access rapid alerting and severity assessment component for global flooding based on existing models and observation data sources. We do this within the DisasterAWARE platform of the Pacific Disaster Center (PDC). This paper will outline the proposed concept of model-of-models that will leverage existing flood-hazard modeling capabilities, illustrating products that we will leverage, such as: GLOFAS (Global Flood Forecasting Feeds) probabilistic hydrologic data, IMERG (The Integrated Multi-satellitE Retrievals for GPM) observed precipitation grids, GDACS (Global Disaster Alerting Coordination System) anomaly points, GFMS (Global Flood Monitoring System) depth above baseline grids, the NASA MODIS (Moderate Resolution Imaging Spectroradiometer) and Dartmouth Observatory flood maps, as well as new models as they are developed. We will further combine the flood hazard data with existing exposure data to estimate property loss using a probabilistic fragility approach. With the use of an end-to-end deep learning framework, structural damage will be detected using different remote sensing data. The approach will further incorporate other, non-routinely-generated remotely-sensed products for ground-truthing for areas and events where and when such products are available. The existing resilience and capacity of communities to rapidly respond to and recover from flood impacts will be incorporated into the severity determination on an administrative area and watershed risk basis. This model-of-models approach will leverage major efforts, improve reliability and reduce false triggers by ensuring two or more models agree.
Quantifying Uncertainty and Kinematics of Earthquakes (QUAKES-A) provides an analytic center framework for creating a uniform crustal deformation reference model for the active plate margin of California by fusing InSAR, topographic, and GNSS geodetic imaging data. The objective is to provide tools for sampling spatial processes ranging from local to earthquake faults to broad tectonic deformation and temporal processes ranging from immediately following earthquakes to long-term tectonics. A reference model allows exploration of a uniform model and comparison to new data.
A dramatic increase in frequency of minor to major flooding since 2000 has caused significant economic losses across the world.To mitigate and recover from these losses, actions have been taken to build resilient communities and infrastructures, specifically, by providing situational awareness in near real-time about flood impacts to enhance response and recovery efforts.Several hydrologic and hydraulic flood models are available at various spatial and temporal resolutions to forecast flood events at regional to global scale.Given the global coverage of two operational flood models -GloFAS (Global Flood Awareness System) and GFMS (Global Flood Monitoring System), the purpose of this project is to implement a Model of Models (MoM) approach to integrate the outputs from these two models to classify flood severity at watershed level worldwide, and send alerts based on severity similar to the USGS PAGER (used for severity alerting and impact analysis for earthquakes) to flood impacted communities.The alerts containing flood impacts and severity information will be disseminated through the DisasterAWARE platform, operated by the Pacific Disaster Center (PDC), that provides global multi-hazard alerting and Situational Awareness information to the emergency management community and public.The current version of the MoM approach was implemented for a case study flood event that occurred during January and February of 2020 in South and Central Africa.The findings of the case study event reveal that the approach is effective in identifying potential flood impact areas and the spatio-temporal variation of flood severity, flood depth and extent at watershed level, which will be used to assess infrastructure and societal impacts using earth-observation data and for alerting.
The SimCCS2.0 Gateway provides a science gateway for optimizing CO2 capture, transport, and storage infrastructure. We describe the design, creation, and production deployment of this platform, which is based on an Apache Airavata gateway middleware framework. This gateway provides an integrated infrastructure for data, modeling, simulation, and visualization of carbon sequestration technologies and their economics. It does so through simple user interfaces to map and select input data, build models, and set up and execute simulations on high performance computing systems. Also featured are community case studies to use as reference sets for verifying reproducibility of published models and reusing their respective data for modified simulations. The portal addresses the needs of diverse international stakeholders and provides a platform for integrating novel and complex models for carbon sequestration technologies moving into the future.
 Marlon Pierce合作论文数Indiana University32
 Jay Parker合作论文数27
 Andrea Donnellan合作论文数Jet Propulsion Laboratory, Pasadena, CA, USA26
 Margaret Glasscoe合作论文数19
 John Rundle合作论文数Department of Physics and Astronomy, University of California, Davis;The Santa Fe Institute18
 Lisa Grant Ludwig合作论文数University of California13
 Robert Granat合作论文数The City College of New York12
 Yu Ma合作论文数10
 Bandana Kar合作论文数Univ So Mississippi, Dept Geog & Geol, Hattiesburg, MS 39406 USA8
 Jie Shan (单杰)合作论文数Geospatial Sensing and Modeling Lab, Lyles School of Civil and Construction Engineering, College of Engineering, Purdue University8
 Geoffrey Fox合作论文数Department of Physics, College of Arts and Sciences, Indiana University;Department of Intelligent Systems Engineering, Indiana University;Community Grid Laboratory, Indiana University;Digital Science Center of Pervasive Technology Institute;School of Engineering and Applied Science, University of Virginia8
 Guy Schumann合作论文数School of Geographical Sciences, University of Bristol7
 Prativa Sharma合作论文数University of Missouri Kansas City6
 Glasscoe, M.合作论文数6
 Gregory Lyzenga合作论文数6D. Bausch合作论文数5Xingyao Zhou合作论文数5
 Eroma Abeysinghe合作论文数Cyberinfrastructure Integration Research Center, Indiana University Bloomington4
 Sharaf Alkheder合作论文数Corresponding author.4Cheng Fang合作论文数4Marcus Christie合作论文数Department of Computer Science;Indiana University4Sudhakar Pamidighantam合作论文数University of Illinois at Urbana-Champaign4
 Michael Heflin合作论文数NASA Jet Propulsion Laboratory4
 Mark R Yoder合作论文数Department of Physics;University of California , Davis;Department of Physics, University of California , Davis4Douglas Bausch合作论文数3T. Stough合作论文数3
 Chen Zhiqiang合作论文数3
 Kristy F. Tiampo合作论文数3
 Ronald T. Eguchi合作论文数ImageCat . Inc3
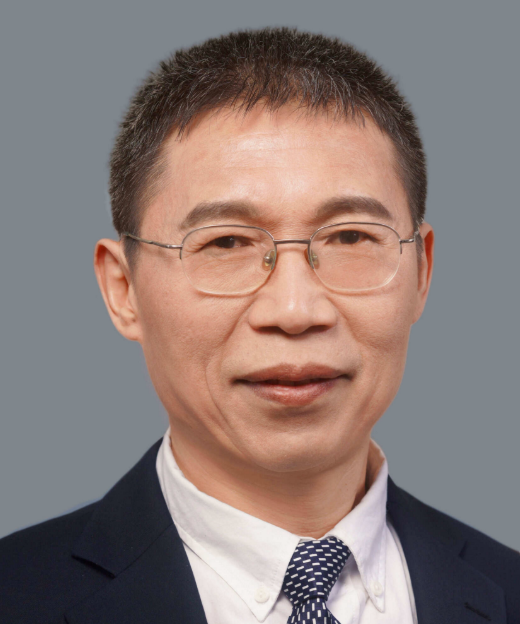 Baizhao Zeng (曾百肇)合作论文数College of Chemistry and Molecular Sciences, Wuhan University3rami alghanmi合作论文数2Alan Walsh合作论文数2
 Zhiqiang Chen合作论文数2Ryan Kammer合作论文数Indiana Geol & Water Survey, Indiana Univ2
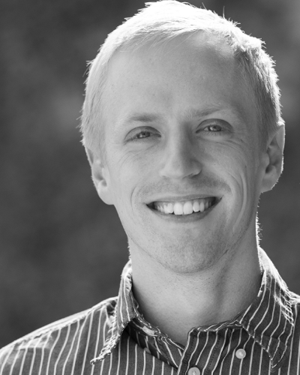 Brian P. Hawkins合作论文数Jet Prop Lab, CALTECH2D. McLeod合作论文数2Brendan Hoover合作论文数2
 Jennifer Dierauer合作论文数Coll Nat Resources, Univ Wisconsin2DeGui Hu (胡德贵)合作论文数2
 Xianhua Wang (王贤华)合作论文数State Key Laboratory of Coal Combustion, Huazhong University of Science and Technology2
 Sean Yaw合作论文数2
 Kevin M. Ellett合作论文数2
 Chen Zhu合作论文数Department of Earth and Atmospheric Sciences, College of Arts & Sciences, Indiana University Bloomington;School of Public Health, Indiana University Bloomington2
 Haiping Yang (杨海平)合作论文数State Key Laboratory of Coal Combustion, Huazhong University of Science and Technology;School of Energy and Power Engineering, Huazhong University of Science and Technology2
 Hanping Chen (陈汉平)合作论文数School of Energy and Power Engineering, Huazhong University of Science and Technology2
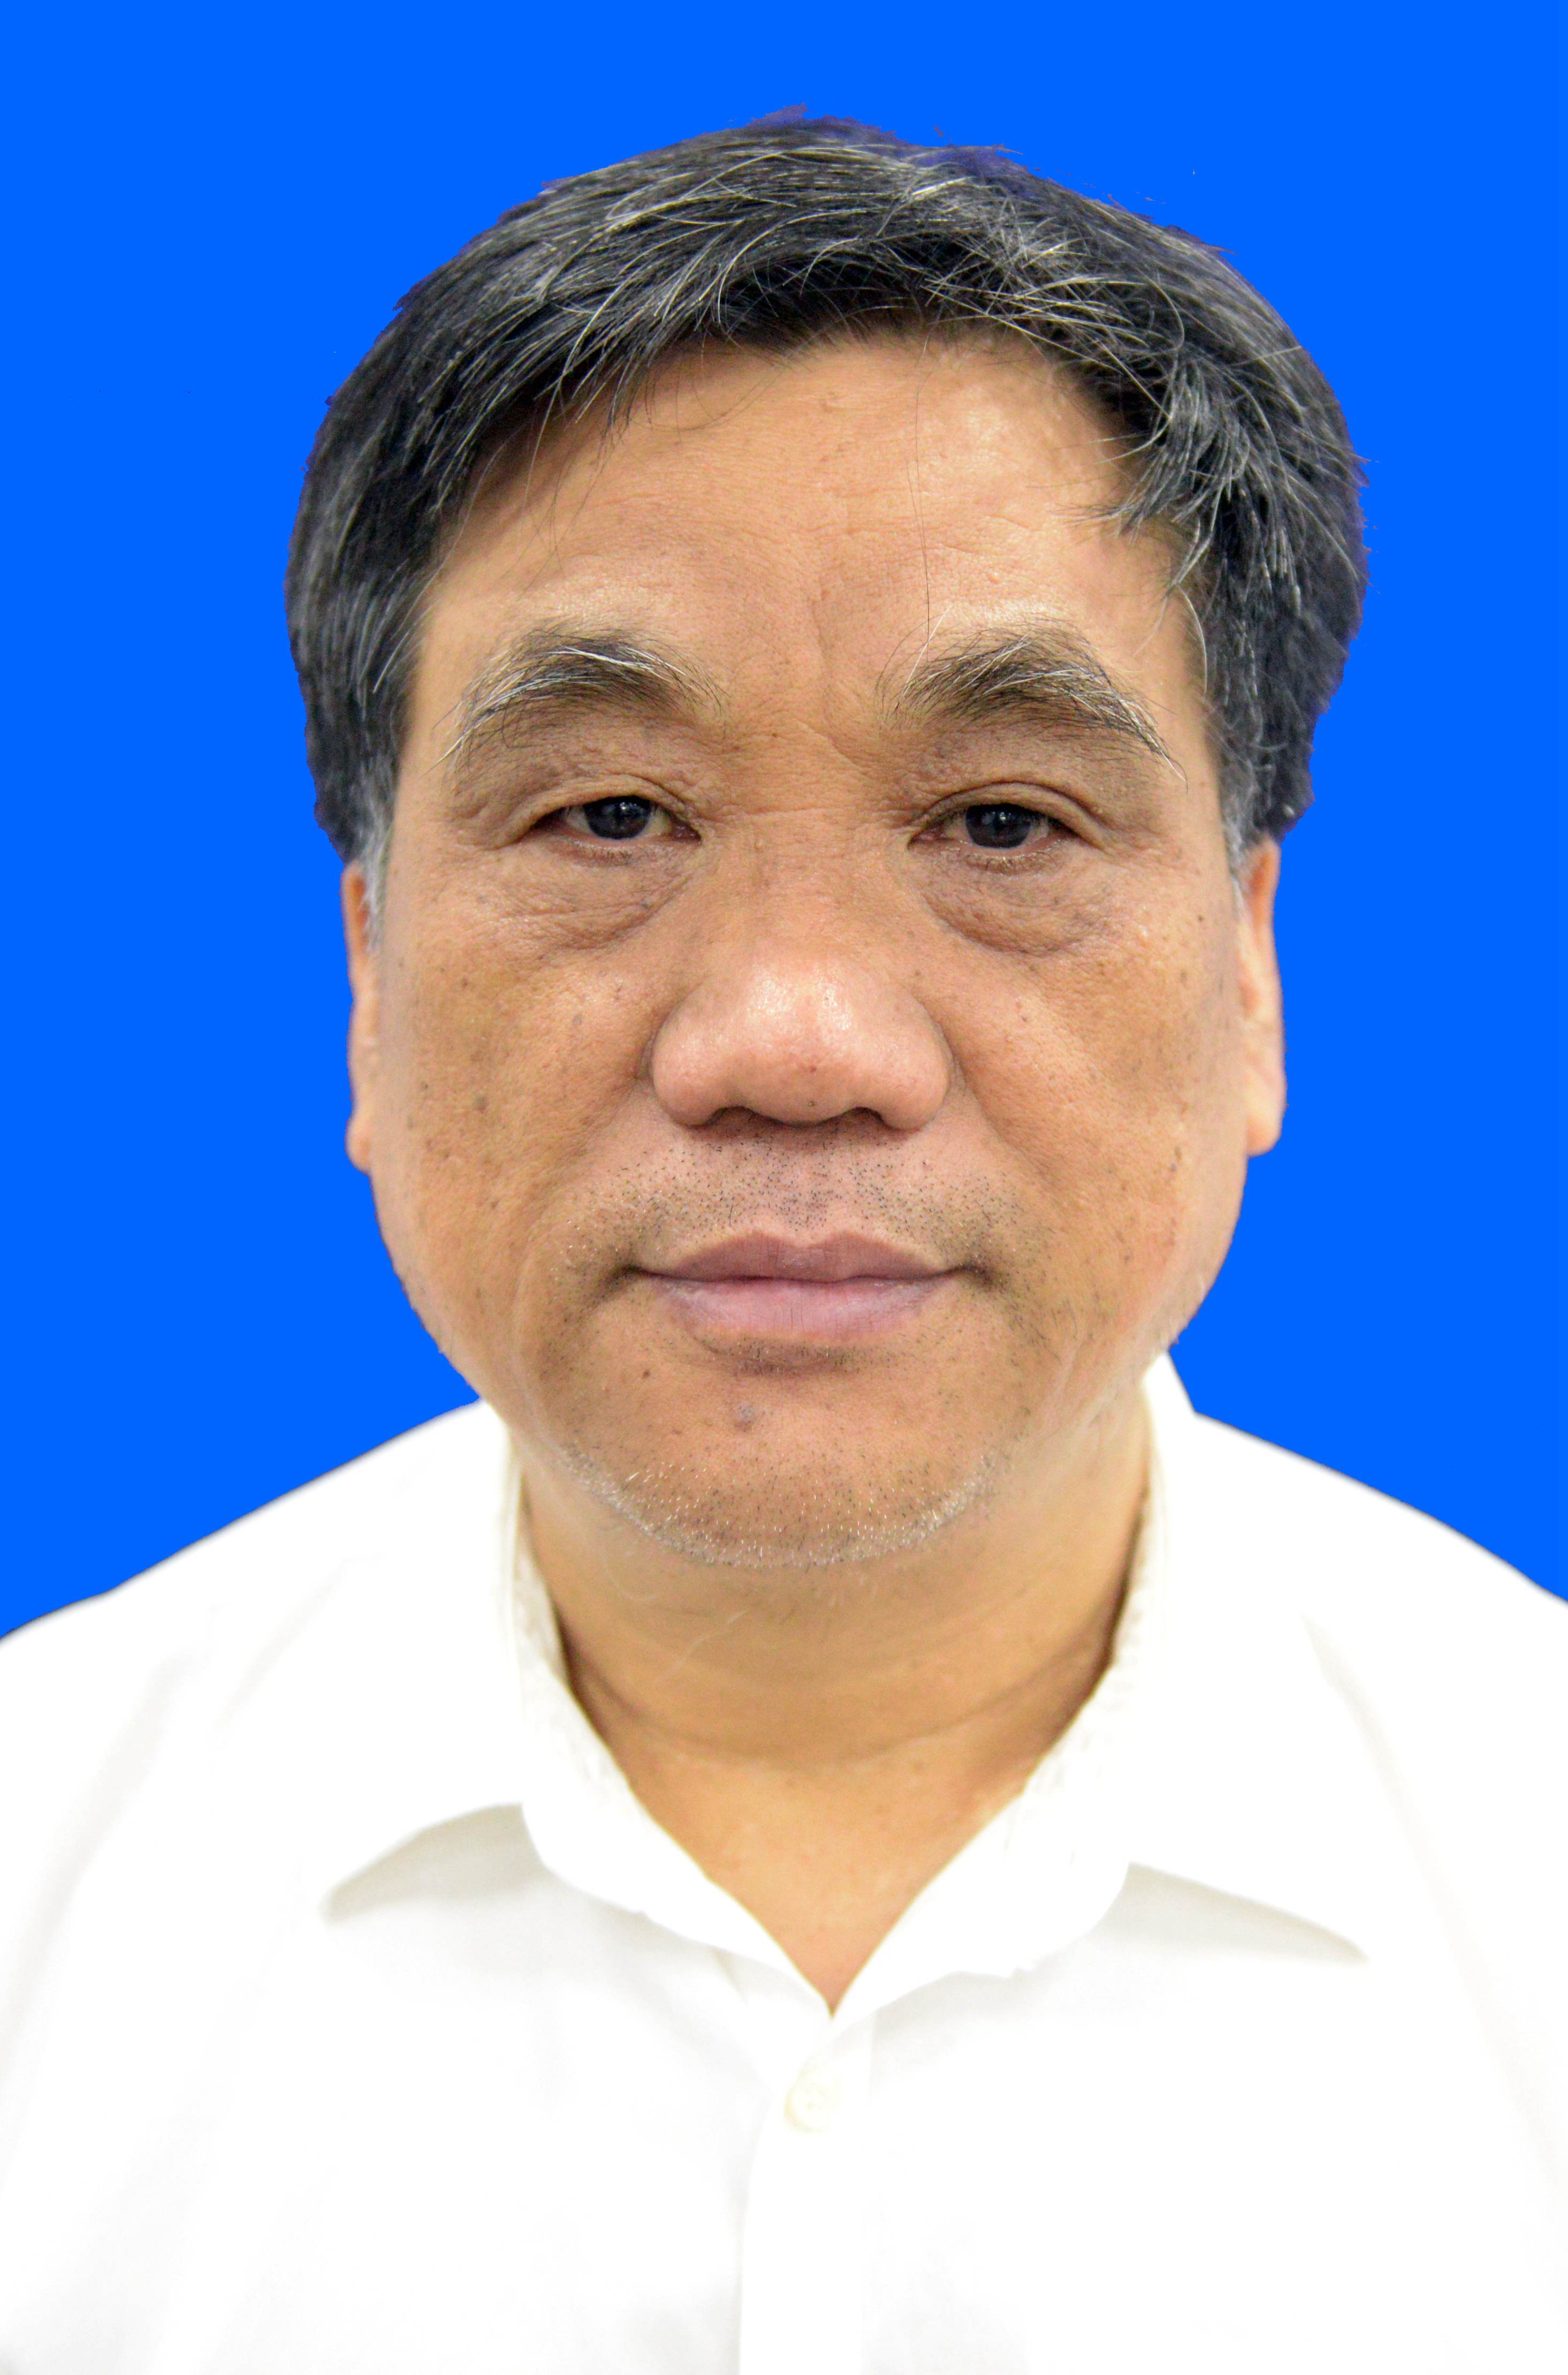 Suiwang Ji (吉随旺)合作论文数Sichuan Highway Engineering Consulting & Supervision Company2
 Angelyn Moore合作论文数Jet Propulsion Laboratory, National Aeronautics and Space Administration, California Institute of Technology2X. Y. Gao合作论文数2Peter Gründler合作论文数Leibniz-Institut für Festkörper- und Werkstoffforschung Dresden2




