The European Space Agency (ESA) integrates open-source software to manage, visualize, and distribute planetary data, focusing on Mars and supporting global scientific collaboration through the Planetary Science Archive (PSA). This advanced infrastructure combines cutting-edge tools and technologies to enhance data accessibility and promote international research.Tools and TechnologiesOpenLayers: Powers 2D interactive maps, offering scientists an intuitive interface for exploring planetary geospatial data. GeoServer: Shares spatial data via standard protocols like WMS, serving base maps and integrating advanced caching techniques. Three.js: Facilitates 3D visualization of celestial objects, such as comets and asteroids, providing dynamic exploration capabilities. PostgreSQL and PostGIS: Stores and manages complex geospatial datasets, enabling advanced spatial queries and integration with other GIS tools. Collaborative EffortsESA contributes to open-source projects to solve unique planetary data challenges:Astroquery: A Python library for accessing astronomical databases, ensuring efficient integration of planetary mission data into research workflows. Antimeridian: Addresses geospatial data crossing the 180° longitude line, ensuring accurate planetary mapping. PSA Interface and GIS ArchitectureThe PSA’s new interface integrates 2D and 3D visualizations, data filtering, and real-time access to information. Scientists can overlay geological, topographical, and spectral data layers, analyze specific regions, and download curated datasets. The GIS architecture combines:GeoServer: Distributes optimized base maps of planetary surfaces. OpenLayers and Three.js: Provides a seamless 2D and 3D visualization experience. PostgreSQL/PostGIS: Manages and analyzes large geospatial datasets. Astroquery and Antimeridian: Enhances data accessibility and accuracy. Benefits for the Scientific CommunityThis open-source approach promotes transparent, collaborative research. Tools like Antimeridian address specific planetary data issues, enabling continuous and precise geospatial representation. The PSA allows researchers to cross-reference data from various missions and instruments efficiently, accelerating planetary science advancements.In conclusion, ESA’s adoption of open-source tools and robust GIS architecture provides an accessible, powerful platform for planetary research, fostering innovation and collaboration across the global scientific community.
AbstractGeographical information systems (GIS) are becoming increasingly used for planetary science. GIS are computerised systems for the storage, retrieval, manipulation, analysis, and display of geographically referenced data.Some data stored in the Planetary Science Archive (PSA)[1] have spatial metadata associated to them. To facilitate users in handling and visualising spatial data in GIS applications, the PSA should support interoperability with interfaces implementing the standards approved by the Open Geospatial Consortium (OGC). These standards are followed in order to develop open interfaces and encoding that allow data to be exchanged with GIS Client Applications (e.g. OpenLayers, Cesium...). Access to this data for use in applications can be provided through OGC Web Service (OWS) implementations.An existing open source server is GeoServer, an instance of which has been deployed for the PSA, that uses the OGC standards to allow the sharing, processing and editing of data and spatial data through the Web Map Service (WMS) and Web Feature Service (WFS) standards. On the back-end side, a PostgreSQL/PostGIS instance allows the spatial queries.The final goal is to enhance the PSA (accessible through ) further as a portal which enables science exploitation of ESA's planetary missions datasets. This can be facilitated through the GIS framework, offering interfaces (both web GUI and scriptable APIs) that can be used more easily and scientifically by the community, and that will also enable the community to build added value services on top of the PSA.IntroductionSome of the current operational ESA planetary missions, such as Mars Express, ExoMars 2016, and BepiColombo, as well as other future missions such as ExoMars 2020, Juice, etc. will benefit of a GIS tool to visualize their targets (Mars, Mercury, Jupiter…) allowing spatial queries to retrieve geometrical information like features, footprints, rover path tracking, rover drill sites, etc.GIS ArchitectureThe PSA relies on 3-tiered system for the GIS architecture (see Figure 1). The database layer is composed of a PostgreSQL database with the PostGIS extension to store the spatial information. The server layer uses GeoServer as a map server to provide WMS/WFS responses (e.g. GeoJson, kml…) to the web application’s requests (implemented on the Vaadin framework). Finally, the client layer (browser) runs the OpenLayer Javascript library to render the map.Other external GIS tools like QGIS might be used to get the PSA spatial data from either the GeoServer or the database. Figure 1: GIS architecture diagram for the PSAViews ConsistencyThe PSA provides different views to show the same planetary data. These views are integrated and synchronized to each other to visualize the information as the data type requires. All of them use the filter menu to search by a given criteria and offer similar features such as sorting, pagination, downloading and product detailed info. Once a query is executed on a view, the information is automatically loaded when changing views. The map view is integrated in the current PSA (see Figure 2) as the other views (Table, Image) giving other perspective of displaying results when it comes to search for spatial data. Figure 2: Views Consistency in the PSAGIS ApplicabilityGIS technology on the PSA will offer a common way to filter (by mission, instrument, target, dates, geometry…) and search for spatial data, even for legacy missions, thanks to the homogenization of the geometrical information with per-product spatial metadata computed in a consistent way via SPICE.PSA will provide spatial data retrieval of both versions of the NASA Planetary Data Systems archival formats, PDS3 and PDS4, based on a criteria search, and, the possibility of selecting PDS3/PDS4 products from a particular region of interest (ROI) (see Figure 3). Figure 3: Query by ROI and footprint selectionPSA also provides other useful GIS tools such as switching projections for better visualization and analysis of footprints over the poles (see Figure 4) as well as switching between different base maps of Mars for better visualization, enabling/disabling layer feature, overlapping footprint selection by popup and a grid/graticule layer.Figure 4: Footprints over the Mars North Polar projectionPSA also allows the user to add customized and external data through a GeoJSON file uploader tool (see Figure 5).Figure 5: GeoJSON data uploader featureAcknowledgementAlthough the whole PSA team has somehow been involved in this GIS implementation, I would specially like to thank Francisco Raga for his huge contribution in many of the presented GIS features.References[1] Besse, S. et al. (2017) Planetary and Space Science, , ESA's Planetary Science Archive: Preserve and present reliable scientific data sets.
The joint ESA/JAXA BepiColombo mission to Mercury comprises two orbiters and a solar-electric transfer module, currently in a stack configuration. The BepiColombo spacecraft stack flew by the Earth on 10th April 2020 and will perform eight flybys more on its way to Mercury: two at Venus (in October 2020 and August 2021), and 6 at Mercury, starting from October 2021, before orbit insertion in December 2025. The two spacecraft host many instruments designed to study Mercury's interior structure, surface properties, close space environment, and their interplay.Processing the telemetry received from the spacecraft on ground into science products for the archive and providing quick access and visibility of the science results to the science team are the responsibility of the ESA Science Ground Segment (SGS). Raw and calibrated science products are generated by the data processing pipelines within hours after reception of the telemetry and can be visualised through a Quick-Look Analysis (QLA) web-application. Science products are also made available in the Planetary Science Archive (PSA) to the instrument teams for detailed analysis and further processing.This contribution will describe how the SGS data processing and quick-look analysis infrastructure, in operation since launch, has been enhanced to support the monitoring, sharing and analysis of all the scientific measurements that will be acquired during the flybys. This infrastructure includes instrument-specific calibration and reduction processing pipelines developed by the PI teams. Reduction pipelines are hosted either by the SGS or by the corresponding PI team based in a prime-redundant configuration and with a replica always available at the SGS.The Quick-Look Analysis web-application is intended to provide rapid feedback on the content and quality of the science archive products, to support the diagnosis of pipeline or instrument issues, to facilitate the monitoring of deviations of the executed observations from the planned observations and, when possible, to feedback the result of the analysis into the different cycles of the science planning. This strategy is science-driven and offers the possibility of exploring and sharing information and plots of the science data collected by both the MPO and MMO instruments among the BepiColombo science working team members.In addition to the Quick-Look Analysis web-application, all the spacecraft and payload housekeeping parameters are made available to the science team via a web-based user interface (WebMUST). This interface allows monitoring of the spacecraft and instrument operations in near-real time, as the telemetry arrives on ground. Pre-configured dashboards can be designed for specific needs such as monitoring the data volumes in the packet stores of the on-board mass memory (SSMM) along with the switch on of the various instruments of the BepiColombo payload.Despite the limited science capabilities of the spacecraft in cruise configuration (as the boresight of many instruments is partially or fully blocked by the Mercury Transfer Module), several instruments will perform calibration and scientific measurements during flybys. Some examples of how the science observations can be monitored with the tools developed by the SGS will be presented. The main goal of these tools is to make available to the science team all the information relevant for the post-analysis of the executed observations and to capture and preserve this knowledge for the future users of the BepiColombo data in the scientific community.
Abstract With new missions being selected, missions moving to post-operations, and missions starting their journey to various targets in the Solar System, the European Space Agency’s Planetary Science Archive [1] (http://psa.esa.int) (PSA) is in constant evolution to support the needs of the projects and of the scientific community. What happened since last year? The past year has been good for the European Space Agency (ESA) Solar System missions and the PSA, with the successful flyby of Earth by the BepiColombo mission to Mercury. The ExoMars 2016 mission is performing nominally and is quickly delivering numerous scientific observations. As is common for ESA missions, access to the data is protected and reserved to members of the science team for the first months of the mission. Once the products are ready to go public, the PSA performs a scientific peer-review to ensure that the products to be made public are of excellent quality for all future users. During the first half of 2020, the PSA has successfully peer-reviewed the CaSSIS and NOMAD observations. Those products are now being made public on a systematic basis once the proprietary period elapses (generally between 6 and 12 months). Early in 2020, filters to search data with geometrical values (i.e., longitude, phase angle, slant distance, etc.) were enabled. For now this service works for Mars Express and Rosetta, but will be soon extended to other missions. One of the main new services provided to the scientific community in 2020 is the Guest Storage Facility (GSF), which allows users to archive derived products. Products such as geological maps, Digital Terrains Models, new calibrated files, and others can be stored in the GSF in the format most used by the users. Contact us to preserve your science! Finally, by the end of 2020 users of the PSA will have access to new services based on Geographical Information Systems. You can contribute to the PSA! At the PSA we constantly interact with our users to ensure that our services are in line with the expectations and needs of the community. We encourage feedback from community scientists through: * PSA Users Group: A group of scientific experts advising the PSA on strategic development; * Direct interactions: Scientists from the PSA are available and eager to receive your comments and suggestions; * ESA missions: If you are part of a mission archiving its data at the PSA, tell us how your data should best be searched and used. Acknowledgement The authors are very grateful to all the people who have contributed over the last 17 years to ESA's Planetary Science Archive. We are also thankful to ESA’s teams who are operating the missions and to the instrument science teams who are generating and delivering scientific calibrated products to the archive. References [1] Besse, S. et al. (2017) Planetary and Space Science, 10.1016/j.pss.2017.07.013, ESA's Planetary Science Archive: Preserve and present reliable scientific data sets.
Introduction: The Planetary Science Archive (PSA)[1] of the European Space Agency (ESA) has, over the past year, incorporated new interfaces for accessing the data. These new interfaces (an improved SFTP[2], the PSA PDS[3] API[4] and ESA Datalabs[5]), along with enhancements to the existing ones (TAP/EPN-TAP[6] and UI[7]), have considerably contributed to expand the interoperability mechanisms of the archive. Here we describe various use cases (for both PDS3[8] and PDS4[9] data formats) in which all or part of these interfaces are used, showing different ways to obtain results from the same source archive.Example Overview: The use case will simply be to access some PDS3 and PDS4 products by their logical identifier. These are the missions and instruments we will use for this (both Martian missions). Mission Format Instr. Product identifier Mars Express PDS3 HRSC MEX-M-HRSC-3-RDR-EXT9-V4.0:DATA:HO799_0000_S23.IMG ExoMars TGO PDS4 ACS urn:esa:psa:em16_tgo_acs:data_raw:acs_raw_hk_nir_20180613t180000-20180613t235959::1.0 Depending on the interface, the result will be either the download of the data product or the associated metadata (bundles/datasets, collections, label files, etc.)GUI: The PSA Graphical User Interface (PSA GUI), which has been recently refurbished using the Angular framework, offering a modern and responsive design, allows the user to visualize data in a friendly way and search for PDS3 or PDS4 products via a rich set of filters. For our use case, we will use the Product ID field to search by the logical_identifier parameter (last version will be given by default).Figure 1: Getting a PDS3/4 product in the PSA GUI and displaying it in the Mars map view.TAP/EPN-TAP: The Table Access Protocol (TAP) service, running as a web application, allows searching PDS3 or PDS4 data by means of ADQL[10] queries. This service is used as back-end for the GUI shown before; in addition, it can be accessed directly through a browser, programmatically (with Bash, Python, etc.) or from a client application such as Topcat. For the PDS3 use case, we will use the EPN-TAP service (Europlanet extension based on TAP) via the curl command: $ curl -X 'GET' \ 'https://psa.esa.int/psa-tap/tap/sync?LANG=ADQL&REQUEST=doQuery&FORMAT=json&QUERY=select%20*%20from%20%20psa.epn_core%20where%20(obs_id=%27MEX-M-HRSC-3-RDR-EXT9-V4.0%3ADATA%3AHO799_0000_S23.IMG%27)' \ -H 'accept: *' This returns a JSON file with expected metadata such as mission, instrument, bundle, collection, target, geometrical information, processing level, download path, etc.SFTP: The new SFTP service, based on CrushFTP[11], provides a rich web client to download data, as well as a standard SFTP access. It uses a virtual volume behind the scenes, to get the available public/private data using the FUSE[12] technology. In this interface, the user may explore the structure of missions, datasets/bundles up to the desired level. For the use case, we will run the URL in the browser to get the same PDS3 product as before: https://psaftp.esac.esa.int/#/MARS-EXPRESS/HRSC/MEX-M-HRSC-3-RDR-EXT9-V4.0/DATA/O799/HO799_0000_S23.IMGThis will result in the download of the selected product to the user’s machine.Figure 2: Accessing a PDS3/4 product and browsing its contents with the PSA new SFTP. PDS API: The PDS API implemented by NASA makes use of the PDS4 harvester to access PDS4 data of the PSA (although PDS3 data is not yet available in PDS, the PDS3 to PDS4 migration activity of the PSA coming up soon will cover the retrieval of these datasets). The API can be accessed from a browser (Swagger[13]), command line, Jupyter notebook[14], etc. This API allows the user to search for PDS4 products and their references by their lidvid (logical identifier and version id), collections, specifying the returned fields and filtering by any of the metadata contained in their label files. This ability to query arbitrary meta-data makes it very powerful.To get the example PDS4 product via the PDS API we would just use the following URL:https://pds.nasa.gov/api/search/1/products/urn:esa:psa:em16_tgo_acs:data_raw:acs_raw_hk_nir_20180613t180000-20180613t235959::1.0Figure 3: Getting metadata of a PDS4 product through the PSA PDS API (via Swagger API).The response body includes product’s information such as the mission, instrument, observation dates, targets, etc. It also includes the PSA label (XML file) URL, which links to our PSA FTP repository.Various response formats are supported, including CSV, XML, JSON and the original PDS4 label.ESA Datalabs: Finally, this new framework allows the user to work with planetary data without needing to download it. In the example, a Jupyter Notebook is used to access and display the MEX HRSC product. For reading PDS3 data, the PDR[14] Python library is used.Figure 4: Getting and plotting a PDS3 product with ESA Datalabs.Acknowledgments: We are grateful to the PSA development team for their invaluable assistance in creating and refining the PSA software. We also thank our advisors and supporters for their guidance and encouragement throughout the process.References:[1] S. Besse et al. (2018), ESA's Planetary Science Archive: Preserve and present reliable scientific data sets, Planetary and Space Science, Volume 150, p. 131-140.[2] Secured FTP: https://psaftp.esac.esa.int/[3] Planetary Data System: https://pds.nasa.gov/[4] PDS PSA: https://pds.nasa.gov/api/search-psa/1/[5] ESA Datalabs: https://datalabs.esa.int/[6] TAP/EPN-TAP: https://psa.esa.int/psa-tap/tap/[7] PSA User Interface: https://psa.esa.int[8] PDS3 Archiving Guide:https://www.cosmos.esa.int/documents/772136/977578/ESDC-PSA-TN-0008.pdf[9] PDS4 Archiving Guide:https://www.cosmos.esa.int/documents/772136/977578/ESDC-PSA-TN-0002+Iss2Rel5-5.pdf[10] Astronomy Data Query Language (ADQL): https://www.ivoa.net/documents/ADQL/20180112/PR-ADQL-2.1-20180112.html[11] CrushFTP: https://www.crushftp.com/index.html[12] FUSE: https://github.com/libfuse/[13] Swagger: https://swagger.io/[14] Jupyter Notebook: https://jupyter.org/[15] PDR python library: https://github.com/millionconcepts/pdr
Comets are believed to have preserved pristine material from the early stages of the Solar System formation, thus providing unique information on intricate processes like dust growth mechanisms. The Rosetta mission gave us the best opportunity to investigate nearly pristine cometary dust particles of comet 67P/Churyumov–Gerasimenko. Among the three in-situ dust instruments, the MIDAS (Micro-Imaging Dust Analysis System) atomic force microscope collected cometary dust particles with sizes from hundreds of nanometres to tens of micrometres and recorded their 3D topography, size, shape, morphology, and related parameters [1].MIDAS collected dust emitted from comet 67P on dedicated targets. Particles fell through the entry funnel and collided with the collection targets [2] causing an unknown degree of particle alteration. To understand which structural properties of the dust remained pristine and can be used to understand comets and early Solar System processes it is important to understand the collection alteration. Dedicated laboratory experiments were carried out by previous studies [3, 4]. They found that the degree of alteration upon collection is strongly determined by the particle size, strength, and the collection velocity. They indicate that particles in the MIDAS size range deposited with moderate velocities about less than a few metres per second can stick on a target without major alteration.We aim to determine the structurally least altered MIDAS particles and investigate their properties. As database we use an improved version of the MIDAS particle catalogue [5]. Selecting all particles suitable for our analysis (e.g., cometary origin, sufficiently high image quality) grants us topographic data of over 600 nano- to micrometre-sized dust particles of comet 67P. We create dust coverage maps showing the distribution of the selected dust particles on the collection targets. As first, simple classification we divide the particles into those detected in clusters, suggested to be fragments originating in a shattering event of one large parent particle, and those remote from others that are potentially individually collected particles. Finally, we use a shape descriptor to categorise the particles according to their characteristics, e.g., shape and size, and compare to previous results from COSIMA [6] and simulation/laboratory studies [3, 7]. [1] Bentley, M.S., Schmied, R., Mannel, T., et al. 2016, Nature, 537[2] Bentley, M. S., Arends, H., Butler, B., et al. 2016, Acta Astronautica, 125, 11[3] Ellerbroek, L. E., Gundlach, B., Landeck, A., et al. 2017, MNRAS, 469, S204[4] Ellerbroek, L. E., Gundlach, B., Landeck, A., et al. 2019, MNRAS, 486, S3755[5] Boakes, P., and the MIDAS team, 2018. ‘MIDAS Particle Catalogue’. ESA Planetary Science Archive Dataset: RO-C-MIDAS-5-PRL-TO-EXT3-V2.0. Product ID: RO-C-MIDAS-5-PRL-TO-EXT3-V2.0[6] Langevin, Y., Hilchenbach, M., Ligier, N., et al. 2016, Icarus, 271, 76[7] Lasue, J., Maroger, I., Botet, R., et al. 2019, A&A, 630,
The MIDAS (Micro-Imaging Dust Analysis System) atomic force microscope on board the Rosetta comet orbiter investigated and measured the 3D topography of a few hundred nm to tens of $\mu$m sized dust particles of 67P/Churyumov-Gerasimenko with resolutions down to a few nanometers, giving insights into the physical processes of our early Solar System. We analyze the shapes of the cometary dust particles collected by MIDAS on the basis of a recently updated particle catalog with the aim to determine which structural properties remained pristine. We develop a set of shape descriptors and metrics such as aspect ratio, elongation, circularity, convexity, and particle surface/volume distribution, which can be used to describe the distribution of particle shapes. Furthermore, we compare the structure of the MIDAS dust particles and the clusters in which the particles were deposited to those found in previous laboratory experiments and by Rosetta/COSIMA. Finally, we combine our findings to calculate a pristineness score for MIDAS particles and determine the most pristine particles and their properties. We find that the morphological properties of all cometary dust particles at the micrometer scale are surprisingly homogeneous despite originating from diverse cometary environments (e.g., different collection targets that are associated with cometary activities/source regions and collection velocities/periods). We next find that the types of clusters found by MIDAS show good agreement with those defined by previous laboratory experiments, however, there are some differences to those found by Rosetta/COSIMA. Based on our result, we rate 19 out of 1082 MIDAS particles at least moderately pristine, i.e., they are not substantially flattened by impact, not fragmented, and/or not part of a fragmentation cluster.
Context. The Micro-Imaging Dust Analysis System (MIDAS) atomic force microscope (AFM) on board the Rosetta comet orbiter has been dedicated to the collection and 3D topographical investigation of cometary dust in the size range of a few hundreds of nanometers to tens of micrometers with a resolution down to a few nanometers. Aims. We aim to catalog all dust particles collected and analyzed by MIDAS, together with their main statistical properties such as size, height, basic shape descriptors, and collection time. Furthermore, we aim to present the scientific results that can be extracted from the catalog, such as the size distribution and statistical characteristics of cometary dust particles. Methods. Through a careful re-analysis of MIDAS AFM images, we make a significant update and improvement to the existing MIDAS particle catalog, resulting in the addition of more particles and newly developed shape descriptors. The final product is a comprehensive list of all possible cometary dust particles detected by MIDAS. The catalog documents all images of identified dust particles and includes a variety of derived information tabulated one record per particle. Furthermore, the best image of each particle was chosen for subsequent studies. Finally, we created dust coverage maps and clustering maps of the MIDAS collection targets and traced any possible fragmentation of collected particles with a detailed algorithm. Results. The revised MIDAS catalog includes 3523 MIDAS particles in total, where 1857 particles are expected to be usable for further analysis (418 scans of particles before perihelion + 1439 scans of particles after perihelion, both after the removal of duplicates), ranging from about 40 nm to about 8 mu m in size. The mean value of the equivalent radius derived from the 2D projection of the particles is 0.91 +/- 0.79 mu m. A slightly improved equivalent radius based on the particle's volume coincides in the range of uncertainties with a value of 0.56 +/- 0.45 mu m. We note that those sizes and all following MIDAS particle size distributions are expected to be influenced by the fragmentation of MIDAS particles upon impact on the collection targets. Furthermore, fitting the slope of the MIDAS particle size distribution with a power law of a center dot r(b) yields an index b of similar to-1.67 to-1.88. Lastly, based on the created dust coverage maps and clustering maps of the MIDAS collection targets, we determined the particle fragmentation ratio of 4.09 for nominal activity and 11.8 for the outburst, which underlines that parent particles with faster impact velocity are more likely to be fragmented during dust collection.
Context. The MIDAS (Micro-Imaging Dust Analysis System) atomic force microscope on board the Rosetta comet orbiter investigated and measured the 3D topography of a few hundred of nm to tens of μm sized dust particles of 67P/Churyumov-Gerasimenko with resolutions down to a few nanometers, giving insights into the physical processes of our early Solar System. Aims. We analyze the shapes of the cometary dust particles collected by MIDAS on the basis of a recently updated particle catalog with the aim to determine which structural properties remained pristine. Methods. We develop a set of shape descriptors and metrics such as aspect ratio, elongation, circularity, convexity, and particle surface and volume distribution, which can be used to describe the distribution of particle shapes. Furthermore, we compare the structure of the MIDAS dust particles and the clusters in which the particles were deposited to those found in previous laboratory experiments and by Rosetta/COSIMA. Finally, we combine our findings to calculate a pristineness score for MIDAS particles and determine the most pristine particles and their properties. Results. We find that the morphological properties of all cometary dust particles at the micrometer scale are surprisingly homogeneous despite originating from diverse cometary environments (e.g., different collection targets that are associated with cometary activities/source regions and collection velocities/periods). There is only a weak trend between shape descriptors and particle characteristics such as size, collection targets, and cluster morphology. We next find that the types of clusters found by MIDAS show good agreement with those defined by previous laboratory experiments, however, there are some differences to those found by Rosetta/COSIMA. Furthermore, our pristineness score shows that almost half of MIDAS particles suffered severe alteration by impact, which indicates structural modification by impact (e.g., flattening and/or fragmentation) is inevitable despite the very low collection speeds (i.e., ~3–7 m s−1). Based on our result, we rate 19 out of 1082 MIDAS particles at least moderately pristine that is they are not substantially flattened by impact, not fragmented, and/or not part of a fragmentation cluster.
ABSTRACT Explanation of the observed gas activity based on the parameters of the comet’s nucleus is not an obvious matter. Solutions based on certain thermal models can be obtained, but the use of arbitrary values for poorly known model parameters is always required. In this work, we carry out a study of the dependence of gas activity on these parameters and assess the importance of each of them. We consider model porous dust layers of diverse structures. Solid state and gas thermal conductivities are examined to estimate the possible range of effective thermal conductivity. The simulation results are embedded in a thermal model, explicitly including a radiative thermal conductivity and a resistance of the dust layer against the gas flow. Sublimation of water ice and supervolatiles (CO2 and CO) is tested at different heliocentric distances. It is shown that when sublimation is the main energy sink, the role of uncertainties in the structure of the layer is small. As the relative contribution of sublimation decreases, the scatter of solutions reaches tens of per cent. The expected large uncertainties in the effective thermal conductivity can also significantly change the gas production. The analysis performed shows that, in spite of the parameter range having been narrowed down by results from the Rosetta mission, the unavoidable uncertainty in the values of some model parameters (e.g. thermal conductivity) blurs the theoretical simulation estimates. Instead of presenting a narrow set of specific solutions, it is desirable to analyse the entire range of possible solutions.
Introduction: The present abstract is intended to show the current ESA’s Planetary Science Archive (PSA) [1] in terms of architecture/infrastructure and the future interfaces and technologies which will be used in the next generation archive. These improvements range from a new graphical user interface developed in Angular to a TAP+ (Table Access Protocol) service as a single access to the data, through a new way of releasing new versions of the PSA more frequently to the scientific community. The PSA development team expects to release this new generation of the PSA this summer 2022. PSA current architecture: The PSA architecture and the technologies involved in its development have only undergone incremental updates in the last 6 years, and are now seen as somewhat obsolete. The front-end has been implemented using the Vaadin framework, which was initially a good strategy, but over time became onerous to maintain (e.g., dealing with JavaScript libraries, wasting time in wrapping some required extensions in Java). Also, from the back-end point of view, there are many interfaces/libraries to access the database (JDBC, PDAP, Data Distribution, etc) forcing us to double the effort when changing the API (see Figure 1: PSA current architecture) In addition, the PSA release approach has not followed a truly Agile approach, taking too long in releasing operationally. This is mainly due to the fact there is no a fully CI/CD strategy to be executed in the environments, leading to very manual release process with manual interventions. Also there are additional problems such as the synchronisation of the repositories when releasing, which strongly depends on the IT department. Figure 1: PSA current architecture New interfaces, technologies and infrastructure at PSA: After one year and half of development, the PSA development team has been able to achieve several goals on the roadmap to a new archive. Mainly, we will rely on a new graphical user interface implemented under the Angular framework (see Figure 2: Future PSA Graphical User Interface). There have been various reasons to migrate to this new technology: Faster development for maps visualisation and 3D interfaces, alignment within the ESDC department in a common front-end framework and also, the discontinuation of Vaadin 8 from March 2022 on. This future GUI will have a modern look and feel, with some relevant changes in line with the new ESA branding. Specially on the home view, where there are now card layouts to access the data from missions/instruments, targets and maps and a prototype traverse view for the ExoMars Rover mission, among other features. This new Angular framework has definitely sped the development up when modifying some JavaScript libraries, creating some end-to-end tests on top through Cypress, etc. This will also increase the performance on the client side consequently improving the user experience. In addition, this implementation is also mobile and tablet friendly/responsive. Figure 2: Future PSA Graphical User Interface Also, the new PSA will count on a single access point to the data through TAP+ (even private data) to homogenise the access by offering a single API, instead of using different interfaces/protocols (JDBC, PDAP, etc.) to access the information. In addition to these new interfaces, the PSA is making a huge effort to set up an infrastructure to support a faster deployment cycle in order to be more agile according to the scrum methodology. This implies integrating and deploying the software (after checking metrics in Sonar, passing the end-to-end tests, etc.) as nightly builds into a safe environment (pre-production) so that the Archive Scientists can test the latest features which, once approved, will go to the operational environment. This follows mostly a DEV-OPS infinite loop but having a middle environment (PRE) in which the scientists can safely test the features. Conclusion: The current PSA development team along with the Science Lead and all of the Archive Scientists are working together to produce a new generation of the planetary archive, with these features: * a more modern and responsive GUI based on a stable and well-known technology * a single access route to the data with authentication and authorization for private products (TAP+) * a new infrastructure of environments which allow a more efficient CI/CD so that the features can be validated earlier, allowing the PSA to offer releases in the operational environment more frequently. References: [1] Besse, S. et al. (2017) Planetary and Space Science, 10.1016/j.pss.2017.07.013, ESA's Planetary Science Archive: Preserve and present reliable scientific data sets. Acknowledgments: The authors would like to thank everybody, especially the PSA development team, who have contributed to the development of the PSA in the recent years and the incoming new generation of the archive.
Comets are generally considered to be relatively pristine objects, having spent most of their existence at large heliocentric distances where there is not enough energy to significantly transform these objects. Comets, therefore, offer a window into the early Solar System; their physical and chemical properties reflect the conditions in their formation environment [1]. Yet, most comets that have been visited by spacecraft are small-period comets that circle the Sun in 10 years or less, meaning that their surface is no longer as pristine as we would need to investigate their origins, having been modified by several processes such as impacts, sublimation, dust deposition and explosive outbursts over many orbits around the Sun. To learn about the early Solar System, we need to understand these evolution processes and recover the original conditions, and this requires building an exhaustive catalog of all types of changes that may have taken place, as well as the timeline of this evolution. ESA's Rosetta mission at comet 67P provides the perfect data set for such a task [2]. Having monitored the comet's surface for two years, across perihelion, Rosetta witnessed a handful of large-scale changes such as cliff retreat, the deflation of smooth terrains and the transport of large size blocks. A whole lot more took place on smaller scales: a careful examination of selected high-resolution images has shown thousands of changes on a 1-10 meter scale, including the formation of small pits, impacts, rolling and bouncing boulders. The most significant changes have been presented in several publications [3-9], as well as the connection between morphological evolution and activity [10,11]. However, more than 5 years after the end of the mission, we still lack a complete description of changes at all scales. This is a challenging task, because most transformations are small (meter-size or less), which means the associated surface features occupy only a few pixels in the high-resolution images returned by Rosetta (OSIRIS NAC [12]). Over the last years, we have started to systematically analyze images from different epochs, and developed specialized algorithms to assist in the detection of surface changes [13]. The results are promising, but only a subset of the data was analyzed, as the algorithm requires images to be co-aligned, a much time consuming step. In order to speed up the process and analyze the full surface, we have enlisted the help of thousands of comet enthusiasts through a citizen science project steered by ESA and Zooniverse. Volunteers are viewing pairs of OSIRIS images of the same region of the comet, taken before and after the perihelion passage, and we ask them to identify whether they see significant modifications between the two images, marking the areas that display changes in the two images with purposely-designed tools. Volunteers are also asked to label the type of change in the images. This will produce maps of changes and active areas on the comet’s surface, with labels for each type of change, from the visual inspection of many volunteers, enabling us to associate activity with surface modifications and thus develop new models linking the physics of comet activity to observed changes like lifted boulders and collapsed cliffs. The database created from this citizen science project will also be used to verify the results given by the change detection algorithm, and will provide an excellent training set for potentially new machine learning efforts. The project launched on the 5th of May 2022 and several thousands of classifications have already been performed by the first volunteers. We will monitor this collaborative work over the coming months and report on the first results at EPSC in September 2022. Rosetta Zoo project: https://www.zooniverse.org/projects/ellenjj/rosetta-zoo/ References: [1] Weissman et al, SSR (2020); [2] Taylor et al, MNRAS (2017); [3] Groussin et al, A&A (2015); [4] El Maarry et al, Science (2017); [5] Vincent et al, MNRAS (2017); [6] Birch et al, MNRAS (2017); [7] Pajola et al, NatAstro (2017); [8] Birch et al, GRL (2019); [9] Vincent et al, EPSC (2019); [10] El Maarry et al, ISSI/SSR (2020); [11] Vincent et al, ISSI/SSR (2020); [12] Keller et al, SSR (2007); [13] Vincent et al, EPSC (2021)
— In this paper, we develop previous studies that considered a free molecular gas flow through a dust porous mantle of a cometary nucleus. Before, we considered various types of both homogeneous and heterogeneous layers built of nonintersecting spheres, including the layers containing microscopic cracks and inner cavities. At the same time, data from the Rosetta space mission provide convincing evidence that the near-surface layer is composed of porous aggregates rather than homogeneous solids. In this study, we propose models, in which the layer is constructed of porous aggregates formed by ballistic agglomeration. The effective porosity of the model layers is in a range of the values resulting from the analysis of observations of comet Churyumov–Gerasimenko. With the test-particle method, we quantitatively estimated the distribution functions for the free paths, the layer’s permeability, and the other effective kinetic characteristics of sublimation products that passed through a nonisothermal porous layer. In addition, we estimated the volume adsorption of the visible solar light in the near-surface absorbing layer. For all of the considered transport characteristics, we present approximating expressions that may effectively be used in nonstationary thermophysical models of the physics of a cometary nucleus.
Introduction: The present abstract is intended to show the current ESA’s Planetary Science Archive (PSA) [1] in terms of architecture/infrastructure and the future interfaces and technologies which will be used in the next generation archive. These improvements range from a new graphical user interface developed in Angular to a TAP+ (Table Access Protocol) service as a single access to the data, through a new way of releasing new versions of the PSA more frequently to the scientific community. The PSA development team expects to release this new generation of the PSA this summer 2022. PSA current architecture: The PSA architecture and the technologies involved in its development have only undergone incremental updates in the last 6 years, and are now seen as somewhat obsolete. The front-end has been implemented using the Vaadin framework, which was initially a good strategy, but over time became onerous to maintain (e.g., dealing with JavaScript libraries, wasting time in wrapping some required extensions in Java). Also, from the back-end point of view, there are many interfaces/libraries to access the database (JDBC, PDAP, Data Distribution, etc) forcing us to double the effort when changing the API (see Figure 1: PSA current architecture) In addition, the PSA release approach has not followed a truly Agile approach, taking too long in releasing operationally. This is mainly due to the fact there is no a fully CI/CD strategy to be executed in the environments, leading to very manual release process with manual interventions. Also there are additional problems such as the synchronisation of the repositories when releasing, which strongly depends on the IT department.
Abstract The European Space Agency’s (ESA) Mars Express (MEX) mission to Mars has been returning valuable scientific data for ~18 years. This data is available to the public for free via the Planetary Science Archive (PSA), which houses the raw, calibrated, and higher-level data returned by the ESA’s planetary missions, including data provided by the various MEX instrument teams. The High Resolution Stereo Camera (HRSC) has provided several types of datasets throughout the mission, and its images have proven popular not only among scientists but also the public for the spectacular images of the red planet. A new version (version 4.0) of the radiometrically calibrated HRSC data has been made available which covers the entirety of the mission’s operation up to now. This new version utilizes an updated calibration, which is especially important for later images as it improves the adjustments for the aging of the instrument [1]. In addition to the new calibration, the data is now split into mission phases. Previous versions of the radiometrically calibrated data incorporated all observations into a single dataset, which led to increasing lag in some access methods as the dataset continued to grow in size and number of files. All this data and more can be accessed at the PSA at: https://archives.esac.esa.int/psa/ Introduction MEX was inserted into Mars orbit in December 2003, though several instrument test observations also exist from the cruise phase of the mission, prior to arrival at Mars. Thus, this long-lived Mars mission covers 18+ years of data with its 7 instruments. Later in the mission’s lifetime, the camera used for the Beagle 2 lander separation was reactivated and used for public outreach. Over time, the camera began to be used for scientific observations as well, making MEX an unusual mission in that it now has more scientific instruments in operation than it was launched with. The PSA user interface The ESA’s PSA uses the Planetary Data System (PDS) format developed by NASA to store the data from its various planetary missions. In the case of MEX, the data is stored in the PDS3 format, which primarily uses ASCII files to store and describe the data. Newer missions, from ExoMars onward use the PDS4 data standard, which uses XML files. There are three primary ways in which to find the data. One is the FTP area, which houses all the public data in the PSA. Here, there are no advanced search capabilities, but it does provide access to all the supporting files and documentation for the various datasets. When first searching for new data, users would benefit from using the Table View search interface [2]. Here the user can search using various parameters, such as mission name, target, instrument name, processing level, observation times, etc. The Table View is also linked to the Image View, where users can view the browse images provided by the PI teams. The Table View interface also has a section for “Free Search”, allowing one to use Contextual Query Language (CQL) to search over additional parameters. Finally, there is also a Map View for viewing the footprints of data from those instruments where such calculations can be of some utility. These various search methods rely in part on the metadata provided by the instrument teams in the labels associated with each of the data products, though the Map View also benefits from a homogenized approach to calculating geometrical parameters for all data across various missions. Conclusion The redelivery of the HRSC data provides an improved dataset with newer calibration factors applied. This data can be freely accessed at the ESA’s PSA, at https://archives.esac.esa.int/psa/. There are multiple ways of browsing the HRSC and other instrument teams’ data, including from other planetary missions, which will be explained in this poster. The development of the PSA’s user interface is an ongoing project, and we welcome feedback from the community for suggestions on new ways to search this wealth of data. Feedback and suggestions can be sent to psahelp@cosmos.esa.int. Acknowledgements The MEX Archive Scientist and the entire PSA team would like to extend their thanks to the HRSC team for their effort in updating previous deliveries and continuing to deliver new data from Mars to the public via ESA’s PSA. Our thanks go also to the European taxpayers, whose contributions to the European Space Agency enable the gathering and dissemination of this scientific knowledge, and preserving it for future generations of scientists to work on. References [1] Gwinner, K. et al.: The High Resolution Stereo Camera (HRSC) of Mars Express and its approach to science analysis and mapping for Mars and its satellites, Planetary and Space Science, Vol. 126, pp. 93-138, 2016. [2] Besse, S., Vallat, C., Barthelemy, M., Coia, D., Costa, M., De Marchi, G., Fraga, D., Grotheer, E., Heather, D., Lim, T., Martinez, S., Arviset, C., Barbarisi, I., Docosal, R., Macfarlane, A., Rios, C., Saiz, J., and Vallejo, F.: ESA’s Planetary Science Archive: Preserve and present reliable scientific data sets, Planetary and Space Science, Vol. 150, pp. 131-140, 2018.
The European Space Agency’s Planetary Science Archive (PSA) is the home for all scientific data from ESA’s planetary missions. Adopting the NASA PDS standard (version 3 and 4) it is designed to make the data, meta-data and knowledge on how to use them available to the scientific community. As a multi-mission archive, the PSA supports (or will soon support) over ten missions and their associated instruments, with this number expected to grow significantly in the coming years. The PSA has a long legacy of successfully preserving and distributing mission data to the community, and offers several services to fulfil this, including tabular, image-based and map-based interfaces, several APIs and traditional FTP. However, the entry barrier for new users is quite high, and moving forward there are new data access requirements coming from scientists wanting to perform more complex queries, run machine learning algorithms and so on. This presentation will describe the current infrastructure, recent updates and plans for the next few years which will try to address these changing needs. In particular, the following key developments are foreseen: * implementation of a new user interface, with a streamlined and more user-friendly design, which will also work well on mobile, and touchscreen displays, * improvements to APIs to include more data (specifically instrument geometry), and to incorporate the new PDS API which will allow access to any meta-data in the data products, leveraging the full value of the effort put in by instrument teams and archive scientists to curate them, * integration with ESA DataLabs, a project designed to “bring the code to the data” and allow data processing and analysis to be done in an interactive online environment hosted close to the data repository and allowing big data workflows without having to download the products, * publication of data tutorials based on open-source tools and libraries, to give new users a “quick start guide” to using data from a given instrument, and * a much higher frequency release cadence, responding to the needs of the scientific community in a timely manner. Finally, community input is sought on other improvements which could be made, and which use cases are not fulfilled by the current infrastructure.
ABSTRACT A hierarchical model of microstructure of cometary dust seems to accurately capture the morphological complexity of these particles as observed by the Rosetta mission to the 67P/Churyumov–Gerasimenko. The main aim of this work is to investigate how uncertainties in the knowledge of the microstructure of the surface layer affect our estimates of gas production. New models that incorporate scale of inhomogenieties in a sound theoretical framework are used for hierarchical dust layers. The studied layers are constructed in two steps: first we design ballistic aggregates as the building units and then, using these porous blocks, assemble the layers constrained by the known porosity range. The mean pore size and permeability are studied. Modelling is performed for various values of porosity, grain size, and layer thickness. The simulation results are embedded in the thermal model, explicitly including a radiation thermal conductivity and a resistance of the dust layer for the gas flow. It is shown that the average pore size is satisfactorily approximated by a linear function of the ratio of the effective porosity of the layer to the degree of filling. Simple fittings were obtained for the layer permeability. Our results indicate that in the expected range of nucleus porosity, the gas production rate is weakly dependent on the detailed layer microstructure, and appropriate effective values of homogeneous dust layers can be used to evaluate the gas activity. We also note that adding complex elements into the model yields unavoidable statistical uncertainties within several tens of per cent.
Introduction: With new missions being selected, missions moving to post-operations, and missions starting their journey to various targets in the Solar System, the European Space Agency’s Planetary Science Archive [1] (http://psa.esa.int) (PSA) is in constant evolution to support the needs of the projects and of the scientific community. Geometry as a key input for users: While analysing the various services that the PSA already offers, geometrical information was lacking in many ways. Feedback received by the users and the PSA User Group pointed to improvements in this area. During the past years, the PSA structured its internal architecture to provide excellent services to the community. Through external partnership, we developed the GEOmetry GENerator that allows a consistent way of deriving geometrical information. This input provides a solid foundation to develop Geographical Information System (GIS) services into the PSA. At the end of 2020, the PSA released its 3D and 2D interfaces for Mars Express and Rosetta, providing a new generation of geometrical services. Although currently focused on Mars and comet 67P/C-G, our architecture enables a rapid growth to support in particular BepiColombo and JUICE. High level products through the Guest Storage Facility: One of the other new service provided to the scientific community recently is the Guest Storage Facility (GSF), which allows users to store derived products. Products such as geological maps, Digital Terrain Models, new calibrated files, and others can be stored in the GSF in the format most used by the users. The philosophy of the GSF service is to impose minimum requirements on the data producers, while delivering maximum usability to the end users. Various products related to Titan and Mars are available in the GSF. Products related to the Moon, comet 67P/C-G and other targets are in preparation. Contact us to preserve your science! Interact with the PSA and expect more in the years to come: The PSA aims to build on the previous development to further enrich its services. New GIS interfaces related to Phobos, the Moon and Mars are in development to facilitate the searching capabilities on those targets. In parallel to those major developments, new functionalities will be developed to support ESA missions, in particular ExoMars, Mars Express, and BepiColombo. At the PSA we constantly interact with our users to ensure that our services are in line with the expectations and needs of the community (despite massive disruptions in 2019 and 2020). We encourage feedback from community scientists through: * PSA Users Group: A group of scientific experts advising the PSA on strategic development; * Direct interactions: Scientists from the PSA are available and eager to receive your comments and suggestions; * ESA missions: If you are part of a mission archiving its data at the PSA, tell us how your data should best be searched and used. Acknowledgments: The authors are very grateful to all the people who have contributed over the last 18 years to ESA's Planetary Science Archive. We are also thankful to ESA’s teams who are operating the missions and to the instrument science teams who are generating and delivering scientific calibrated products to the archive. References: [1] Besse, S. et al. (2017) Planetary and Space Science, 10.1016/j.pss.2017.07.013, ESA's Planetary Science Archive: Preserve and present reliable scientific data sets.
 Mannel T合作论文数22Roland Schmied合作论文数19
 Bruno Merin合作论文数ESAC Science Data Centre, European Space Agency16
 Klaus M. Torkar合作论文数15Jens Romstedt合作论文数ESTEC Noordwijk15
 Harald Jeszenszky合作论文数15
 Sebastien Besse合作论文数Department of Astronomy, University of Maryland14Jaime Saiz合作论文数13
 Tanya Louise Lim合作论文数Space Science Department;Rutherford Appleton Laboratory;Space Science Department|Rutherford Appleton Laboratory12Emmanuel Grotheer合作论文数11A. Montero合作论文数10R. Docasal合作论文数10David Heather合作论文数10Daniela Coia合作论文数9
 Jeremie Lasue合作论文数IRAP, Toulouse, France9Guido De Marchi合作论文数9Isa Barbarisi合作论文数9
 C. Snodgrass合作论文数Max-Planck-Institute for Solar System Research8J. Ruano合作论文数7Francisco Raga合作论文数7D. Fraga合作论文数7Silvia de Castro合作论文数7S. Merouane合作论文数7Jose Osinde合作论文数7
 Jürgen Blum合作论文数Institut fur Geophysik und Extraterrestrische Physik, Fakultat fur Elektrotechnik, Informationstechnik, Physik, Technische Universitat Braunschweig7Martin Hilchenbach合作论文数Max-Planck-Institut für Aeronomie, D-37191 Katlenburg-Lindau, Germany7
 Patrick Michel合作论文数Observatoire de la Côte d'Azur/French National Centre for Scientific Research7
 Gunter Kargl合作论文数7S. Martinez合作论文数6E. Grotheer合作论文数6C. Ríos合作论文数6Ruben Docasal合作论文数6
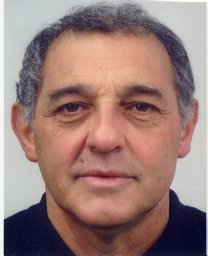 Wlodek Kofman合作论文数CEPHAG6Holger Sierks合作论文数6
 Mark Hofstadter合作论文数Jet Propulsion Laboratory, California Institute of Technology6
 Christophe Arviset合作论文数6C. Laantee合作论文数5D. Heather合作论文数5Peter Boakes合作论文数5
 Pierre Henri合作论文数5
 Thomas Cornet合作论文数5Weber Iris合作论文数5
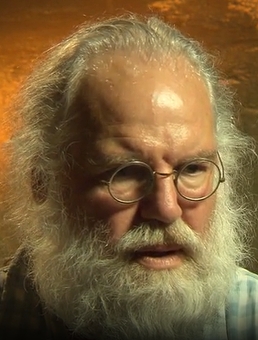 Fabrizio Capaccioni合作论文数Istituto di Astrofisica e Planetologia Spaziali, National Institute for Astrophysics5
 Christian Köberl合作论文数Department of Lithospheric Research, Faculty of Earth Sciences, Geography and Astronomy, University of Vienna5Marco Fulle合作论文数Osservatorio Astronomico di Trieste5Hermann Boehnhardt合作论文数5Jessica Agarwal合作论文数5
 Kathrin Altwegg合作论文数Center for Space and Habitability, Faculty of Science, University of Bern;Department of Space Research and Planetology, University of Bern5V. Della Corte合作论文数INAF – Osservatorio Astronomico di Capodimonte5




