This paper presents results from the Smart Healthy Campus 2.0 study/smartphone app, developed and used to collect mental health-related lifestyle data from 86 Canadian undergraduates January-August 2021. Objectives of the study were to 1) address the absence of longitudinal mental health overview and lifestyle-related data from Canadian undergraduate students, and 2) to identify associations between these self-reported mental health overviews (questionnaires) and lifestyle-related measures (from smartphone digital measures). This was a longitudinal repeat measures study conducted over 40 weeks. A 9-item mental health questionnaire was accessible once daily in the app. Two variants of this mental health questionnaire existed; the first was a weekly variant, available each Monday or until a participant responded during the week. The second was a daily variant available after the weekly variant. 6518 digital measure samples and 1722 questionnaire responses were collected. Mixed models were fit for responses to the two questionnaire variants and 12 phone digital measures (e.g. GPS, step counts). The daily questionnaire had positive associations with floors walked, installed apps, and campus proximity, while having negative associations with uptime, and daily calendar events. Daily depression had a positive association with uptime. Daily resilience appeared to have a slight positive association with campus proximity. The weekly questionnaire variant had positive associations with device idling and installed apps, and negative associations with floors walked, calendar events, and campus proximity. Physical activity, weekly, had a negative association with uptime, and a positive association with calendar events and device idling. These lifestyle indicators that associated with student mental health during the COVID-19 pandemic suggest directions for new mental health-related interventions (digital or otherwise) and further efforts in mental health surveillance under comparable circumstances.
A smart city leverages the Internet of Things (IoT to enhance citizens' lives. Real-tune management of massive data is a challenge. Smart cities are complex and interconnected, requiring interdisciplinary collaboration for urban planning, tor, and monitoring. This paper proposes a novel Model for Autonomic Smart City Management, aimed at the comprehensive management of diverse urban aspects, including environmental conditions and multi-layered infrastructure. Emphasizing continuous monitoring, data analysis, and real-time resource assessment, the system employs the MAPE-K approach for automated data processing, with the aim of reducing the need for human intervention. A novel aspect of the model is that it leverages and integrates existing IoT and monitoring platforms. The model introduces algorithms and policies with the aim of automating management activities and operations. The primary goal is to enhance urban efficiency, sustainability, and residents' quality of life while minimizing manual efforts and ensuring long-term cost savings.
Smart cities represent a paradigm shift in urban management, harnessing the power of the Internet of Things (IoT) to optimize various aspects of urban life. However, the management of the large number of devices and massive data generated by these interconnected systems poses significant challenges. Addressing this issue requires an integrated approach across urban planning, IoT, and monitoring domains. This paper introduces a policy-based autonomic management system for smart cities, aiming to tackle the real-time management of urban environments and infrastructure. Central to this approach is a focus on continuous monitoring, data analysis, and real-time resource assessment, drawing inspiration from the MAPE-K framework, with the goal of minimizing human intervention. The system integrates existing IoT and monitoring platforms and introduces policies to automate management operations. After defining the policies, the ASCMS utilizes those policies stored in a database to adapt to changing circumstances, effectively responding to events such as sensor offline status or CPU overuse. Additionally, its healing capabilities within the ecosystem are demonstrated, showcasing novel autonomy in managing smart city environments and infrastructure.
Diseases caused by slow and progressive damage are the leading cause of mortality. The stress experienced throughout the day can cause many illnesses, as it is responsible for diminishing the body's defenses. In such cases, prevention is a fundamental component achieved through monitoring individuals, usually through a process that heavily depends on human intervention. Therefore, developing solutions capable of automated monitoring becomes necessary to assist individuals in their daily lives. This work aims to promote individuals' health by monitoring them through smart wearable devices and providing notifications that enable them to learn more about themselves. The work focuses on developing a computational environment composed of wearable devices and an application integrated with a machine-learning model. This model predicts the user's heart rate data and generates notifications accordingly. The results show that real-time user monitoring is possible, and moments of stress can be identified using machine learning, leading to generating notifications.
Discovering where a driver looks and what they look at while driving can provide many benefits to improve driving safety in Advanced Driver Assistance Systems (ADAS). Toward this goal, we utilized a research vehicle equipped with a remote gaze tracker installed inside the vehicle and facing the driver and a LiDAR mounted on the roof of the vehicle. We introduce a novel approach for the cross-calibration of the gaze tracker with the LiDAR's system. We also propose a method to estimate the driver's Point of Gaze in the sparse LiDAR point cloud. In order to provide more information about the driver's attention, we introduce a technique to calculate the driver's visual attention area in the 3D space. We empirically demonstrate that our proposed multi-depth calibration-calibration approach yields excellent results to find the transformation matrix between a remote gaze tracker and LiDAR coordinate systems.
Social network analysis has been widely used in different application contexts. For example, in Global Software Development, where multiple developers with diverse skills and knowledge are involved, the use of social networking models helps to understand how these developers collaborate. Finding experts who can help address critical elements or issues in a project is a challenging and critical task. It is especially true in the context of Global Software Development projects, where developers with specific skills and knowledge often need to be identified. In this sense, searching for essential members is a valuable task, as they are fundamental to the evolution of the network. This article proposes a broad solution for syntactic and semantic analysis in social networks in the Global Software Development context. In this solution, we define a model for the social network capable of capturing collaboration between developers, incorporate strategies for temporal analysis of the network, explore the network using machine learning algorithms, and propose an ontology to enrich the data semantically. We conducted three case studies using data extracted from GitHub to evaluate the proposed approach. The case studies provide evidence that our proposed method can identify specialists, highlighting their expertise and importance to the evolution of the social network.
There is evidence that shows that the majority of all vehicle accidents are caused by human error. This has been the major motivation for advancements in Advanced Driving Assistance Systems (ADAS). A driver's gaze can provide valuable information about the focus and intention of a driver. Therefore, determining the degree of driver awareness and scene perception, and predicting driver intentions can be valuable in the next generation of ADAS. To this end, we have instrumented a vehicle with a front-facing stereoscopic vision system on the roof of the vehicle and a camera gaze tracking system pointing toward the driver's face. These are two completely different systems with dissimilar sensing modalities. Data is collected separately from these systems and when calibrated can be used to estimate the Point-of-Gaze (PoG) of the driver. We present an efficient approach for the cross-calibration of the gaze tracker with the stereoscopic vision system. The experimental results show that our proposed cross-calibration technique obtains promising results for estimating Point-of-Gaze (PoG).
LiDAR is one of the most used sensors in many areas like robotics, self-driving cars, and advanced driving assistance systems due to providing an accurate point cloud of the surroundings. However, to cope with challenges in perceiving the environment around a vehicle, LiDAR data is often combined with data from other sensors. Thermal cameras can provide complementary information that can be beneficial, especially for detecting pedestrians and seeing at nighttime and in fog, dust, etc. In this paper, we propose an algorithm for the extrinsic calibration of a thermal camera and a LiDAR sensor in a vehicle. First, one or more thermal image-point cloud pairs of our designed calibration target are collected. Then line and plane equations of the target’s edges and plane in both data modalities are found. Finally, the algorithm uses lines and plane correspondences to cross-calibrate the sensors. The proposed method obtains good results with one or more poses. We also show that it works well with sparse LiDAR data. Several experiments are presented to illustrate the effectiveness of the method.
Nowadays, computing applications operate in environments with multiple and heterogeneous data sources, such as data generated from IoT devices. Without contextual information, the information derived from these isolated data sources may cause bias, error, or a lack of correct comprehension. Data integration can help to promote a holistic view of data and support getting the most trustful meaning from the information. This work proposes an architecture in which ontologies help to provide context for data integration. Furthermore, ontologies and complex network concepts enrich context awareness and derive relations among data to identify events of interest. The approach is evaluated in a controlled experiment using real data from hydrological and hydrometric sensors. The results indicate it is possible to detect context and relate events from different data sources to new significant events through ontology and graph network analysis.
A driver’s actions and intent can be factors in enabling advance driver assistance systems (ADASs) to assist drivers and avoid accidents. A driver’s gaze can provide insight into the driver’s intent or awareness of situations. Knowing that a driver gazed at a traffic sign or missed a traffic could provide indications of whether the driver is alert to impending changes in the driving environment, such as curves and stop signs. For ADASs to determine the importance of a driver seeing or missing a sign, it is important to understand the driving environment and situation. A first step is to understand what signs drivers do see or miss while driving. This contribution presents the results of analyzing driving sequences to assess traffic signs that drivers may or may not have gazed upon. The results suggest that drivers may miss 20% of traffic signs though the percentage varies depending on the type of sign. The analysis uses image sequences of the driving environment and gazes data captured during driving. The methods used in our analysis included determining whether a driver’s gaze has fallen on the image of a traffic sign or not and subsequently determining signs missed during driving. The methods presented can be useful in other scenarios involving the analysis of driver gaze and have implications for the design of future ADASs and for understanding of driver gaze and awareness.
Applications capable of integrating data from historical and streaming sources can make the most contextualized and enriched decision-making. However, the complexity of data integration over heterogeneous data sources can be a hard task for querying in this context. Approaches that facilitate data integration, abstracting details and formats of the primary sources can meet these needs. This work presents a framework that allows the integration of streaming and historical data in real-time, abstracting syntactic aspects of queries through the use of SQL as a standard language for querying heterogeneous sources. The framework was evaluated through an experiment using relational datasets and real data produced by sensors. The results point to the feasibility of the approach.
The direction of a driver’s visual attention plays a crucial role in the context of Advanced Driver Assistance Systems (ADASs) and semi-autonomous driving. The way a driver monitors traffic scene objects partially indicates the level of driver awareness. We propose an analytical method to estimate a driver’s average traffic scene attention based on the attentional visual field of the driver in urban and suburban areas. Three metrics are proposed to estimate a driver’s average attention. Our model is capable of identifying driver attention with respect to traffic objects including vehicles, traffic lights, traffic signs, and pedestrians within the attentional visual field of the driver at any moment while in the act of driving.
The ubiquitous use of smartphones, smart devices, and low-cost sensors, has fostered much attention around the Internet of things (IoT). The Internet of Things has led to the manufacturing of more IoT-related products ranging from devices to applications. The sensors in an IoT network provide data on the environment in which they are deployed and interact with other devices and the applications in the broader IoT ecosystem. IoT components do not necessarily adhere to the same standard and so can be very heterogeneous in a particular environment. This can create challenges in the collection and monitoring of heterogeneous data in real-time as well as monitoring the infrastructure itself. Such data collection is not only important for the analysis of the environment but also for monitoring the health of the devices and operational components, such as software elements. In this paper, we introduce an architecture aimed at collecting, visualizing, and monitoring streams of data from sensors and from infrastructure components. The ThingsBoard IoT platform is used for data collection and visualization. Node-Red is used to categorize the data on the sensor name. Experiments using sensor data sets are provided to illustrate the approach, processing, and visualization.
Academic Research Computing Clouds are widely deployed worldwide by research institutions to support researcher's computations. While the nature of the hosted use-cases is diverse, literature and institutions' published guides point to highly parallel HPC workloads and state-heavy workloads as two popular use-cases in research-computing clouds. Additionally, our prior investigation has uncovered unique patterns in the users' VM-provisioning behaviors in four of Canada's research-computing clouds. These patterns, i.e., usage-trends, were generated by examining nearly 1 million VMs created by researchers over four and half years. The usage trends mimicked behaviors of provisioning highly parallel HPC workloads and state-heavy portals. In this paper, we exploit the knowledge of these usage trends to guide VM placement decisions in research-computing IaaS clouds. We propose a delayed-provisioning algorithm that postpones resource allocations for incoming VM requests in anticipation of running VMs termination, minimizing the number of active PMs and PM underutilization. We examine the performance of the proposed algorithm compared to other placement algorithms using a real-life validation dataset of nearly 850 thousand VMs. The results show significant improvements ranging from 7% to 33% reduction in the number of active PMs and up to 61% reduction in the number of hourly underutilized PMs.
Background Undergraduate studies are challenging, and mental health issues can frequently occur in undergraduate students, straining campus resources that are already in demand for somatic problems. Cost-effective measures with ubiquitous devices, such as smartphones, offer the potential to deliver targeted interventions to monitor and affect lifestyle, which may result in improvements to student mental health. However, the avenues by which this can be done are not particularly well understood, especially in the Canadian context. Objective The aim of this study is to deploy an initial version of the Smart Healthy Campus app at Western University, Canada, and to analyze corresponding data for associations between psychosocial factors (measured by a questionnaire) and behaviors associated with lifestyle (measured by smartphone sensors). Methods This preliminary study was conducted as an observational app-based ecological momentary assessment. Undergraduate students were recruited over email, and sampling using a custom 7-item questionnaire occurred on a weekly basis. Results First, the 7-item Smart Healthy Campus questionnaire, derived from fully validated questionnaires—such as the Brief Resilience Scale; General Anxiety Disorder-7; and Depression, Anxiety, and Stress Scale–21—was shown to significantly correlate with the mental health domains of these validated questionnaires, illustrating that it is a viable tool for a momentary assessment of an overview of undergraduate mental health. Second, data collected through the app were analyzed. There were 312 weekly responses and 813 sensor samples from 139 participants from March 2019 to March 2020; data collection concluded when COVID-19 was declared a pandemic. Demographic information was not collected in this preliminary study because of technical limitations. Approximately 69.8% (97/139) of participants only completed one survey, possibly because of the absence of any incentive. Given the limited amount of data, analysis was not conducted with respect to time, so all data were analyzed as a single collection. On the basis of mean rank, students showing more positive mental health through higher questionnaire scores tended to spend more time completing questionnaires, showed more signs of physical activity based on pedometers, and had their devices running less and plugged in charging less when sampled. In addition, based on mean rank, students on campus tended to report more positive mental health through higher questionnaire scores compared with those who were sampled off campus. Some data from students found in or near residences were also briefly examined. Conclusions Given these limited data, participants tended to report a more positive overview of mental health when on campus and when showing signs of higher levels of physical activity. These early findings suggest that device sensors related to physical activity and location are useful for monitoring undergraduate students and designing interventions. However, much more sensor data are needed going forward, especially given the sweeping changes in undergraduate studies due to COVID-19.
The complexity imposed by data heterogeneity makes it difficult to integrate 'streaming x streaming' and 'streaming x historical' data types. For practical analysis, the enrichment and contextualization process based on historical and streaming data would benefit from approaches that facilitate data integration, abstracting details and formats of the primary sources. This work presents a framework that allows the integration of streaming data and historical data in real-time, abstracting syntactic aspects of queries through the use of SQL as a standard language for querying heterogeneous sources. The framework was evaluated through an experiment using a relational database and real data produced by sensors. The results point to the feasibility of the approach.
Despite its vast potential, a challenge facing serverless computing's wide-scale adoption is the lack of Service Level Agreements (SLAs) for serverless platforms. This challenge is compounded when composition technologies are employed to construct large applications using chains of functions. Due to the dependency of a chain's performance on each function forming it, a single function's sub-optimal performance can result in performance degradations of the entire chain. This paper sheds light on this problem and provides a categorical classification of the factors that impact a serverless function execution performance. We discuss the challenge of serverless chains' SLA and present the results of leveraging FaaS2F, our proposed serverless SLA framework, to define SLAs for fixed-size and variable-size sequential serverless chains. The validation results demonstrate high accuracy in detecting sub-optimal executions exceeding 79%.
 H. L. Lutfiyya合作论文数Department of Computer Science
University of Western Ontario
43
H. L. Lutfiyya合作论文数Department of Computer Science
University of Western Ontario
43 James Wonki Hong合作论文数Dept. of Computer Science and Engineering30Michael J. Katchabaw合作论文数Department of Computer Science
The University of Western Ontario23
James Wonki Hong合作论文数Dept. of Computer Science and Engineering30Michael J. Katchabaw合作论文数Department of Computer Science
The University of Western Ontario23 Steven S. Beauchemin合作论文数Department of Computer Science;The University of Western Ontario23
 Jinhui Qin合作论文数University of Western Ontario16
 Mario A. R. Dantas合作论文数Federal University of Santa Catarina, Department of Informatics and Statistics, Laboratory of Research in Distributed Systems, Florianopolis, Brazil14
 Patrick Finnigan合作论文数IBM Toronto Software Solutions Lab13
 Femida Gwadry-Sridhar合作论文数13
 J. Slonim合作论文数Faculty of Computer Science
Dalhousie University13Raphael M. Bahati合作论文数11
J. Slonim合作论文数Faculty of Computer Science
Dalhousie University13Raphael M. Bahati合作论文数11 Tighe, M.合作论文数Dept. of Comput. Sci., Univ. of Western Ontario;c;Dept. of Comput. Sci., Univ. of Western Ontario10Elvis M. Vieira合作论文数9J. Michael Bennett合作论文数9
 Victor Stroele合作论文数8Nathaniel Sherry合作论文数8Andrew D. Marshall合作论文数8DL Erickson合作论文数7
 Regina M. M. Braga合作论文数Computer Science Department, CTU/UFJF7
 Gastón Keller合作论文数7N. Coburn合作论文数7
 Per-Åke Larson合作论文数David R. Cheriton School of Computer Science, University of Waterloo7Hasina Abdu合作论文数Department of Computer and Information Science, The University of Michigan-Dearborn7
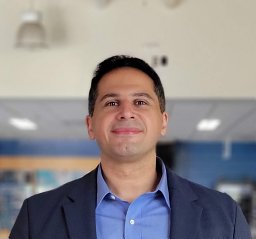 Mohamed Elsakhawy合作论文数Univ Western Ontario, Dept Comp Sci, London, ON N6A 5B7, Canada6
 N. Stewart McIntyre合作论文数The Department of Chemistry, Western University6Stephen L. Howard合作论文数5
 Peng Dai合作论文数Amazon Inc.5
 Shirpour, M.合作论文数Dept. of Comput. Eng., Sharif Univ. of Technol.;c;Dept. of Comput. Eng., Sharif Univ. of Technol.5H. Keith Edwards合作论文数5
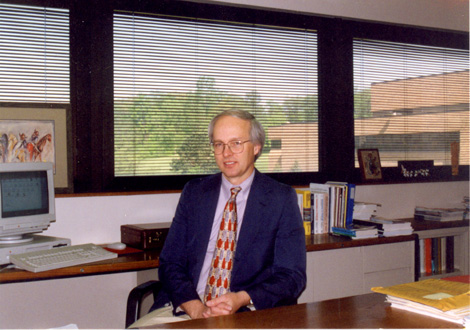 Toby J. Teorey合作论文数 University of Michigan;Engineering;Academic Programs5
 Michael Borrie合作论文数5Deirdre Fetherstonhaugh合作论文数Australian Centre for Evidence Based Aged Care, La Trobe University5
 Emily Haesler合作论文数5S. M. Zabihi合作论文数4Farzan Heidari合作论文数4
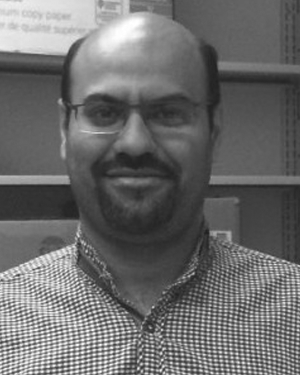 Nima Khairdoost合作论文数4Yelena Kropivnitskaya合作论文数4Chris Brogly合作论文数Faculty of Information and Media Studies, Western University4N Stewart Mcintyre合作论文数University of Western Ontario4
 Kristy F. Tiampo合作论文数4
 Dan Lizotte合作论文数Department of Computer Science, Western University;Department of Epidemiology and Biostatistics, Western University;Rotman Institute of Philosophy, Western University4Ester Matias合作论文数4Omid Mola合作论文数4
 Rhonda Nay合作论文数4Taha Kowsari合作论文数4Taufiq Rahman合作论文数3Patrick Martin合作论文数3Benoit Lewden合作论文数3Farhad Dalirani合作论文数3Jefferson Amará合作论文数3




