Audio recordings from inside honey beehives can provide significant information about the health and build-up status of the hives. Bees emit important bioacoustic indicators, such as auditory piping signals, which can play a significant role in determining the growth and health status of the hive. As part of the Appalachian Multipurpose Apiary Informatics System (AppMAIS) project, we have installed microphones inside 28 beehives in the Western region of North Carolina. Several of these hives have swarmed over the past two years, allowing us to collect a multitude of recordings containing piping. Using this data, we have trained a piping detector convolutional neural network (CNN), which can function with high accuracy across three unique hives. This article provides details regarding the acoustic properties of the relevant subclasses of piping signals and the design and implementation of a piping classifier.
There are three types of honey bees in a honey beehive: a queen that maintains the population, worker bees that are female and take care of all the tasks in a hive, and a small number of drones that are all male and do not participate in any day-to-day activities in a hive. The majority of the eggs laid by a healthy queen are fertilized and will become worker bees. Many factors can determine the health of a honey beehive. A healthy queen controls the number of drone eggs, ensuring a healthy ratio of the drones to worker bees in the hive. Sometimes, a queen lays an abnormally large number of drone eggs, indicating that the queen may not have been appropriately mated. Also, in the absence of a queen, a worker bee may start laying unfertilized eggs, which will all become drones. Because drones do not take care of any task in a hive and require constant care by the worker bees, having too many of them will result in the collapse of the hive. It is essential to monitor the hives to ensure a healthy ratio of drones to worker bees. This paper presents the result of our approach to estimating such a ratio with a reasonable level of accuracy using the You Only Look Once (YOLO) machine-learning algorithm.
Honey bees are vital to our food chain as they efficiently pollinate many crops and fruits. With the collapse of an alarming number of honey beehives in recent years, there has been a substantial need for regular monitoring of their health status and population growth. Traditionally, beekeepers have manually examined their hives to assess health and growth rates. Traffic in and out of hives provides significant information about the hive's health status and population size. The Appalachian Multi-purpose Apiary Informatics System (AppMAIS) project obtains video recordings at the entrance of 28 hives in the Western region of North Carolina, USA and 3 hives in Belgium. This has allowed us to automate the estimation of traffic at the entrance of the hives using Image Processing and Machine Learning tools. This paper provides details on the YOLO-based and Optical Flow-based approaches we have utilized to estimate the traffic in and out of these hives. With an error of only 17 bees in our estimation models, our early results have been promising. Automated traffic monitoring can significantly reduce the number of required manual hive inspections.
A large number of honey beehives have been lost in recent years due to causes that are often collectively referred to as Colony Collapse Disorder. Due to the importance of honey bees in the food chain as one of the most efficient pollinators, there has been a notable growth in research involving precision apiculture. Our project, Appalachian Multi-purpose Apiary Informatics System (AppMAIS), was funded to establish 24 hives at 12 locations in Western North Carolina in order to collect data such as: humidity, temperature, weight, video, and audio recordings for monitoring purposes. By taking into account several key bioacoustic hive health indicators previously identified by the Apiary research community, we sought to identify the collapse of beehives primarily via the auditory domain. This paper provides some of the preliminary results for the audio analysis portion of the project (specifically unsupervised anomaly detection) via the use of Non-Negative Matrix Factorization (NMF) based approaches and an ensemble Minimum Covariance Determinant (MCD) estimator.
Offensive words appear in Wordwheel-type puzzles with a high frequency. Previous approaches to eliminating these words have focused largely on eliminating puzzles that might give rise to an offensive word. This work presents a fast, heuristic approach to detecting an offensive word within a puzzle. After a preprocessing stage, the detection occurs with a single bitwise operation on a 64-bit word. Tests show that as long as there are at least 3 taboo words possible in a puzzle, the heuristic approach is faster than a depth-first search of the puzzle. In addition to being fast, the approach is guaranteed to detect all offensive words, and has a low false positive rate..
There are three types of bee in a honey bee hive: one queen which is in charge of laying eggs and controlling the population of the hive, a large number of worker bees that are all female and hold various responsibilities to maintain the entire hive, and a small number of drones (about 2-3%) that are male and their sole job is to mate with queens and spread the genetics of their hive in rare successful mating flights. There are various reasons for having a larger than normal number of drones which may cause a hive to collapse. Among the reasons for having too many drones are: a bad queen or a worker bee laying unfertilized eggs. It is important that the number of drones be monitored carefully as that can provide a good indication of the health of a hive. In order to monitor the number of drones, we use a hive monitoring system called Beemon that is created in the Visual and Image Processing (VIP) lab in our department. This system allows beekeepers and researchers to monitor their hives and will aid them in detecting potential problems within their hives. Deviations from a normal pattern can signify problems within the hive that are preventable by immediate action. In this paper, we will provide the technical details on a computer vision program aimed at estimating the number of drone bees in videos that are taken in front of several honey bee hives. The program estimates the number of drones to assist the beekeepers learn about the possible deviations as they occur. This program utilizes Python and OpenCV to classify bees in videos by applying motion detection and background subtraction methods. Using the two methods in conjunction aids in suppressing error in bee detection in cases in which the hive has a high amount of traffic. This paper will share some of the early results for several hives.
Honey bees are dying at an alarming rate due to Colony Collapse Disorder (CCD). Monitoring honey beehives using the audio and video recordings obtained from the beehives has been made possible with the availability of embedded systems such as Raspberry Pis. Conveniently analyzing a large number of audio files obtained from the hives is challenging but can provide an opportunity to learn about the behavior of the bees. BeePhon is a system of tools developed to enable exploratory analysis of audio recordings, taken from inside honey beehives, and efficiently annotate them. It primarily consists of a web-application user interface for performing Nonnegative Matrix Factorization (NMF). Labeled data and components are stored in a database and can be used to improve subsequent decompositions. Using this system we annotated over 2000 audio files in four months.
This article explores the relationship between gesture and content on the social media platform Facebook. Analyzing the results of a digital content analysis of more than 1,600 posts from the Roatan Marine Park's Facebook page, this study reports the significant correlations found between various types of content, media, and engagement gestures. Findings suggest there is a relationship between content and gesture on Facebook, but what triggers stakeholders to "like" and "comment" on content is different from what triggers them to share content. The study concludes with six applications of these findings relevant to practitioners working with nonprofit organizations on Facebook.
High-grade serous carcinoma (HGSC) is the most common and deadliest form of ovarian cancer. Yet it is largely asymptomatic in its initial stages. Studying the origin and early progression of this disease is thus critical in identifying markers for early detection and screening purposes. Tissue-based mass spectrometry imaging (MSI) can be employed as an unbiased way of examining localized metabolic changes between healthy and cancerous tissue directly, at the onset of disease. In this study, we describe MSI results from Dicer-Pten double-knockout (DKO) mice, a mouse model faithfully reproducing the clinical nature of human HGSC. By using non-negative matrix factorization (NMF) for the unsupervised analysis of desorption electrospray ionization (DESI) datasets, tissue regions are segregated based on spectral components in an unbiased manner, with alterations related to HGSC highlighted. Results obtained by combining NMF with DESI-MSI revealed several metabolic species elevated in the tumor tissue and/or surrounding blood-filled cyst including ceramides, sphingomyelins, bilirubin, cholesterol sulfate, and various lysophospholipids. Multiple metabolites identified within the imaging study were also detected at altered levels within serum in a previous metabolomic study of the same mouse model. As an example workflow, features identified in this study were used to build an oPLS-DA model capable of discriminating between DKO mice with early-stage tumors and controls with up to 88% accuracy.
In this experience report, we experiment with a text classification pipeline, attempting to validate a model that will automatically classify texts culled from Facebook. We performed 10-fold cross-validation on the training set using a variety of parameter values. For each fold we used 9/10 of the training data to train a model and then tested it with the remaining 1/10 of the data, repeating 10 times and averaging the performance. We offer four recommendations for researchers facing similar challenges in semi-automating text extraction and classification.
Tree identification is an important task in biological research. Since not all biologists are qualified for this task and experts are not accessible all the time, an application to assist in plant identification would be extremely useful. This paper describes an application classifies the type of a tree based on a picture of one of its leaves. The system developed for this research utilizes a convolutional neural network in an android mobile application to classify natural images of leaves.
The number of honey bees entering and leaving the hive throughout the day is an important metric for beekeepers. Some commercial systems that utilize infrared sensors at the hive's entrance exist for monitoring honeybee traffic. This research explores a solution that is based on visual information obtained through videos taken in front of the hives. This paper describes a system for surveillance based on traditional object detection and tracking methods. The project compares results from different algorithms within the system and discusses how the performance of the system can be effectively evaluated.
Students increasingly decide to go to college in order to get better jobs and make more money. However, these advantages are typically thwarted if a student fails to graduate. Although much research has been aimed at predicting college performance using data collected before entering college, this preliminary work focuses on how college-level data could be used to inform student decision making. This work acquired historical class grades, test scores, and degree information for all students who have taken any computer science classes at Appalachian State University. This poster presents a web application that allows users to explore these data by selecting a target activity such as a class, and filtering students based on test scores, degrees, or how they have performed in other classes. The application displays overlaid histograms comparing how students in the subset perform relative to the class as a whole. For example, when a student considers retaking a course they may find it useful to know how other students with similar grades have performed in the major. For example, among the 29 attempts by 22 students with a 'C' in discrete math and CS 1, only 10 earned the required 'C' in CS 2 (35%) and 12 failed the course (41%). Three of these students went on to graduate with a degree in computer science (14%) and six in computer information systems (27%) while five did not graduate from Appalachian (23%).
Our department received funding from the National Science Foundation to establish a three-year Research Experience for Teachers site in Data Analysis & Mining, Visualization, and Image Processing. The objective is to provide twelve in-service high school teachers and community college faculty to work with faculty mentors and their graduate and undergraduate assistants to conduct research in these fields. During this six-week summer program, participants gain skills that they can utilize to assist their students to solve interdisciplinary problems. In addition, participants design learning modules to teach STEM concepts in their courses. The goal of our program is for teachers to bring knowledge of computer science and its application to their classroom exposing their students to computer science. This paper will share some of the activities of this experience.
We present omniSpect, an open source web- and MATLAB-based software tool for both desorption electrospray ionization (DESI) and matrix-assisted laser desorption ionization (MALDI) mass spectrometry imaging (MSI) that performs computationally intensive functions on a remote server. These functions include converting data from a variety of file formats into a common format easily manipulated in MATLAB, transforming time-series mass spectra into mass spectrometry images based on a probe spatial raster path, and multivariate analysis. OmniSpect provides an extensible suite of tools to meet the computational requirements needed for visualizing open and proprietary format MSI data.
We propose a similarity measure based on the multivariate hypergeometric distribution for the pairwise comparison of images and data vectors. The formulation and performance of the proposed measure are compared with other similarity measures using synthetic data. A method of piecewise approximation is also implemented to facilitate application of the proposed measure to large samples. Example applications of the proposed similarity measure are presented using mass spectrometry imaging data and gene expression microarray data. Results from synthetic and biological data indicate that the proposed measure is capable of providing meaningful discrimination between samples, and that it can be a useful tool for identifying potentially related samples in large-scale biological data sets.
Background: Population inference is an important problem in genetics used to remove population stratification in genome-wide association studies and to detect migration patterns or shared ancestry. An individual's genotype can be modeled as a probabilistic function of ancestral population memberships, Q, and the allele frequencies in those populations, P. The parameters, P and Q, of this binomial likelihood model can be inferred using slow sampling methods such as Markov Chain Monte Carlo methods or faster gradient based approaches such as sequential quadratic programming. This paper proposes a least-squares simplification of the binomial likelihood model motivated by a Euclidean interpretation of the genotype feature space. This results in a faster algorithm that easily incorporates the degree of admixture within the sample of individuals and improves estimates without requiring trial-and-error tuning.Results: We show that the expected value of the least-squares solution across all possible genotype datasets is equal to the true solution when part of the problem has been solved, and that the variance of the solution approaches zero as its size increases. The Least-squares algorithm performs nearly as well as Admixture for these theoretical scenarios. We compare least-squares, Admixture, and FRAPPE for a variety of problem sizes and difficulties. For particularly hard problems with a large number of populations, small number of samples, or greater degree of admixture, least-squares performs better than the other methods. On simulated mixtures of real population allele frequencies from the HapMap project, Admixture estimates sparsely mixed individuals better than Least-squares. The least-squares approach, however, performs within 1.5% of the Admixture error. On individual genotypes from the HapMap project, Admixture and least-squares perform qualitatively similarly and within 1.2% of each other. Significantly, the least-squares approach nearly always converges 1.5- to 6-times faster.Conclusions: The computational advantage of the least-squares approach along with its good estimation performance warrants further research, especially for very large datasets. As problem sizes increase, the difference in estimation performance between all algorithms decreases. In addition, when prior information is known, the least-squares approach easily incorporates the expected degree of admixture to improve the estimate.
Coral reefs are in global decline, with seaweeds increasing as corals decrease. Although seaweeds inhibit coral growth, recruitment, and survivorship, the mechanism of these interactions is poorly understood. Here, we used field experiments to show that contact with four common seaweeds induces bleaching on natural colonies of Porites rus . Controls in contact with inert, plastic mimics of seaweeds did not bleach, suggesting seaweed effects resulted from allelopathy rather than shading, abrasion, or physical contact. Bioassay-guided fractionation of the hydrophobic extract from the red alga Phacelocarpus neurymenioides revealed a previously characterized antibacterial metabolite, neurymenolide A, as the main allelopathic agent. For allelopathy of lipid-soluble metabolites to be effective, the compounds would need to be deployed on algal surfaces where they could transfer to corals on contact. We used desorption electrospray ionization mass spectrometry (DESI-MS) to visualize and quantify neurymenolide A on the surface of P . neurymenioides , and we found the molecule on all surfaces analyzed, with highest concentrations on basal portions of blades.
Background Selecting an appropriate classifier for a particular biological application poses a difficult problem for researchers and practitioners alike. In particular, choosing a classifier depends heavily on the features selected. For high-throughput biomedical datasets, feature selection is often a preprocessing step that gives an unfair advantage to the classifiers built with the same modeling assumptions. In this paper, we seek classifiers that are suitable to a particular problem independent of feature selection. We propose a novel measure, called "win percentage", for assessing the suitability of machine classifiers to a particular problem. We define win percentage as the probability a classifier will perform better than its peers on a finite random sample of feature sets, giving each classifier equal opportunity to find suitable features. Results First, we illustrate the difficulty in evaluating classifiers after feature selection. We show that several classifiers can each perform statistically significantly better than their peers given the right feature set among the top 0.001% of all feature sets. We illustrate the utility of win percentage using synthetic data, and evaluate six classifiers in analyzing eight microarray datasets representing three diseases: breast cancer, multiple myeloma, and neuroblastoma. After initially using all Gaussian gene-pairs, we show that precise estimates of win percentage (within 1%) can be achieved using a smaller random sample of all feature pairs. We show that for these data no single classifier can be considered the best without knowing the feature set. Instead, win percentage captures the non-zero probability that each classifier will outperform its peers based on an empirical estimate of performance. Conclusions Fundamentally, we illustrate that the selection of the most suitable classifier ( i.e ., one that is more likely to perform better than its peers) not only depends on the dataset and application but also on the thoroughness of feature selection. In particular, win percentage provides a single measurement that could assist users in eliminating or selecting classifiers for their particular application.
 May Dongmei Wang合作论文数Bio-Medical Informatics and Bio-Imaging Laboratory, Wallace H. Coulter Department of Biomedical Engineering, College of Engineering, Georgia Institute of Technology;Bio-Medical Informatics and Bio-Imaging Laboratory, Wallace H. Coulter Department of Biomedical Engineering, School of Medicine, Emory University18
 Rahman Tashakkori合作论文数Appalachian State University9
 Irfan Essa合作论文数School of Interactive Computing, College of Computing, Georgia Institute of Technology;Interdisciplinary Research Center for Machine Learning, Georgia Institute of Technology;Google Inc.8
 Facundo M Fernández合作论文数Georgia Inst Technol, Sch Chem & Biochem, Atlanta, GA 30332 USA6
 Richard Moffitt合作论文数Department of Hematology and Medical Oncology, School of Medicine, Emory University5
 Nickolas Faust合作论文数Stantec5
 Todd H. Stokes合作论文数Emory University School of Medicine4
 Andrew N. Young合作论文数4Asiri S. Galhena合作论文数Department of Biochemistry and Molecular Biophysics, University of Arizona4
 John H. Phan合作论文数The Wallace H. Coulter Department of Biomedical Engineering, Georgia Institute of Technology and Emory University4Rachel V Bennett合作论文数2
 Chris Campell合作论文数2
 Sarah Beth Hopton合作论文数2
 Kaddi Chanchala合作论文数Department of Biomedical Engineering, Georgia Institute of Technology2
 Mark E. Hay合作论文数School of Biological Sciences, College of Sciences, Georgia Institute of Technology;Institute of Applied Sciences, University of the South Pacific2
 Julia Kubanek合作论文数School of Chemistry and Biochemistry, College of Sciences, Georgia Institute of Technology;School of Biological Sciences, College of Sciences, Georgia Institute of Technology2
 Gili Weinberg (Gil Weinberg)合作论文数School of Music, College of Design, Georgia Institute of Technology;Institute for Robotics and Intelligent Machines, Georgia Institute of Technology2Brendan Hannigan合作论文数BS in Computer Science, Texas A and M University2Yachna Sharma合作论文数Electrical and Computer Engineering;Georgia Institute of Technology;Electrical and Computer Engineering, Georgia Institute of Technology2
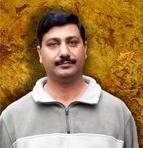 Qaiser Chaudry合作论文数Electrical and Computer Engineering;Georgia Institute of Technology;Electrical and Computer Engineering, Georgia Institute of Technology2James H. Torrance合作论文数2
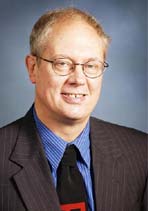 William Ribarsky合作论文数Department of Computer Science, The University of North Carolina at Charlotte;Graphics, Visualization & Usability Center, College of Computing, Georgia Institute of Technology;DHS SouthEast Regional Visualization and Analytics Center2
 Beth Plale合作论文数Luddy School of Informatics, Computing, and Engineering, Indiana University Bloomington2S. Hussain Raza合作论文数2
 Chris Shaw合作论文数School of Interactive Arts & Technology, Simon Fraser University2Leonard Nyadong合作论文数School of Chemistry and Biochemistry, Georgia Institute of Technology2Qiqin Yin-Goen合作论文数2anthony a wasilewski合作论文数1Anthony A. Wasilewski合作论文数1Rebecca A. Cooper合作论文数1Justin Jang合作论文数1Joseph Graber合作论文数1William O’Brien合作论文数1Stéphane Balayssac合作论文数Laboratoire IMRCP (UMR CNRS 5623), Université PaulSabatier1S Driscoll合作论文数1
 David A Gaul合作论文数Georgia Institute of Technology1Wendell D Jones合作论文数Express Anal Inc, Durham, NC USA1
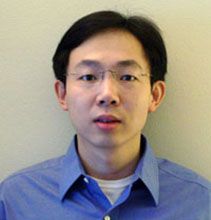 Lei Shi合作论文数Phyiology, Biophysics & Systems Biology, Weill Cornell Graduate School of Medical Sciences, Cornell University1
 Jian Liu (刘坚)合作论文数College of Nano Science & Technology, Soochow University1
 E. Paige Stout合作论文数1Sullards M Cameron合作论文数1
 Teresa H Sanders合作论文数Electrical and Computer Engineering Department, Georgia Institute of Technology1Caldwell Matthew L合作论文数1Kim Jaeyeon合作论文数1
 Weida Tong合作论文数Division of Bioinformatics and Biostatistics, National Center for Toxicological Research, U.S. Food and Drug Administration1
 Alfred H. Merrill合作论文数School of Biological Sciences, College of Sciences, Georgia Institute of Technology;Petit Institute for Bioengineering & Bioscience, Georgia Institute of Technology;School of Chemistry and Biochemistry, Georgia Institute of Technology1
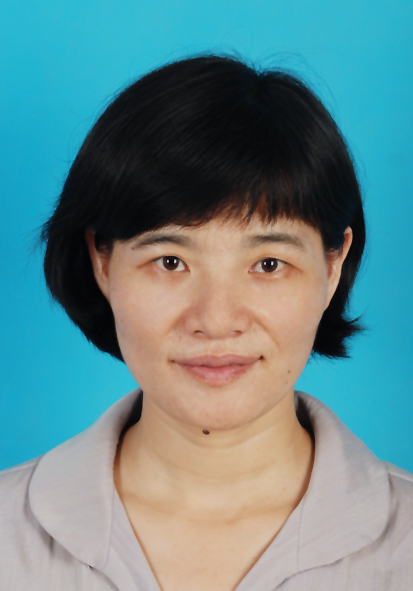 Yanfeng Chen (陈艳峰)合作论文数School of Electric Power Engineering, South China University of Technology1Asiri Gahlena合作论文数1
 Matthias Fischer合作论文数Department of Pediatric Oncology and Hematology, Children's Hospital, University of Cologne, Cologne, Germany1




