Background With the increasing volume of data collected for advanced analytical and AI applications, data storage remains a significant challenge. Despite advancements in storage technologies, the cost of maintaining vast datasets continues to grow. Compression techniques have been widely used to address this issue, but existing systems primarily rely on a single, typically lossless method, which limits adaptability to varying data characteristics. Methods This paper introduces COMPASS, a multiple compression approach that applies different compression techniques to different subsets of data within a database. COMPASS partitions relational data into rows or columns and selects the most suitable compression scheme for individual columns or column groups. Two versions of COMPASS are proposed: (i) COMPASS-D, which utilizes K-Means clustering based on data values; and (ii) COMPASS-E, which employs K-Means clustering based on column entropy to group similar columns efficiently. The effectiveness of COMPASS is evaluated using the Envmon dataset, a real-world environmental monitoring database, and compared against monolithic compression methods. Results Experimental results demonstrate that COMPASS significantly reduces disk space usage compared to traditional compression techniques. COMPASS-E achieves superior performance in terms of compression time and proximity to the optimal compression ratio, outperforming COMPASS-D. In worst-case scenarios, COMPASS methods offer 22% more savings compared to baseline techniques, with best-case savings reaching 56% (~2× improvement). Conclusion The proposed COMPASS framework offers a flexible and adaptive approach to database compression by leveraging multiple schemes tailored to different data subsets. This results in improved storage efficiency and reduced computational overhead. Future work will explore additional data characteristics and clustering methods to further enhance COMPASS’s adaptability and efficiency.
This report provides insights into the challenges, emerging topics, and opportunities related to human-data interaction and visual analytics in the AI era. The BigVis 20241 organizing committee conducted a survey among experts in the field. They invited the Program Committee members and the authors of accepted papers to share their views. Thirty-two scientists from diverse research communities, including Databases, Information Visualization, and Human-Computer Interaction, participated in the study. These scientists, representing both industry and academia, provided valuable insights into the current and future landscape of the field.
The escalating global energy crisis and the increasing CO2 emissions have necessitated the optimization of energy efficiency. The proliferation of Internet of Things (IoTs) devices, expected to reach 100 billion by 2030, contributed to this energy crisis and subsequently to the global CO2 emissions increase. Concomitantly, climate and energy targets have paved the way for an escalating adoption of solar photovoltaic power generation in residences. The IoT integration into home energy management systems holds the potential to yield energy and peak demand savings. Optimizing device planning to mitigate CO2 emissions poses significant challenges due to the complexity of user-defined preferences and consumption patterns. In this article, we propose an innovative IoT data platform, coined Sustainable Energy Management Framework (SEMF), which aims to balance the trade-off between the imported energy from the grid, users' comfort, and CO(2 )emissions. SEMF incorporates a Green Planning evolutionary algorithm, coined GreenCap(+), to facilitate load shifting of IoT-enabled devices, taking into consideration the integration of renewable energy sources, multiple constraints, peak-demand times, and dynamic pricing. Based on our experimental evaluation utilizing real-world data, our prototype system has outperformed the state-of-the-art approach by up to approximate to 29% reduction in imported energy, approximate to approximate to 35% increase in self-consumption of renewable energy, and approximate to 34% decrease in CO2 emissions, while maintaining a high level of user comfort approximate to 94%-99%
Mobility data captures the locations of moving objects such as humans, animals, and cars. With the availability of Global Positioning System (GPS)–equipped mobile devices and other inexpensive location-tracking technologies, mobility data is collected ubiquitously. In recent years, the use of mobility data has demonstrated a significant impact in various domains, including traffic management, urban planning, and health sciences. In this article, we present the domain of mobility data science. Towards a unified approach to mobility data science, we present a pipeline having the following components: mobility data collection, cleaning, analysis, management, and privacy. For each of these components, we explain how mobility data science differs from general data science, we survey the current state-of-the-art, and describe open challenges for the research community in the coming years.
The Internet of Things (IoT) revolution has introduced sensor-rich devices to an ever growing landscape of smart environments. A key component in the IoT scenarios of the future is the requirement to utilize a shared database that allows all participants to operate collaboratively, transparently, immutably, correctly and with performance guarantees. Blockchain databases have been proposed by the community to alleviate these challenges, however existing blockchain architectures suffer from performance issues. In this paper we introduce Triabase, a novel permissioned blockchain system architecture that applies data decaying concepts to cope with scalability issues in regards to blockchain consensus and storage efficiency. For blockchain consensus, we propose the Proof of Federated Learning (PoFL) algorithm which exploits data decaying models as Proof-of-Work. For storage efficiency, we exploit federated learning to construct data postdiction machine learning models to minimize the storage of bulky data on the blockchain. We present a detailed explanation of our system architecture as well as the implementation in the Hyperledger fabric framework. We use our implementation to carry out an experimental evaluation with telco big data at scale showing that our framework exposes desirable qualities, namely efficient consensus at the blockchain layer while optimizing storage efficiency.
There is considerable momentum across multiple continents to build and deploy systems that can usefully inform policy-makers and aid agencies about the timing, location, and scale of political violence. In this paper we introduce a framework that utilizes an architecture based on the Tsetlin Machine to detect notable transitions between lower and higher levels of political violence as measured by fatalities. We engineer input features based on the influential framework of horizontal inequalities (HI) and conflict history as they have been theorized to presage violence. However, we encounter the challenge that some classes are more or less distinguishable from others using TM-generated rules. We leverage the analytical structure of TMs and their weights to explain these clusters. To do so, we introduce the concept of a class spectrum and reduce the dimensions of these spectrums across classes and features with principal components analysis (PCA). This pipeline allows us to find transition (change) points between the fatality classes and cluster the classes into efficiently detectable groups. These tools provide both researchers and policy-makers a means of understanding similarities and differences in explanations across different conflict phases.
The Diversity, Equity and Inclusion (DEI) initiative started as the Diversity/Inclusion initiative in 2020 [4]. The current report summarizes our activities in 2023.
Information Visualization has been one of the cornerstones of Data Science, turning the abundance of Big Data being produced through modern systems into actionable knowledge. Indeed, the Big Data era has realized the availability of voluminous datasets that are dynamic, multidimensional, noisy and heterogeneous in nature. Transforming a data-curious user into someone who can access and analyze that data is even more burdensome now for a great number of users with little or no support and expertise on the data processing part.
The Diversity, Equity and Inclusion (DEI) initiative started as the Diversity/Inclusion initiative in 2020 [4]. The current report summarizes our activities in 2022. Our responsibility as a community is to ensure that attendees of DB conferences feel included, irrespective of their scientific perspective and personal background. One of the first steps was to establish the role of the DEI chairs at DB Conferences, with the DEI team dedicated to providing leadership to help our community achieve this goal. In this leadership role, the DEI team is advising DEI chairs at DB conferences, serving as a memory of DEI events at conferences, building an agreed-upon vision, and committing to working together to devise a set of measures for achieving DEI. That is pursued via actions led by our core members (Figure 1) and liaisons of individual executive bodies (Figure 2): REACH OUT collects data and experiences from our community. INCLUDE monitors and recommends inclusion efforts. ORGANIZE focuses on in-conference organization efforts, such as adopting a code of conduct. INFORM communicates through various channels. SUPPORT coordinates DEI support from executive bodies and sponsors. SCOUT collates DEI efforts from other communities. COORDINATE manages all actions. Two new actions: MEDIA preserves and disseminates the digital media produced by DEI@DB events. ETHICS establishes and promotes ethics guidelines for publications in our community.
Mobility data captures the locations of moving objects such as humans, animals, and cars. With the availability of GPS-equipped mobile devices and other inexpensive location-tracking technologies, mobility data is collected ubiquitously. In recent years, the use of mobility data has demonstrated significant impact in various domains including traffic management, urban planning, and health sciences. In this paper, we present the emerging domain of mobility data science. Towards a unified approach to mobility data science, we envision a pipeline having the following components: mobility data collection, cleaning, analysis, management, and privacy. For each of these components, we explain how mobility data science differs from general data science, we survey the current state of the art and describe open challenges for the research community in the coming years.
Energy efficiency has become a primary optimization objective due to the global energy crisis and high levels of CO 2 emissions. Climate and energy targets have been leading to a growing utilization of solar photovoltaic power generation in residential buildings. As the number of IoT devices drastically increases, their automation through an intelligent home energy management system can provide energy and peak demand savings. The planning optimization of devices can be very challenging due to the unsophisticated user-defined preference rules. Existing solutions face convergence difficulties due to the management of multiple IoT devices tackling multiobjective problems. In this paper, we propose an innovative IoT data system, coined GreenCap, which utilizes a Green Planning evolutionary algorithm for load shifting of IoT-enabled devices, considering the integration of renewable energy sources, multiple constraints, peak-demand times, and dynamic pricing. We have implemented a complete prototype system available on Raspberry Pi and linked with openHAB framework. Our experimental evaluation with extensive real traces shows that the GreenCap prototype system efficiently generates a sustainable plan obtaining high levels of user comfort 92-99% along with ≈52% of self-consumption, while reducing ≈35% of the imported energy from the grid and ≈40% of CO 2 emissions.
The exposure to viral airborne diseases is higher in crowded and congested spaces, the COVID-19 pandemic has revealed the need of pedestrian recommendation systems that can recommend less congested paths which minimize exposure to infectious crowd diseases in general. In this paper, we introduce ASTRO-C, an extension of previous work ASTRO, which optimizes for minimum congestion. To our knowledge, ASTRO-C is the only solution to this problem of constraint-satisfying, indoor-outdoor, congestion-based path finding. Our experimental evaluation using randomly generated Indoor-Outdoor graphs with varying constraints matching various real-world scenarios, show that ASTRO-C is able to recommend paths with, on average a 0.62X reduction in average congestion, while on average, total travel time increases by 1.06X and never exceeds 1.10X compared to ASTRO.
Reproducibility is a core component of any scientific discovery. A step towards reproducibility within the IPIN community is the contribution of this paper, our software-based testbed, called RETSINA (Reproducibility and Experimentation Testbed for Signal-strength Indoor Near Analysis). RETSINA enables the repeatability, reproducibility and comparison of approaches that use machine learning to detect proximity. We demonstrate RETSINA’s functionality by repeating and extending the findings of a recent case study on Wi-Fi signal strength based contact tracing accuracy. Furthermore, we leverage RETSINA to experimentally compare the results for detecting close encounters produced by the original Wi-Fi signal strength readings study and our study using Bluetooth signal strength readings.
The ever-increasing demand to use and store data in perpetuity is limited by storage cost, which is decreasing slowly compared to computational power's exponential growth. Under these circumstances, the deliberate loss of detail in data as it ages (referred to as data decay) is useful because it allows the cost of storing data to decrease alongside the data's utility. The idea of data postdiction as a data decay method uses machine learning techniques to recover previously deleted values from data storage. This paper proposes and evaluates a new pipeline using clustering, outlier detection, machine learning, and accuracy tuning to implement an effective data postdiction for archiving data. Overall, the goal is to train a machine learning model to estimate database features, allowing for the deletion of entire columns, which can later be reconstructed within some threshold of accuracy using the stored models. We evaluate the effectiveness of our postdiction pipeline in terms of storage reduction and data recovery accuracy using a real healthcare dataset. Our preliminary results show that the order in which outlier detection, clustering, and machine learning methods are applied leads to different trade-offs in terms of storage and recovery accuracy.
Buildings are a significant source of greenhouse gas emissions, and many organizations recognize that reducing commercial building-related emissions is crucial to achieving a carbon-neutral future. However, leveraging state-of-the-art building energy-efficiency techniques can be expensive and require installing new equipment, resulting in only a small percentage of energy-efficient commercial buildings. To address this challenge, our paper focuses on empowering building occupants to become informed change-makers that drive building efficiency through an IoT-based solution. By leveraging the data collected from low-cost sensors, we envision creating personalized dashboards and interventions for individuals, fostering energy transparency and empowering people to optimize their space usage while reducing emissions. Moreover, we can leverage human flexibility and flexible environments to further improve space usage and realize energy and emissions reduction opportunities. Thus, by enabling human-building interaction, our approach will be more effective in achieving the full potential of reducing energy and emissions in existing buildings.
In this paper we introduce a framework that utilizes an architecture based on the Tsetlin Machine to output explainable rules for the prediction of political violence. The framework includes a data processing pipeline, modeling architecture, and visualization tools for early warning about notable events. We conducted an experimental study to explain and predict a one of the most notable events, - a civil war. We observed that the rules that we produced are consistent with theories that emphasize the continuing risks that accumulate from a history of conflict as well as the stickiness of civil war.
Accessibility and usability have been key concerns in the design of computer interfaces through which users interact with applications and systems. Recently, chatbots have gained popularity with service providers for improvements in this area. In this paper, we present our experience in designing and implementing CAPRIO’s inclusive chatbot-based interface for pedestrian path recommendations. Our CAPRIO system provides inclusive usability by extracting user preferences in a non-intrusive dialog and using them to build a more accurate model for the user’s intent. It uses the Microsoft Bot Framework (MBF) and NLP modeling to support text and voice dialog.
Internet of Things (IoT) applications can significantly reduce the cost and timeframe of providing their benefits by taking advantage of the billions of existing IoT sensors and other IoT devices that have been deployed by others in IoT. This paper proposes a self-managed Sensor Sharing Marketplace (SenShaMart) that allows IoT applications to discover, integrate, and pay for the use of sensors that are managed by different parties. In addition to being a self-managed IoT marketplace, SenShaMart is fully autonomic and cannot be controlled by any specific party. IoT applications and IoT sensor providers interact via SenShaMart provided services for semantic description of IoT sensors and their data, semantic query processing, automatic integration of sensors and their data, and IoT sensor payment transactions that control the access to the flow of sensor data according to the sensor payment terms. Self-management and full autonomy are achieved via a specialized SenShaMart blockchain that keeps and manages all data needed by the SenShaMart services that encapsulate it. The paper presents the SenShaMart architecture and service organization, its specialized blockchain, as well as its current performance characteristics and future research.
Although the volume of stored data doubles every year, storage capacity costs decline only at a rate of less than 1/5 per year. At the same time, data is stored in multiple physical locations and remotely retrieved from multiple sites. Thus, minimizing data storage costs while maintaining data fidelity and efficient retrieval is still a key challenge in database systems. In addition to the raw big data, its associated metadata and indexes equally demand tremendous storage that impacts the I/O footprint of data centers. In this vision paper, we propose a new signature-based compression (SIBACO) technique that is able to: (i) incrementally store big data in an efficient way; and (ii) improve the retrieval time for data-intensive applications. SIBACO achieves higher compression ratios by combining and compressing columns differently based on the type and distribution of data and can be easily integrated with column and hybrid stores. We evaluate our proposed tool using real datasets showing that SIBACO outperforms "monolithic" compression schemes in terms of storage cost.
 Alexandros Labrinidis合作论文数University of Pittsburgh Department of Computer Science Advanced Data Management Technologies Laboratory91
 Mohamed Sharaf合作论文数College of Information Technology, United Arab Emirates University52
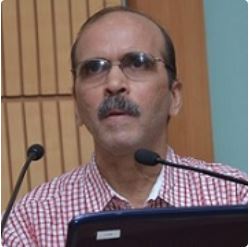 Krithi Ramamritham合作论文数Sai University39
 George Samaras合作论文数Dept. of Computer Science;UNIVERSITY OF CYPRUS36
 Christian S. Jensen合作论文数Department of Computer Science, Aalborg University32
 Evaggelia Pitoura合作论文数Department of Computer Science & Engineering, School of Engineering, University of Ioannina;Archimedes Research Unit on AI, Data Science and Algorithms31
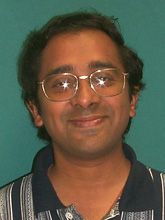 Amarnath Gupta合作论文数San Diego Supercomputer Center, University of California San Diego28
 Kirk Pruhs合作论文数Department of Computer Science ,University of Pittsburgh27
 Xiaoyu Ge合作论文数Univ Pittsburgh, Dept Comp Sci, Pittsburgh, PA 15260 USA25
 Constantinos Costa合作论文数Dept. of Computer Science, University of Cyprus25
 Nick Craswell合作论文数Microsoft Research24
 Esteban Zimányi合作论文数Department of Computer and Decision Engineering24
 Gerhard Weikum合作论文数Department of Databases and Information Systems, Max-Planck Institute for Informatics22
 Christine E. Parent合作论文数Department of Biological Sciences, College of Science, University of Idaho21
 Stefano Spaccapietra合作论文数École Polytechnique Fédérale de Lausanne21B. Carminati合作论文数University of Insubria21
 Demetris Zeinalipour合作论文数Department of Computer Science, University of Cyprus21
 Walid G. Aref合作论文数Department of Computer Science, Purdue University21
 Kazuo Goda合作论文数20
 Vassilis J. Tsotras合作论文数Department of Computer Science and Engineering, Bourns College of Engineering, University of California, Riverside;Data Science Center, University of California, Riverside20
 Yannis Theodoridis合作论文数Department of Informatics, School of Information and Communication Technologies, University of Piraeus20Hans Hinterberger合作论文数19Kaladhar Voruganti合作论文数19
 Jiashun Jin合作论文数Department of Statistics and Data Science, Dietrich College of Humanities and Social Sciences, Carnegie Mellon University;School of Statistics & Data Science, Southeast University19Ethan Zhang合作论文数18Yi Zhang合作论文数18
 Ippokratis Pandis合作论文数Amazon Web Services18
 Richard Thomas Snodgrass合作论文数Department of Computer Science, College of Science, University of Arizona18
 Johannes Gehrke合作论文数Microsoft18
 Nikos Hardavellas合作论文数Department of Electrical and Computer Engineering, McCormick School of Engineering and Applied Science, Northwestern University;Department of Computer Science, McCormick School of Engineering and Applied Science, Northwestern University18
 Jovan Pehcevski合作论文数Dell Technologies18
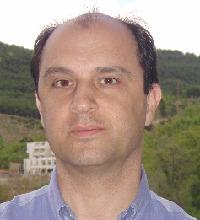 Yannis Manolopoulos合作论文数Faculty of Pure & Applied Sciences, Open University of Cyprus;Department of Informatics, Aristotle University of Thessaloniki18Bernhard Thalheim合作论文数17
 Jingren Zhou合作论文数Alibaba Group17
 Stephen E. Fienberg合作论文数Carnegie Mellon University17
 Mohamed F. Mokbel合作论文数Department of Computer Science and Engineering, College of Science and Engineering, University of Minnesota17Lukasz Golab合作论文数16Benjamin Piwowarski合作论文数16
 Cristina Sirangelo合作论文数Institut de Recherche en Informatique Fondamentale, Université Paris Cité16
 Mario Nascimento合作论文数Khoury College of Computer Sciences, Northeastern University16Jonathan Beaver合作论文数Department of Computer Science, University of Pittsburgh
Co-director, Advanced Data Management Technologies Laboratory16
Mario Nascimento合作论文数Khoury College of Computer Sciences, Northeastern University16Jonathan Beaver合作论文数Department of Computer Science, University of Pittsburgh
Co-director, Advanced Data Management Technologies Laboratory16 Ninghui Li (李宁辉)合作论文数Department of Computer Science, Purdue University;Secure Intelligence Institute, Perplexity16Yanif Ahmad合作论文数Cornell University16Panos Kalnis合作论文数15
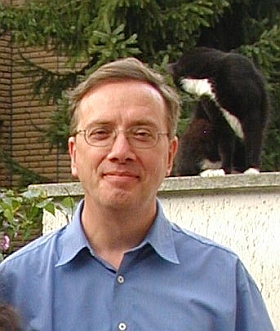 Ralf Hartmut Güting合作论文数University of Hagen15
 Ophir Frieder合作论文数Department of Computer Science, Georgetown University;Aurora Forge;Invaryant, Inc.15
 Gabriel Ghinita合作论文数Department of Computer Science, University of Massachusetts Boston15
 Carson Kai-Sang Leung合作论文数Database & Data Mining Lab, Department of Computer Science, University of Manitoba15Steven M. Beitzel合作论文数Telcordia Technologies15




