Cotton is one of the most economically valuable fiber crops worldwide. Understanding the factors influencing its yield under climate change is crucial for managing climate risks, ensuring a stable textile supply, and promoting sustainable development globally and regionally. This study systematically analyzed the annual yield trends in 82 cotton-producing countries from 1992 to 2021. It investigated the driving factors of cotton yield using eight key indicators, including resource inputs, management practices, and climatic variables. Results show that global cotton yields increased by 27 t km-2 annually, with higher growth in high-income and upper-middle-income countries, the latter achieving yields twice the global average. In contrast, lower-middle-income countries experienced slower growth, while low-income countries faced slight declines. Arid regions maintained the highest yields, with significant improvements across tropical, temperate, and arid zones. Using a varying coefficient spatiotemporal regression (geographically and temporally weighted regression (GTWR)), the study further revealed significant regional variations in the driving factors of cotton yield. Globally, cotton-planted areas and labor inputs negatively impacted yields, as larger areas can lead to insufficient management and high labor density indicates a lack of mechanization. In contrast, fertilizer application and sunlight improved yields, while rising temperatures suppressed them. Regional differences were also observed: mechanization enhanced yields in high-income countries, increased land allocation to cotton improved yields in tropical regions, and fertilizer use drove yield growth in low-income regions. This study highlights the spatial and temporal heterogeneity of global cotton production and offers scientific insights to inform region-specific agricultural management policies and sustainable development strategies.
This paper demonstrates an approach to the application of generalized additive models (GAMs) with space-time smooths to model coefficient processes that vary over space and time. The approach is to create and evaluate multiple GAMs, each with the predictor variables specified in different ways. It emphasizes the need to determine the nature of the space-time dependencies present in the data relationships rather than to assume them, based on the perceived data generating process, especially if this is unknown. The approach is explored using simulated coefficient data with known space-time dependencies. The GAMs are compared with multiscale geographically and temporally weighted regression (MGTWR) models and are shown to have marginally weaker predictive performance and to be marginally better at coefficient recovery. The inferential costs of misspecifying the target-to-predictor variable relationships in the GAMs is quantified both for individual variable main effects and interacting misspecifications. The approach is then applied to an empirical case study of NDVI (as a proxy for forest productivity) informed by precipitation and temperature in the Chaco dry rainforest of South America. The best GAM is determined and its space-time varying coefficient estimates are investigated. The methods and results are discussed and several areas of further work and enhancements to the stgam R package used to undertake this analysis are identified.
This study proposes a geographically weighted (GW) quantile machine learning (GWQML) framework for soil moisture (SM) prediction, integrating spatial kernel functions with quantile-based prediction and uncertainty quantification. The framework incorporates satellite radar backscatter, meteorological re-analysis, and topographic variables, applied across 15 SM stations and six land use systems at the North Wyke Farm Platform, southwest England, UK. GWQML was implemented using Gaussian and Tricube spatial kernels across a range of kernel bandwidths (500–1500 m). Model performance was evaluated using both in-sample and Leave-One-Land-Use-Out validation schemes, and a global quantile machine learning model (QML) without spatial weighting served as the benchmark. GWQML achieved R2 values up to 0.85 and prediction interval coverage probabilities up to 0.9, with intermediate kernel bandwidths (750–1250 m) offering the best balance between accuracy and uncertainty calibration. Spatial autocorrelation analysis using Moran’s I revealed a lower residual clustering under GWQML relative to the benchmark model, which suggests improved handling of local spatial variation. This study represents one of the first applications of geographically weighted kernel functions in a quantile machine learning framework for daily soil moisture prediction. The approach implicitly captures spatially varying relationships while delivering calibrated uncertainty estimates for scalable SM monitoring across heterogenous agricultural landscapes.
Abstract. Generalised Additive Models (GAMs) with Gaussian process bases have been proposed as a framework for constructing spatially varying coefficient (SVC) and spatially and temporally varying coefficient (STVC) regression models, that overcome many of the theoretical problems and technical limitations associated with geographically weighted approaches. Recent work has considered the SVC case in detail and this is being extended to the temporal case. However, while spatial lags and dependencies are well handled by many existing methods, one of the critical issues in space-time modelling is how to determine appropriate temporal lags for individual predictor variables that may exhibit different temporal dependencies with the target variable. This paper demonstrates an outline approach for optimising these. Additionally, lags determined in this way may be used to inform on the temporal margins used to parameterise space-time tensor products smooths in GAM based STVC approaches.
The ability to deliver ecosystem goods and services as a co-product to agricultural production is an important goal in societal response to environmental change, carbon removal and the need for food. The North Wyke Farm Platform (NWFP) https://www.rothamsted.ac.uk/national-capability/north-wyke-farm-platform is a farm scale long-term experiment established in 2010 with the purpose of furthering the understanding of ecosystem and productivity responses to land and farm management practices (Orr et al. 2016, Takahashi et al. 2018). The platform now supports four farming systems; two pasture based ruminant systems, one housed beef system, and one arable system. For each component process, data is collected at a range of temporal and spatial scales and with differing degrees of automation. At the time of writing over 100 million data points have been recorded including those for productivity, emissions, soils, biodiversity. The data collections are Open and managed under FAIR principles. Agricultural systems emerge because of management intervention. Consequently, the responses of the ecosystem within which the production system is located are linked to the management intervention. An ongoing challenge at the NWFP is the ability to implement management changes reflective of industrial practice and of policy relevance, but in parallel ensure that the experimental design is not compromised, and the data output of the platform is robust. Stakeholder engagement methodologies, affordability of proposed interventions, policy environment, funding priorities technology changes, skills availability and institutional leadership will all affect adaptive management practices. After nearly 15 years of operation, we can reflect on challenges of the management component of the NWFP and our academic and organisational responses. In this paper, we present these reflections as a critique of our approach and consider our actions through the lens of decision science to both signal what lessons we think, (or hope) we have learned and to help other teams identify themes for consideration as they seek to integrate adaptive management into long-term ecological research.
Advances in the computational sciences and AI have been critical in simulating the projected impacts of climate change in agriculture together with quantifying mitigation strategies to reduce agriculture’s influence on climate change. The role of computation in bringing understanding to agroecosystem change from the farm to national scales is pervasive, being central for remote and ground IoT sensing, big data analysis, process simulation, data assimilation, the capture of error and uncertainty, sensor network design and interactive visualization of high dimensional outputs. Component farm processes for soils, plants, livestock, biodiversity, and water and gaseous emissions are multi-scale and casual with complex space-time connections. Respective component datasets, measured or sensed optimally and adaptively in space and time, are needed to dynamically inform model simulations for past, present, and future states. This can be couched within a scale-aware, farm decision support tool (DSTs - say, via a digital model, shadow, or twin), where its virtual-world forecasts can inform both on-farm decisions and, via extension to networked farm DSTs, farming policy. Given an accurate capture of uncertainty, the risk associated with farm management decisions can be quantified facilitating planning for sustainable farming in the long-term, coupled with (short-term) early warning signals for diminishing system resilience to increasing threats of abiotic, biotic, and other stresses. However, while such AI-driven technologies in agriculture often appear good on paper, what is actually viable in practice? (Rose et al. 2016) noted the existence of 395 agricultural DSTs and recommended 15 of them for their effective design and delivery. Suffice to say, not all of the 395 DSTs are still available, nine years on. Further, the reviewed DSTs were not all sofware-based (on- or off-line) but included those that were paper-based. A question then arises, does AI implicitly change what is possible, practical, and useful for land managers, farmers and their advisors? Or do the same inherent limitations of DSTs remain? In turn, how does this translate to effective government agricultural policy? This paper seeks to elucidate on such questions through a consideration of the following: What advantages might an AI-driven DST (AI-DST) have when compared to one using older technologies? What data does the farmer need to collect and manage to support the AI-DST? What are the minimum data requirements and at what cost? Does the AI-DST provide functionality for cost benefit analyses for the on-going relevance of the data collected? How do the AI-DST outputs reflect data quality, error, and sparseness? Does the scale of on-farm measurements match the scale of the sampled process and subsequent scales of decision making? Is data capture timely enough with tolerable latency? For an AI-DST scenario evaluation – are the interplays between different management and climate scenarios fully described and caveated for practical use? How can the farmer be empowered with their intrinsic expert knowledge of their farm or their farming philosophy within the AI-DST? Is an AI-DST only ever complementary? What about an AI-DST with human in the loop AI? What training and support are required for AI-DST use? How does the farmer know if decisions informed by the AI-DST are beneficial - especially in the long run? Has the weather just been coincidently beneficial? Does the AI-DST capture the interplay between farm profitability and government payments or incentives. How does this interplay vary over time, different geographies, and for different farm practices? How should a farmer proceed with conflicting advice when using multiple AI-DSTs with different objectives. For example, priority decisions from an AI-DST for soil health may conflict with those from an AI-DST for field margin biodiversity. Is there a ‘one-size-fits’ all AI-DST? Is this AI-DST desirable? What are the options for retraining / revising / updating a given AI-DST’s model framework and software given ever changing challenges of climate change; for example, are extremes (drought, floods) or extreme changes (i.e. winter one day, summer the next) in the weather the greater problem? Is the AI-DST typically on board with or resilient to the Zeitgeist (e.g., a 'world without livestock' debate). Does the AI-DST allow for alignment with digital innovations, in say soil sensing, robotics? Does the AI-DST adequately capture and explain concepts of decision risk? Are the AI-DST's output (and input) visualisations relevant and appropriate, in this respect? Given not all farms, farmers and their advisors are made equal – how does the AI-DST cater for this? How does the AI-DST capture the inherently diverse nature of farming? Are AI-DST informed decisions to be made by a farm owner, farm tenant or farm manager? Does the AI-DST cater for a given farm’s route to market and when and where are these routes optimal? How does the AI-DST capture, and adapt to, unintended consequences of the decisions made? Similarly, how does the AI-DST respond to unforeseen external influences, such as international conflict, widespead drought? Are AI-DST-based decisions effective across multiple scales – benefitting individual farms and networked farms alike? Does the AI-DST promote use within farmer networks, community of practise and farmer cooperation? For example, AI-DSTs informed by shared data resources amongst farms within the same catchment. How do on-farm decisions influence the food supply chain – from farm to fork? Does the AI-DST provide this broader picture functionality? For example, does the AI-DST provide options, not only for farm productivity and farm emissions but also those concerned with externalities such as energy use, transportational costs, societal effects and more? What can be learnt and transferred from AI-DSTs and non-AI DSTs in other domains? What advantages might an AI-driven DST (AI-DST) have when compared to one using older technologies? What data does the farmer need to collect and manage to support the AI-DST? What are the minimum data requirements and at what cost? Does the AI-DST provide functionality for cost benefit analyses for the on-going relevance of the data collected? How do the AI-DST outputs reflect data quality, error, and sparseness? Does the scale of on-farm measurements match the scale of the sampled process and subsequent scales of decision making? Is data capture timely enough with tolerable latency? For an AI-DST scenario evaluation – are the interplays between different management and climate scenarios fully described and caveated for practical use? How can the farmer be empowered with their intrinsic expert knowledge of their farm or their farming philosophy within the AI-DST? Is an AI-DST only ever complementary? What about an AI-DST with human in the loop AI? What training and support are required for AI-DST use? How does the farmer know if decisions informed by the AI-DST are beneficial - especially in the long run? Has the weather just been coincidently beneficial? Does the AI-DST capture the interplay between farm profitability and government payments or incentives. How does this interplay vary over time, different geographies, and for different farm practices? How should a farmer proceed with conflicting advice when using multiple AI-DSTs with different objectives. For example, priority decisions from an AI-DST for soil health may conflict with those from an AI-DST for field margin biodiversity. Is there a ‘one-size-fits’ all AI-DST? Is this AI-DST desirable? What are the options for retraining / revising / updating a given AI-DST’s model framework and software given ever changing challenges of climate change; for example, are extremes (drought, floods) or extreme changes (i.e. winter one day, summer the next) in the weather the greater problem? Is the AI-DST typically on board with or resilient to the Zeitgeist (e.g., a 'world without livestock' debate). Does the AI-DST allow for alignment with digital innovations, in say soil sensing, robotics? Does the AI-DST adequately capture and explain concepts of decision risk? Are the AI-DST's output (and input) visualisations relevant and appropriate, in this respect? Given not all farms, farmers and their advisors are made equal – how does the AI-DST cater for this? How does the AI-DST capture the inherently diverse nature of farming? Are AI-DST informed decisions to be made by a farm owner, farm tenant or farm manager? Does the AI-DST cater for a given farm’s route to market and when and where are these routes optimal? How does the AI-DST capture, and adapt to, unintended consequences of the decisions made? Similarly, how does the AI-DST respond to unforeseen external influences, such as international conflict, widespead drought? Are AI-DST-based decisions effective across multiple scales – benefitting individual farms and networked farms alike? Does the AI-DST promote use within farmer networks, community of practise and farmer cooperation? For example, AI-DSTs informed by shared data resources amongst farms within the same catchment. How do on-farm decisions influence the food supply chain – from farm to fork? Does the AI-DST provide this broader picture functionality? For example, does the AI-DST provide options, not only for farm productivity and farm emissions but also those concerned with externalities such as energy use, transportational costs, societal effects and more? What can be learnt and transferred from AI-DSTs and non-AI DSTs in other domains? Where appropriate, some of the above questions are illustrated using the unique and open datasets of four instrumented research farms at Rothamsted Research’s North Wyke Farm Platform (NWFP) in south west UK. The NWFP was established in 2010 to facilitate system-scale research (Takahashi et al. 2018), where to date over 400 in-situ sensors have been deployed and over 100 million measurements have been captured. Currently, the NWFP consists of two grassland (cattle and sheep), one arable and one indoor cattle farm.
Soil has supported terrestrial food production for millennia; however, agricultural intensification may affect its resilience. Using a systems-thinking approach, we reviewed the impacts of conventional-agriculture practices on soil resilience and identified alternative practices that could mitigate these effects. We found that many practices only affect soil resilience with their long-term repeated use. Lastly, we ranked the impacts that pose the greatest threats to soil resilience and, consequently, food and feed security.
Production efficiency of pasture-based livestock production systems is primarily driven by the level of pasture utilisation, and, as such, regular monitoring of herbage mass (HM) provides essential information to assist on-farm decision making. Unfortunately, this practice is seldom carried out on commercial farms, likely due to the time commitment required across the entire grass-growing season. Recent studies have shown, however, that even moderately inaccurate HM data can improve the system-side profitability compared to enterprises with no data, warranting further investigations into the trade-off between the accuracy and cost associated with HM measurements. Using a weekly multi-paddock dataset from the North Wyke Farm Platform research site in Devon, UK, this study evaluated the technical validity and labour-saving potential of a simplified 'pasture walk' protocol for rising plate meters, under which only data along the diagonal transect - rather than the industry-standard W-shaped pathways - of the paddock are collected. Across 234 temporal-paddock combinations, the mean absolute difference in HM estimates between diagonal and W-transects was 106 kg DM/ha, a scale far too small to alter sward or animal management. The presented statistical analysis, together with a supplementary spatial simulation experiment, supported the generality of the findings across the full grass-growing season. With a 51.2% reduction in labour time (1.2 min/ha rather than 2.5 min/ha) across paddocks of various sizes and shapes, the proposed method is likely to facilitate uptake of evidence-based grazing management amongst farmers who currently do not quantify HM at all.
The paper describes modifications to spatial and temporal varying coefficient (STVC) modelling, using Generalized Additive Models (GAMs). Previous work developed tools using Gaussian Process (GP) thin plate splines parameterised with location and time variables, and has presented a space-time toolkit in the stgam R package, providing wrapper functions to the mgcv R package. However, whilst thin plate smooths with GP bases are acceptable for working with spatial problems they are not for working with space and time combined. A more robust approach is to use a tensor product smooth with GP basis. However, these in turn require correlation function length scale or range parameters (rho) to be defined. These are distances (in space or time) at which the correlation function falls below some value, and can be used to indicate the scale of spatial and temporal dependencies between response and predictor variables (similar to geographically weighted bandwidths). The paper describes the problem in detail, illustrates an approach for optimising. and methods for determining model specification.
Rapid urbanization poses a serious threat to regional ecological security (ES) and has led to significant ecological losses. To assess and mitigate ecological security (ES) losses caused by urban expansion, this study simulated urban expansion patterns in Northwest China by 2050 under the Shared Socioeconomic Pathways and Representative Concentration Pathways (SSP-RCP) scenarios. A coupled ERI (Ecological Risk Index)-EH (Ecological Health)-ESs (Ecosystem Services) model was employed to quantitatively analyze the regional ES development levels under different scenarios. From the perspectives of landscape pattern dynamics and ecological degradation, the study evaluated the impacts of urban expansion on ES across various development modes. Scenario comparisons were then used to implement ES zoning control strategies. The results reveal that while the northwest and southeast regions show relatively high ES levels, a gradual decline is observed towards central areas. The Economic Priority Development (EPD) model enhances urban land cohesion and mitigates landscape trade-offs on ES. Among the three scenarios, the ranking of ES loss areas is: EPD > Business as Usual (BAU) > Ecological Priority Protection (EPP), with the EPD scenario causing 2.524 times more ecological loss than the EPP scenario. Using provincial, municipal, county, and ecological function zones, the optimal urban development plan is selected based on the highest ES potential. This study provides strategic guidance for spatial planning by offering a practical and scalable framework to reduce ecological degradation while promoting balanced and sustainable regional development.
Ensuring and maintaining food security, in the context of climate change, is a global challenge of the 21 st century. It is necessary to maintain or enhance productivity from agriculture, while at the same time balancing environmental and social priorities – not only for the near future but the distant future also. To strike this balance at the farm-scale, timely decisions on agronomic management, system conversion and/or the adoption of a particular farming philosophy are warranted. Agroecosystem process-based models (PBMs) can be used to inform such climate smart decisions. For sustainable farming, PBMs can simulate processes for nutrient cycling and pollutants to water and air, which can be balanced with simulations for crop or livestock performance. As mathematical models, PBMs have relatively small data requirements, and thus are ideally suited to facilitate decisions for most farms. However, the simulated processes of a PBM deployment can be enriched when they are coupled with on-farm in-situ and off-farm remotely sensed data, together with routine data measurements and records. The data streams themselves can be characterised via data-driven models (DDMs). In doing so, this PBM-DDM coupling creates a digital shadow (DS) of a farm’s agroecosystem, rather than a digital model (DM) that involves a PBM only. In turn, if the architecture of the DS provides actionable feedback to the farm by positively influencing a farmer’s decision-making while refining the farm’s data capture programme, then the DS becomes a digital twin (DT). A farm decision support tool (DST - one of DM, DS or DT based) should facilitate practical, feasible and right-time decision making - both short- and long-term. Critically, DST forecasts need to be given with accurate estimates of forecast uncertainty to quantify decision risk. Set within an interactive visual environment, a farm DST should enable the farmer (or advisor) insight and discovery of the farms’ past, current and future status. For a PBM-based farm DS/DT, analytical choices for refining the chosen PBMs, with data streams typically take three major forms: (a) data assimilation on the PBM simulations, say using an ensemble Kalman filter; (b) data assimilation where the PBM, or a component of it, is replaced by its DDM emulator, say through machine learning; and (c) a coupling of PBM simulations with those from a DDM to form a hybrid. Choosing the PBM refining form depends on the situation, the questions being asked of the DS/DT, data availability (quality, quantity, coverage) and the flexibility of the PBM for its adaptation. All refining forms inherently improve the capture or estimation of uncertainty over that found with a PBM alone. Typically, choice (a) suffices for forecasting broad trends and patterns; choice (b) reduces computational overheads found with choice (a) thus ensuring timely decision making; while choice (c) better captures process detail, such as trends in variance for indications of declining system resilience. Any farm DS/DT is limited by the inherent complexities (in space, time, and scale) of its agroecosystems where for most of its component processes, the associated measuring or sensing technologies are either limited or non-existent. This means a fully DDM-driven farm DS/DT is not currently viable (i.e., it is not possible to dispense with PBMs altogether). In summary, a farm DS/DT consists of a series of coupled predictive models (PBMs/DDMs), including ensemble forms, where their performance can be evaluated with historical data (in-sample) to provide objective value to (out-of-sample) forecasts. Out-of-sample performance can be routinely re-evaluated as data is captured via dynamic in-sample assessments. The models of a farm DS/DT need to be both accurate in their predictions and accurate in their estimates of prediction uncertainty, where there are numerous sources of error and uncertainty that need to be captured to facilitate robust decision making. The quantification of uncertainty needs to account for data sources, model (choice) sources and computational sources. A farm DS/DT can be designed to facilitate sustainable, resilient, and/or net zero farming. Each endeavour requires a specific data capture design for specific farm processes together with specific analytical toolkits. Although such DS/DTs would share common components, say for data management, data preprocessing, a DS/DT servicing all three endeavours would unlikely be feasible or even desirable. This paper illustrates uncertainty quantification for farm-scale DSTs (via DMs, DSs, DTs) using the open datasets of four instrumented research farms at Rothamsted Research’s North Wyke Farm Platform (NWFP) long-term experiment in south west UK (https://www.rothamsted.ac.uk/national-capability/north-wyke-farm-platform). The NWFP was established in 2010 to facilitate system-scale research (Orr et al. 2016), where to date over 400 in-situ sensors have been deployed and over 100 million measurements have been captured. The component processes (for soils, crops, livestock, biodiversity, disease, pests, water, and gaseous emissions) of the farms are multi-scale with complex biological, chemical, and physical connections, both above and below ground, that in turn change over space and over time – all of which provide significant challenges for the capture and quantification of uncertainty. However, given an accurate capture of uncertainty, the risk of poor farm management decisions using DM/DS/DTs can be quantified, facilitating planning for climate smart farming.
This paper proposes a novel spatially varying coefficient (SVC) regression through a Geographical Gaussian Process GAM (GGP-GAM): a Generalized Additive Model (GAM) with Gaussian Process (GP) splines parameterised at observation locations. A GGP-GAM was applied to multiple simulated coefficient datasets exhibiting varying degrees of spatial heterogeneity and out-performed the SVC brand-leader, Multiscale Geographically Weighted Regression (MGWR), under a range of fit metrics. Both were then applied to a Brexit case study and compared, with MGWR marginally out-performing GGP-GAM. The theoretical frameworks and implementation of both approaches are discussed: GWR models calibrate multiple models whereas GAMs provide a full single model; GAMs can automatically penalise local collinearity; GWR-based approaches are computationally more demanding; MGWR is still only for Gaussian responses; MGWR bandwidths are intuitive indicators of spatial heterogeneity. GGP-GAM calibration and tuning are also discussed and areas of future work are identified, including the creation of a user-friendly package to support model creation and coefficient mapping, and to facilitate ease of comparison with alternate SVC models. A final observation that GGP-GAMs have the potential to overcome some of the long-standing reservations about GWR-based regression methods and to elevate the perception of SVCs amongst the broader community.
Enhancing agricultural productivity while maintaining ecological balance amidst climate change is a looming challenge. The future of resilient farming and food security will depend upon the effectiveness of collecting, interpreting, and acting on data. An agricultural digital twin (DT) can provide a feedback loop which improves both farm management and the computer system which informs it through integrating right-time sensor data, process-based models (PBMs), data-driven models (DDMs), and hybrid approaches. Three demonstrator DTs for farm ecosystems are currently under development, utilizing extensive datasets from three instrumented research farms at the North Wyke Farm Platform in Devon, UK to drive and evaluate the accuracy of models in simulating key agroecosystem processes, such as soil nutrient cycling, water balance, and crop performance. The implementation process involves data collection, processing, model integration, and visualization. Key measurements are gathered up to every 15 minutes. PBMs along with DDMs and hybrid models will be utilized in an ensemble to enhance predictive accuracy and robustness. The DT architecture consists of three tiers. A client tier focuses on creating a user-friendly web frontend and API. An analysis and retrieval tier will facilitate the orchestration of services by a container registry and Kubernetes master node. A simulation tier will handle intensive data processing and model simulations with Apache Spark and high-performance computing nodes. We expect the DTs to improve decision-making, enhance system resilience against biotic and abiotic stresses, and pave the way for sustainable agricultural innovation.
ABSTRACTWith the rapid urbanization in China, urban land resources gradually become the core of urban development. This study spatially evaluated the urban land resource carrying capacity (LRCC) with a case study of the built‐up area in Wuhan from 2015 to 2020. Following an evaluation index system, five critical LRCC indicators, including population density, GDP per land area, plot ratio, building density, and road network density, were selected by an analytical hierarchical process. The synthesis of indicators, however, is usually challengeable due to homogeneous assumptions of traditional techniques. In this study, we adopted a local technique, geographically weighted principal component analysis, to calculate a comprehensive carrying pressure (CCP) concerning spatially varying contributions of each indicator on their synthesis across different geographic locations. On mapping these spatial outputs of the built‐up area in Wuhan, the highest CCP was found in the central areas, where population size tends to be influential and the dominant variable in 62.69% of subdistricts. Furthermore, increased construction over the 5 years has led to an increased CCP in some of the peripheries of the built‐up area, and 55.22% of subdistricts show rising changes. With the GWPCA technique, this framework works well in evaluating and analyzing urban LRCC from a new local perspective.
With a growing body of research associating livestock agriculture with faster global warming, higher health costs and greater land requirements, a drastic shift towards plant-based diets is often suggested as an effective all-round solution. Implicitly, this argument is predicated on the assumption that the reallocation of resources currently assigned to animal production systems will automatically result in the efficient cultivation of human-edible crops without negative environmental, health or socioeconomic consequences. In reality, however, the validity of this assumption warrants careful examination, as a farm’s capability to adopt a new agricultural system is multifaceted and context-specific. Through a transdisciplinary review of literature, here we discuss examples of unintended consequences that could arise from the conversion of grasslands into arable production, including potentially adverse impacts on yield stability, biodiversity, soil fertility and beyond. We contend that few of these issues are being methodically considered as part of the current food security debate and call for a closer examination of supply-side constraints.
Spatial heterogeneity or non-stationarity has become a popular and necessary concern in exploring relationships between variables. In this regard, geographically weighted (GW) models provide a powerful collection of techniques in its quantitative description. We developed a user-friendly, high-performance and systematic software, named GWmodelS, to promote better and broader usages of such models. Apart from a variety of GW models, including GW descriptive statistics, GW regression models, and GW principal components analysis, data management and mapping tools have also been incorporated with well-designed interfaces.
This paper describes the use of Generalized Additive Models (GAMs) to create regression models whose coefficient estimates vary with geographic location—spatially varying coefficient (SVC) models. The approach uses Gaussian Process (GP) splines (smooths) for each predictor variable, which are parameterised with observation location in order to generate SVC estimates. These describe the spatially varying relationships between predictor and response variables. The proposed GAM approach was compared with Multiscale Geographically Weighted Regression (MGWR) using simulated data with complex spatial heterogeneities. The geographical GP GAM (GGP-GAM) was found to out-perform MGWR across a range of fit metrics and resulted in more accurate coefficient estimates and lower residual errors. One of the GGP-GAM models was investigated in detail to illustrate model diagnostics, checks of spline/smooth convergence and basis evaluations. A larger simulated case study was investigated to explore the trade-offs between GGP-GAM complexity (via the number of knots), performance and computational efficiency. Finally, the GGP-GAM and MGWR approaches were applied to an empirical case study. The resulting models had very similar accuracies and fits and generated subtly different spatially varying coefficient estimates. A number of areas of further work are identified.
Bayesian modelling averaging (BMA) allows the results of analysing competing data models to be combined, and the relative plausibility of the models to be assessed. Here, the potential to apply this approach to spatial statistical models is considered, using an example of spatially varying coefficient modelling applied to data from the 2016 UK referendum on leaving the EU
 Lex Comber合作论文数Centre for Spatial Analysis and Policy, School of Geography, Faculty of Environment, University of Leeds;Leeds Institute for Data Analytics, University of Leeds37
 Chris Brunsdon合作论文数National Centre for Geocomputation, Faculty of Social Sciences, National University of Ireland, Maynooth34
 Binbin Lu (卢宾宾)合作论文数GWmodel-Lab, School of Remote Sensing and Information Engineering, Faculty of Information Sciences, Wuhan University25
 Lianhai Wu合作论文数Rothamsted Research22
 Martin Charlton合作论文数National Centre for Geocomputation;National University of Ireland;National Centre for Geocomputation, National University of Ireland22
 Michael R F Lee合作论文数Harper Adams University21
 Gavin Ambrose合作论文数18
 Laura Cardenas合作论文数North Wyke Research14
 Adie Collins合作论文数Rothamsted Research12
 Daisuke Murakami合作论文数Univ. of Tsukuba;c;Univ. of Tsukuba11
 Tomoki Nakaya (中谷友樹)合作论文数Graduate School of Environmental Studies, Tohoku University;Graduate School of Science, Tohoku University11Narumasa Tsutsumida合作论文数Dept Informat & Comp Sci, Saitama Univ10
 Myriam Jordana Rivero合作论文数Net Zero & Resilient Farming, Rothamsted Res10
 Yihe Lv (吕一河)合作论文数Research Center for Eco-Environmental Sciences, Chinese Academy of Sciences;State Key Laboratory of Regional and Urban Ecology, Chinese Academy of Sciences10
 Stewart Fotheringham合作论文数Spatial Analysis Research Center, School of Geographical Sciences and Urban Planning, Arizona State University;Institute for Social Science Research, Arizona State University9Hadewij Sint合作论文数9Martin Blackwell合作论文数North Wyke Research9
 Xavier Monteys合作论文数Geological Survey of Ireland9B. A. Griffith合作论文数7
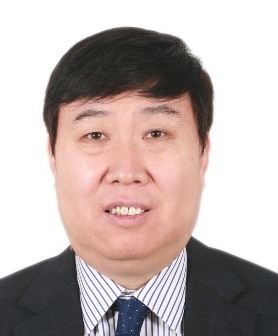 Bojie Fu (傅伯杰)合作论文数Research Centre for Eco-Environmental Sciences, Chinese Academy of Sciences;University of Chinese Academy of Sciences7
 Phil J Murray合作论文数Sch Agr Food & Environm, Royal Agr Univ7Takahiro Yoshida合作论文数Natl Inst Environm Studies, Ctr Global Environm Res, Tsukuba, Ibaraki, Japan6
 G A McAuliffe合作论文数Rothamsted Res, Net Zero & Resilient Farming6
 Conor Cahalane合作论文数National Centre for Geocomputation, NUI6
 Robert J Orr合作论文数U.K.6B. Griffith合作论文数5
 Simon Pulley合作论文数Corresponding author.5
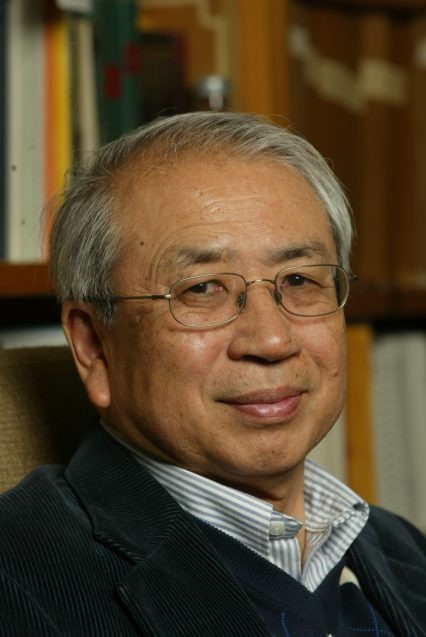 Taro Takahashi合作论文数Lamont-Doherty Earth Observatory, Columbia Climate School, Columbia University5Steven J. Granger合作论文数5
 Alice Milne合作论文数Rothamsted Research5
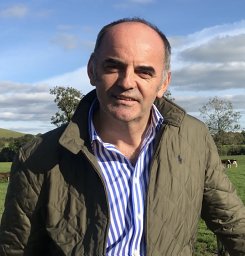 Timothy Mccarthy合作论文数National Centre for Geocomputation, National University of Ireland5
 Urska Demsar合作论文数Sch Geog & Sustainable Dev, Univ St Andrews5
 Tom Misselbrook合作论文数Department of Sustainable Agriculture Sciences, Rothamsted Research5
 Stephen Juggins (Steve Juggins)合作论文数School of Geography, Politics and Sociology, Newcastle University5
 Stelian Curceac合作论文数Dept Sustainable Agr Sci, Rothamsted Res4
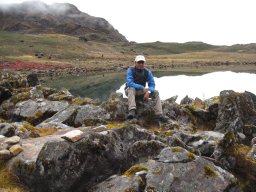 Hari Ram Upadhayay合作论文数Corresponding author.4Jianghua Zheng (郑江华)合作论文数Xinjiang University4
 Anita Shepherd合作论文数Rothamsted Research4J.M.B. Hawkins合作论文数4
 Jennifer A.J. Dungait合作论文数Sustainable Soils and Grassland Systems Department, Rothamsted Research – North Wyke4
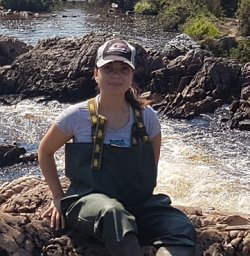 Gema Casal合作论文数Escola Politécnica Superior, Universidade de Santiago de Compostela4
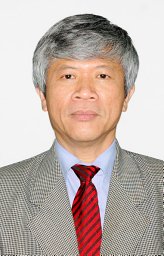 Hoang Huu Phe合作论文数4Hannah Fleming合作论文数3Walter Ayala合作论文数3Guanpeng Dong (董冠鹏)合作论文数3Evans Jessica合作论文数3Rovira P合作论文数3
 Mingbin Huang (黄明斌)合作论文数Institute of Soil and Water Conservation, Chinese Academy of Sciences & Ministry of Water Resources3




