Trans-boundary haze events in Southeast Asia are associated with large forest and peatland fires in Indonesia. These episodes of extreme air pollution usually occur during drought years induced by climate anomalies from the Pacific (El Niño Southern Oscillation) and Indian Oceans (Indian Ocean Dipole). However, in June 2013 – a non-drought year – Singapore's 24-hr Pollutants Standards Index reached an all-time record 246 (rated “very unhealthy”). Here, we show using remote sensing, rainfall records and other data, that the Indonesian fires behind the 2013 haze followed a two-month dry spell in a wetter-than-average year. These fires were short-lived (one week) and limited to a localized area in Central Sumatra (1.6% of Indonesia): burning an estimated 163,336 ha, including 137,044 ha (84%) on peat. Most burning was confined to deforested lands (82%; 133,216 ha). The greenhouse gas (GHG) emissions during this brief, localized event were considerable: 172 ± 59 Tg CO 2 -eq (or 31 ± 12 Tg C), representing 5–10% of Indonesia's mean annual GHG emissions for 2000–2005. Our observations show that extreme air pollution episodes in Southeast Asia are no longer restricted to drought years. We expect major haze events to be increasingly frequent because of ongoing deforestation of Indonesian peatlands.
In the wider context, there are two major issues to be faced. First, there is the need to achieve food security to feed the 1 billion hungry. To achieve this, food production needs to be increased by 60 percent by 2050, thus adaptation to climate change is critical. Second, there is the need to avoid dangerous climate change effects – in order to meet the “2 degree goal”, major emission cuts are required. As agriculture and land use contribute 30 percent of these emissions, reducing them must be part of the solution.
SUMMARY With global carbon credits valued at over US$100 billion/year, accounting under REDD will drive demand for high quality forest monitoring systems. The choice of system to adopt should be guided by good science. The adequacy and comparability of different national systems for forest carbon measurement under REDD have not been fully evaluated. There is a growing body of scientific and technical information on ground-based and remote-sensing methods of carbon measurement. This extensive, often conflicting, knowledge base has not been systematically reviewed in the transparent, readily-repeatable manner consistent with evidence-based practice. This paper argues that such an approach, regarded in medicine as the gold standard for evidence evaluation, is long overdue in forestry generally and carbon monitoring and assessment specifically. Preliminary findings from an international project set up to scope the potential for a systematic review approach indicate that this evidence-based approach would add value to REDD implementation.
Global demand for agricultural products such as food, feed, and fuel is now a major driver of cropland and pasture expansion across much of the developing world. Whether these new agricultural lands replace forests, degraded forests, or grasslands greatly influences the environmental consequences of expansion. Although the general pattern is known, there still is no definitive quantification of these land-cover changes. Here we analyze the rich, pan-tropical database of classified Landsat scenes created by the Food and Agricultural Organization of the United Nations to examine pathways of agricultural expansion across the major tropical forest regions in the 1980s and 1990s and use this information to highlight the future land conversions that probably will be needed to meet mounting demand for agricultural products. Across the tropics, we find that between 1980 and 2000 more than 55% of new agricultural land came at the expense of intact forests, and another 28% came from disturbed forests. This study underscores the potential consequences of unabated agricultural expansion for forest conservation and carbon emissions.
Planted forests constituted only 7 percent of the global forest area, or about 271 million hectares, in the year 2005, but they contributed a higher proportion of overall forest goods and services. In recent years, the broader significance and importance of planted forests have been recognized internationally, and standards for their responsible management have been established, relating to social and environmental as well as economic benefits. As one of the important provisions from planted forests, this study examined their future potential production of wood. From a baseline survey of 61 countries, 666 management schemes were established for planted forests, taking into account tree species, rotation lengths, production potential and end uses of wood. With an assumed average efficiency rate of 70 percent, the potential industrial wood production in 2005 from planted forests was estimated at 1.2 billion m(3) or about two-thirds of the overall wood production in that year. Scenarios until 2030 (detailed) and 2105 (simplified) were developed, indicating that wood production froth planted forests may increase considerably. Results are provided with breakdowns by region, species groups and end-use categories. It is concluded that the significance of planted forests, and recognition of their contributions to a range of development goals, are likely to increase in coming decades.
A goal of a National Forest Inventory (NFI) is the provision of information which is relevant and required for national level decision making and monitoring in forestry, but also for related sectors.This paper presents and discusses a pilot study from Costa Rica where in 2000/2001 a low intensity sampling approach was used to generate national level forestry information. On a 15 km x 15 km grid air photo plots were interpreted for forest and land cover type. Readily available 1997 aerial photographs were used that were, however, only available for about 70% of the country: of the 228 grid points for the whole country only 159 could be aerial photo interpreted. Out of the 15 km x 15 km base grid of sample points, a 2 x 3 subset was selected for field assessment, resulting in a sample of 40 cluster plots, each comprising of four elongated rectangular sub-plots of 150 m x 20 m located on the perimeter of a square of 500 m side length.Two novel components were integrated into the inventory: (1) the field plots were established on all lands, so that the tree resource was not only tallied inside forests but also on all other tree-bearing lands outside forests. (2) In addition to the biophysical information gathered on the traditional field plots, interviews were carried out with forest owners on the site of the field plots. in order to obtain data on the use of the forest resource.Field work was carried out by 6 field crews and took altogether about 3 months. Results were generated from the field samples for the entire country. Aerial photo based area estimates were compared to the corresponding estimations from field sampling for the same area. According to the field sampling the forest cover for Costa Rica in 2001 is estimated to be 48.4% (simple standard error percent 9.3%). An estimated 8.2% of the total volume (dbh > 30 cm, all species) is outside forest.This inventory took place with support from Food and Agriculture Organization (FAO) in the framework of FAO-Forest Resources Assessment's (FRA) Program Support to National Forest Assessments: it was carried out jointly by Sistema Nacional de Areas de Conservacion (SINAC). the Costa Rican authority responsible for forestry issues, and Centro Agronomico de Investigacion y Ensenanza (CATIE), an international agricultural research center, Experiences of the study were subsequently used to implement similar inventories in three more countries (Guatemala, Cameroon, The Philippine). (c) 2005 Elsevier B.V. All rights reserved.
Despite the importance of the world's humid tropical forests, our knowledge concerning their rates of change remains limited. Two recent programmes (FAO 2000 Forest Resources Assessment and TREES II), exploiting the global imaging capabilities of Earth observing satellites, have recently been completed to provide information on the dynamics of tropical forest cover. The results from these independent studies show a high degree of conformity and provide a good understanding of trends at the pan-tropical level. In 1990 there were some 1150 million ha of tropical rain forest with the area of the humid tropics deforested annually estimated at 5.8 million ha (approximately twice the size of Belgium). A further 2.3 million ha of humid forest is apparently degraded annually through fragmentation, logging and/or fires. In the sub-humid and dry tropics, annual deforestation of tropical moist deciduous and tropical dry forests comes to 2.2 and 0.7 million ha, respectively. Southeast Asia is the region where forests are under the highest pressure with an annual change rate of -0.8 to -0.9%. The annual area deforested in Latin America is large, but the relative rate (-0.4 to -0.5%) is lower, owing to the vast area covered by the remaining Amazonian forests. The humid forests of Africa are being converted at a similar rate to those of Latin America (-0.4 to -0.5% per year). During this period, secondary forests have also been established, through re-growth on abandoned land and forest plantations, but with different ecological, biophysical and economic characteristics compared with primary forests. These trends are significant in all regions, but the extent of new forest cover has proven difficult to establish. These results, as well as the lack of more detailed knowledge, clearly demonstrate the need to improve sound scientific evidence to support policy. The two projects provide useful guidance for future monitoring efforts in the context of multilateral environmental agreements and of international aid, trade and development partnerships. Methodologically, the use of high-resolution remote sensing in representative samples has been shown to be cost-effective. Close collaboration between tropical institutions and inter-governmental organizations proved to be a fruitful arrangement in the different projects. To properly assist decision-making, monitoring and assessments should primarily be addressed at the national level, which also corresponds to the ratification level of the multilateral environmental agreements. The Forest Resources Assessment 2000 deforestation statistics from countries are consistent with the satellite-based estimates in Asia and America, but are significantly different in Africa, highlighting the particular need for long-term capacity-building activities in this continent.
 Tomas Thuresson合作论文数Faculty of Forestry, Swedish University of Agricultural Sciences5
 n azzu合作论文数2Kevin Flesher合作论文数2Elis Molidena合作论文数2a meybeck合作论文数2
 Suzanne Redfern合作论文数2Jim Carle合作论文数2Sören Holm合作论文数2
 Miriam Marlier合作论文数Department of Environmental Health Sciences, Fielding School of Public Health, University of California, Los Angeles2
 Douglas Sheil合作论文数Department of Forest Ecology and Forest Management Group, Wageningen University & Research;Center for International Forestry Research2Jussi Lankoski合作论文数Department of Agricultural and Resource Economics;University of Maryland;Department of Agricultural and Resource Economics, University of Maryland2
 Martin J. Wooster合作论文数Department of Geography, King’s College London2
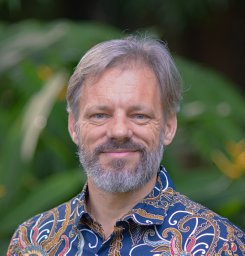 Vincent Gitz合作论文数Centre International;Nogent sur Marne;Nogent sur Marne, Centre International2
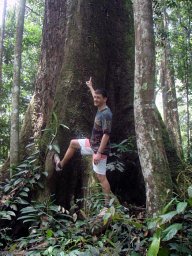 David L.A. Gaveau合作论文数Ctr Int Forestry Res2
 Sean Sloan合作论文数Department of Resource Management and Geography, The University of Melbourne2
 Daniel Murdiyarso合作论文数Center for International;Forestry Research;Center for International|Forestry Research2
 Louis V. Verchot合作论文数International Center for Tropical Agriculture2
 Frederic Achard合作论文数2hem sagar baral合作论文数1c kleinn合作论文数1Cordonnier-Segger M.-C.合作论文数1
 Robert Nasi合作论文数1
 Carla Ramirez合作论文数University of Kassel1
 Nick Brown合作论文数Dept Plant Sci, Univ Oxford1c haywood合作论文数1
 Navin Ramankutty合作论文数School of Public Policy and Global Affairs, Faculty of Arts, The University of British Columbia;Institute for Resources, Environment and Sustainability, Faculty of Science, The University of British Columbia1
 Kristell Hergoualc'H合作论文数Center for International Forestry Research1
 Aaron S Ruesch合作论文数1
 Holly Gibbs合作论文数Global Land Use and Environment Lab, University of Wisconsin-Madison;Department of Geography, University of Wisconsin-Madison1Salim Mohammad A合作论文数Center for International Forestry Research1Yaen Husna合作论文数1
 Joachim von Braun合作论文数Center for Development Research, University of Bonn1
 Jonathan Foley合作论文数Project Drawdown1
 Thomas Rudel合作论文数University of Würzburg1S Valverde合作论文数1
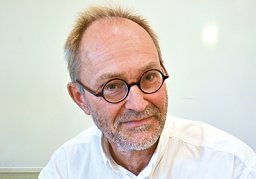 Lennart Olsson合作论文数Center for Environmental Studies, Lund University1
 Philippe Mayaux合作论文数Joint Research Centre, European Commission1
 Godert van Lynden合作论文数1
 Hans-Jurgen Stibig合作论文数1
 Diane C. Bates合作论文数1
 Eva Wollenberg合作论文数Center for International;Forestry Research;Center for International|Forestry Research1Murray K Clayton合作论文数1Finn Helles合作论文数1
 Johan Stendahl合作论文数Department of Soil and Environment, Swedish University of Agricultural Sciences1
 Ruth DeFries合作论文数Department of Ecology, Evolution, and Environmental Biology, Climate School, Columbia University;Earth Institute, Columbia University1
 Sandra R. Baptista合作论文数1
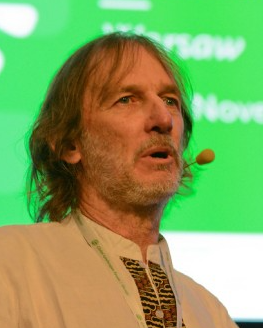 Bruce Morgan Campbell合作论文数Clim-Eat;Global Center on Adaptation;University of Copenhagen1Sven Snall合作论文数1




