Problem, research strategy, and findingsUrban sprawl and its impacts on quality of life remain a long-standing debate in planning, heightened today by challenges of health, housing, and climate crises. In this study we developed a multidimensional compactness index for 233 large and medium-sized U.S. metropolitan areas in 2020, drawing on 21 built environment variables across four urban form dimensions: density, land use mix, centering, and street connectivity. We successfully validated this index against transportation outcomes using both inferential and machine learning approaches. Finally, we developed a comparable index for 2010 and tracked changes in sprawl in the past decade. Results showed wide variations across regions, with Riverside (CA) ranking as the most sprawling (index = 54.32) and San Francisco (CA) as the most compact (index = 242.91) in 2020. According to our longitudinal analysis, metropolitan areas have become slightly more sprawling, but the rankings remained relatively stable. However, a closer look at score changes for individual metropolitan statistical areas (MSAs) revealed a different narrative. Atlanta (GA) is on the top of the list of most sprawling MSAs in both years though it has experienced an impressive increase in its compactness score (mostly centering score) during this period. We further discuss several MSAs with noticeable score changes. Our transportation analyses suggest 120 as a threshold value in which compactness meaningfully increases the predicted share of walking and transit commuting, whereas for the household vehicle ownership and average drive time, the threshold is roughly 100.Takeaway for practiceThe updated compactness indices and their changes since 2010 provide planners and policymakers with a practical tool to benchmark and monitor metropolitan development patterns. By identifying thresholds where compactness begins to yield significant transportation and sustainability benefits, the index can guide target setting, prioritize interventions, and support planning processes aimed at reducing car dependence and advancing sustainable metropolitan development.
Light rail transit (LRT) is often promoted as a sustainable mobility strategy to reduce traffic emissions. Yet its impact on vehicular CO₂ emissions through residential relocation around its stations remains poorly understood. This gap stems from the lack of household-level data to track residential moves and the limited understanding of how built environment changes associated with those moves shape vehicle use. To address this, we used 10 years of Data Axle microdata to track individual household relocation patterns near LRT stations in Salt Lake County, Utah. Our findings indicate that station areas concentrate residential moves among low-income renter households, with net out-migration and a small degree of displacement, indicating subtle socioeconomic and racial filtering in which lower-income, non-white households are replaced by slightly higher-income renters near LRT stations. In our analysis of travel-related environmental outcomes, we found a net increase in estimated vehicle miles traveled (VMT) and CO₂ emissions, as potential VMT reductions associated with station-area built environments are offset by moves to more car-dependent areas and the de-densification of station areas. Our findings suggest that targeted housing policies to retain low-income renters and the densification of station areas through a broader mix of socioeconomic groups may help maximize the environmental benefits of public transit.
This study evaluates the reliability and initial validity of multimodal LLMs for urban design assessment in a low-rise neighborhood in Seoul. Three human raters and three LLMs evaluated streetscape characteristics at 40 observation points using a standardized rubric. Reliability was assessed using ICC, Fleiss’ kappa, and human–LLM agreement measures. LLMs showed relatively high reliability for visually explicit design features but lower reliability for variables requiring proportional estimation, contextual interpretation, or detection of small-scale details. While some associations with perceived comfort were preserved, LLMs did not fully replicate human-rated results. Findings indicate that LLM suitability is element-specific rather than universal.
For promoting equitable communities and environmental sustainability, special attention has been given to expanding and improving public transit services to attract new riders. Different internal and external factors are associated with the transit demand analysis. This project aims to understand the ways of increasing transit ridership from the case studies of successful regions that have experienced growth in transit ridership in the pre-pandemic era (ridership growth nine years before the pandemic, 2010 to 2019). In this regard, twelve successful regions/ transit operators in terms of growth in transit ridership have been identified based on the National Transit Database (NTD). Then, the authors conducted interviews with the selected successful transit planners and other key personnel to find key internal and external factors associated with their success. The agencies attribute their ridership growth to rapid growth of population, land use changes, service expansion and improvements, incentives to students and vulnerable communities, restrictive parking, community outreach, and so on. This research should help policymakers and other transit agencies with decreasing ridership to boost their ridership following the strategies of successful agencies.
Transit ridership has long been studied, and the findings are elucidated by Taylor and Fink (2003) when they say, “to sum, transit ridership is largely, though not completely, a product of factors outside the control of transit managers.” Other than transit fare price, few studies have looked with much scrutiny at the factors that are within the purview of transit agencies. Transit service provision has been found to affect ridership, but “service provision” is often nebulously defined, shedding little light onto how transit managers can best provide service that will create returns in the form of transit ridership. This study examines the effects of spatial coverage and temporal frequency on transit ridership to determine just which lever is most effective. We use a cross-sectional study design with 152 regions around the United States. We employ structural equation modeling (SEM) to explain complex relationships that exist among interrelated variables. We find that both factors are strong predictors of transit ridership, with service frequency having a larger impact.
Urban transportation systems face challenges in providing connectivity, particularly for the first/last-miles of commuters' journeys. Micromobility services, such as e-scooters, have emerged as potential solutions to bridge this gap and enhance the efficiency and accessibility of public transit. As transit ridership demonstrates declining trends in the US, the integration of micromobility options with existing transit infrastructure presents a promising solution. This study aims to investigate the role of e-scooter services in enhancing first/last-mile connectivity within public transit systems, focusing on factors influencing adoption, barriers to integration, and potential policy interventions by studying Salt Lake County area. Methodologically, intercept surveys were conducted to gather demographic and behavioral insights from both e-scooter users and transit riders. Descriptive statistics, chi-square tests, and thematic qualitative analysis were employed. We found that the promise of e-scooters as conduits for transit connectivity remains largely unmet. Despite bustling transit stations, the number of e-scooter users was extremely low, and walking is the preferred way to connect to transit. Disparities in first/last-mile connectivity patterns between e-scooters and traditional modes of transport among transit riders further highlight the need for targeted interventions. The findings also revealed a strong preference for e-scooters among younger demographics, driven by factors such as convenience and enjoyment. However, challenges related to cost, accessibility, safety, and lack of familiarity hinder widespread adoption. While e-scooter services offer opportunities to enhance transit connectivity, addressing barriers requires efforts from policymakers and authorities.
Cities today continue to struggle with the converging twin crises of rising vehicular air pollution and emission-intensive land use, prompting a renewed urgency for climate-smart urban designs such as mixed-use (MXDs) and transit-oriented developments (TODs). Yet, not all developments are designed to have a transit-focused orientation, and even if they are, individual lifestyle choices confound their true effects. This study investigates whether those MXDs situated near high-frequency transit (a design typology we call Transit-Oriented Mixed-Use Developments (TOD-MXDs)) represent a more sustainable antidote to the environmental and mobility crises afflicting cities. Leveraging the largest geo-spatially harmonized database of individual-level and built environment characteristics across 36 diverse U.S. regions, we employ a mix of quasi-experimental design and advanced multivariate regression modeling to estimate travel characteristics and emissions outcomes. Results showed that although TOD-MXDs remain relatively scarce, they consistently outperform their non-transit-oriented counterparts, generating about 20 % less VMT, higher walking (87.6 %) and biking (83 %) trip shares, and significantly lower CO(2)e emissions, even after accounting for residential self-selection and the full suite of 7-D built environment variables. Furthermore, a unit increase in the presence of transit around mixed-use designs was associated with a similar to 13.8 % reduction in VMT, suggesting that coupling land-use diversity with transit integration produces a synergistic effect that advances low-carbon and sustainable city outcomes. As conventional planning and policymakers strive for climate-resilient and healthy communities, this study makes a bold case: TOD-MXDs are not just better, they may be essential to the future of climate adaptation in cities through built-environment design.
This study aims to improve the predictive accuracy of metropolitan planning organizations’ (MPOs’) travel demand models (TDM) by unraveling the factors influencing transportation mode choices. By exploring the interplay between trip characteristics, socioeconomics, built environment features, and regional conditions, we aim to address existing gaps in MPOs’ TDMs which revolve around the need to also integrate non-motorized modes and a more comprehensive array of features. Additionally, our objective is to develop a more robust predictive model compared to the current nested logit (NL) and multinomial logit (MNL) models commonly employed by MPOs. We apply a one-vs-rest random forest (RF) model to predict mode choices (Home-based-Work, Home-Based-Other, and non-home-based) for over 800,000 trips by 80,000 households across 29 US regions. Validation results demonstrate the RF model’s superior performance compared to conventional NL/MNL models. Key findings highlight that increased travel time and distance are associated with more auto trips, while household vehicle ownership significantly affects car and transit choices. Built environment features, such as activity density, transit density, and intersection density, also play crucial roles in mode preferences. This study offers a more robust predictive framework that can be directly applied in MPO TDMs, contributing to more accurate and inclusive transportation planning.
Reducing vehicle lane widths has been proposed as an effective strategy to decrease vehicle speeds and enhance road safety. However, the safety benefits of narrower travel lanes remain a topic of debate due to mixed findings in the literature. This study examines the relationship between lane width, vehicle speed, and crash occurrence to comprehensively understand their impact on road safety and transportation planning. Using data from 320 urban arterial sections in Utah, the analysis reveals that narrower lane widths are associated with reduced vehicle speeds. For every additional foot of lane width, 85th and 95th percentile speeds increase by 1.012 mph and 1.088 mph, respectively. Furthermore, injury crash modeling indicates that a one-foot increase in lane width is associated with a 38.3% increase in the odds of an injury crash on a roadway section. These findings contribute to the growing evidence supporting the implementation of narrower lane widths as a strategy to improve road safety, foster multimodal infrastructure, and promote sustainable urban transportation systems. We recommend that UDOT adopt a minimum lane width of 10 or 11 feet for arterials in highly urbanized areas, such as downtowns and major activity centers.
Mixed-use developments (MXDs) have dovetailed nicely as a development design strategy to lower VMT by concentrating diverse activities within walkable compact environments. Despite their conceptual appeal, estimating their actual impacts on vehicle trips and environmental quality remains both limited and challenging for agencies and local governments due to inconsistencies in existing traffic impact methodologies, which fail to account for regional variability. This study addresses these limitations by using advanced Gaussian multi-level regression models and K-fold cross-validation, incorporating the famous 7-D built environment variables to estimate comparative VMT and GHG emissions across 710 MXDs in 36 U.S. regions. We find that MXDs generate about one-third less VMT than conventional developments, with up to an 80% reduction in certain regions. Over time, MXDs generate even fewer vehicle trips (about 50% less) and significantly lower CO2e, suggesting positive impacts on lessening both traffic congestion and climate pollution in cities. Our study refines the methodology for estimating developmentgenerated VMT while providing insights for shaping low-emission communities that align with modern sustainability goals.
The author draws upon case examples of some of today's most acclaimed developments in this book, and recommends best practice guidelines to help developers create vibrant, livable communities-and still make money. For years, Florida's planners and developers have had to deal with some of the most difficult growth management problems. Now planners and developers across the nation can benefit from the valuable lessons Florida offers on combating urban sprawl. Ewing first searched the state for the best contemporary developments, then distilled their lessons into guidelines for directing new development and assessing the quality of existing development. The 43 practices outlined in this exciting book cover four areas of development-land use, transportation, the environment, and housing. They apply to a broad range of development projects, including small planned communities, residential subdivisions, and commercial centers. The book's recommendations are based upon the experiences of successful developers and supported by empirical research. The proof lies in the compelling real-world examples Ewing highlights throughout the text. Illustrated with dozens of photographs and written in a lively style, this book is must reading for all those seeking better ways to plan and design communities. Developers will find proven, feasible land development regulations and benchmarks against which to evaluate development proposals.
This study investigates the relationship among lane width, velocity, and accident rates to enhance understanding their impact on road safety and transportation. Analysis of data from 320 urban arterial sections in Utah indicated that narrower lane widths can improve road safety. Reduced vehicle speeds were related to narrower lanes on urban arterials, which did not result in increased collision rates. Reducing one foot in lane width led to an average speed decrease exceeding one mph. Additional factors influencing speed on urban arterials encompass the number of lanes, the existence of medians, on-street parking, roadside obstructions, and block length. Safety modeling indicated no clear correlation between lane width and total crash frequency per mile. Injury crash rates positively correlated with lane width and speed, suggesting that broader lanes and elevated speeds augment the probability of injury crashes. Additional critical elements affecting crash statistics comprised the number of lanes and the Average Annual Daily Traffic (AADT) per lane (in thousands). The study endorses the reduction of lane widths as a viable approach to augment road safety and boost urban transportation infrastructure. The results provide essential direction for policymakers and transportation authorities aiming to enhance road safety and efficiency.
Many of the larger US metropolitan regions promote polycentric development as a way of fostering livability, accessibility, and sustainability. Polycentric urban structures can increase transit ridership, promote active transportation, and decrease vehicle miles traveled (VMT) and CO2 emissions. Although many regions include ambitious polycentric aspirations in their plans, only a few follow up with rigorous implementation and see their efforts come to fruition. The topic of implementation is also widely omitted from scholarly inquiry. This research aims to explore three examples of successful implementation of urban polycentricity: Portland, Oregon; Seattle, Washington; and Denver, Colorado. Each region employs a very distinct polycentric development model, but each relies heavily on its regional governance organization for direction, guidance, and even command in the implementation process. To understand specific strategies and methods used by each region, the authors conducted interviews with metropolitan planning organizations, central cities, and transit agencies in the three regions and used qualitative techniques to analyze the interview transcripts and collected documents. As regional governance organizations play a crucial role in implementing regional plans, their policies and practices were also investigated by the authors. Based on collected data and insights, we conclude that the three regions are great examples of an advanced implementation of polycentric development. This research can be helpful to other US metropolitan regions that wish to promote polycentric development. The lessons learned from the three case studies can provide guidance and possible paths to successful implementation.
Throughout the United States, Metropolitan Planning Organizations (MPOs) are increasingly attempting to shape local land use planning. Some MPOs have developed funding programs that redirect highway and road construction dollars to support less auto-centric community development - which we call Transportation and Land-Use Connection (TLC) programs. Based on a survey of 92 MPOs (out of 402 contacted) and a review of relevant documents, our paper aims to understand the scope and influence of these TLC programs on communities and how their impact is measured. We found that at least 24 MPOs had TLC programs. Our findings show that despite federal funding predominantly supporting these programs, state, county, local, and other regional agencies also provide support. Population size appears to be the most significant influence on an MPO's participation in a TLC program. Most programs measure pre-implementation success through selection criteria reflecting program goals rather than direct impact measurement. For those that do measure after grants have been awarded, increased non-automobile shares tax revenue and jobs-housing balance were the most common ways success was measured. These findings can help MPOs with existing TLC programs improve formulation guidelines and assist MPOs without such programs in adopting them in their jurisdictions.
Climate threats' increased frequency and intensity have recently severely threatened human health. In particular, racial/ethnic minority people have been disproportionately exposed to extreme heat and air pollution, but the cause of this is unclear. Green infrastructure can effectively mitigate heat waves and air pollution but is disproportionately distributed. Previous studies found that the introduction of green infrastructure could lead to green gentrification, which increases housing prices and drives out minorities nearby. This phenomenon could be an essential cause of climate threat inequity. Thus, this study, focusing on the linked process, measured the direct and indirect effect of neighborhood green infrastructure, extreme heat, and air pollution on single-family housing prices from 2000 to 2021 in LA County. We found that neighborhood extreme heat, air pollution (negatively), and green infrastructure (positively) have significantly affected housing prices and have increased recently. Notably, green infrastructure's indirect effects via mitigation of extreme heat and air pollution on housing prices increased more recently. In addition, recently increased inequity of green, climate, and housing prices by race/ethnicity showed that the increased impact of extreme heat, air pollution, and green infrastructure on housing prices could be a key reason for racial/ethnic minority people's green and climate gentrification acceleration.
Our study compared observed traffic volumes in the Bus Rapid Transit (BRT-Light) corridor to those predicted using two different quasi-experimental methods. The first quasi-experimental design, referred to as interrupted time series, assumes the trends in traffic on BRT alignment from 2013 to 2017 continue through to 2019 after BRT-Light is in place. Making that assumption, traffic volume on the BRT alignment is 2514 vehicles per day lower (-7.38%) than one would expect based on the preexisting trend. The second quasi-experimental design is called a before-after design with a control group, which assumes that traffic volume on the BRT route would increase by the same percentage as traffic on parallel streets to the BRT line, that is 2.30 percent or 645 VPD between before and after. Also, BRT alignment's traffic volume was reduced by 1249 VPD or 4.78 percent more rather than outside of BRT corridor, and 17,632 VPD or 9.33 percent considering trip generation. Meanwhile, transit ridership in the corridor increased by 8687 passengers per day (122.66%) more than expected with the introduction of BRT, which helps account for the effective reduction of vehicular traffic on the streets that comprise the BRT alignment. Through the section analysis, we found that dedicated right-of-way reduced traffic effectively. Our estimates suggest that BRT-Light will result in an annual reduction of 17,886,229 pounds of CO2 emissions and 914,614 gallons of gasoline consumption. Based on these results, we conclude that BRT-Light had a positive effect on easing vehicle traffic volume and emissions in the Provo-Orem metropolitan area.
Introduction: Introducing new public transit systems impacts the surrounding built environment, and changes in the built environment can affect travel behavior. Prior research has yet to thoroughly conduct a comprehensive exploration of the influence of new investments in public modes of transit, particularly streetcars, on motor vehicle crashes occurring on adjoining streets, considering other related factors. In particular, the difference between short-term and mid-term impacts of streetcars considering initial break-in periods has yet to be thoroughly conducted. This study focuses on the short-term and mid-term effects of the streetcar on total, injury, and pedestrian-involved vehicle crash rates on the adjacent street, considering traffic volume, traffic speeds, and traffic conflicts (transit ridership, pedestrian volume, and traffic policy). Data & Method: This paper used the Utah Department of Transportation's (UDOT) crash count, annual average daily traffic (AADT), iPeMS data, Utah Transit Authority's (UTA) ridership, manually calculated pedestrian volume from Google Street View, and conducted interviews with UDOT's experts. In the method, we used three quasi-experimental research designs: (1) before-after without a control group, (2) interrupted time series, and (3) before-after with a control group. In addition, to identify the cause of this impact, we examined multiple dimensions, including traffic volume, traffic speeds, transit ridership, pedestrian volume, and adjustments in traffic policy changes. Results: As a result, the establishment of the S-Line streetcar eventually led to a significant decrease in total (short: 11 %, mid:-15 %), injury (short:-9%, mid:-41 %), and pedestrian-involved (short:-25%, mid:-43 %) crash rates on the adjacent street, especially after the streetcar was fully established (3 years after). In particular, injury and pedestrian-involved crash rates decreased significantly. Also, we found that increased drivers' awareness and vitality of the street due to the increased transit ridership (short: 43 %, mid: 50 %), increased pedestrian volume (short: 35 %, mid: 75 %), and improvement of traffic signal on the adjacent street can be the main causes. Practical Applications: The outcomes of this study are considered to help establish short-term and mid-term traffic policies that consider public transit improvements such as streetcars.
One major challenge of a public transit system is first- and last-mile (FLM) connectivity. With the advent of smart technology and on-demand transportation services, shared micromobility is believed to provide a low-cost solution for bridging the first- and last-mile gap. However, several studies have arrived at mixed conclusions about the FLM achieved by shared mircomobility. This study explores the causal effect of shared dockless e-scooters on last-mile connectivity to public transit by controlling confounding variables, including built environment and socioeconomic status. The study employs a quasi-experimental design. This study defines last-mile connectivity, here, treatment effect, if e-scooter service areas near rail stations increase metro rail ridership after the introduction of e-scooter service. After matching pairs between treatment and control groups using propensity score matching, we use difference-in-difference regression to examine the causal relationship between shared dockless e-scooter service and ridership changes in public rail transit before and after e-scooter service. The findings indicate that the treatment effect, a higher e-scooter trip density around transit buffer areas, positively impacts monthly rail ridership. In conclusion, planning and transportation agencies can develop street design guidelines or transit-oriented development to encourage the active and safe use of e-scooters, thereby promoting better integration of shared dockless e-scooters with transit systems.
Despite efforts to mitigate climate change by promoting active travel, limited research has focused on climate adaptation for active transportation (CAAT) initiatives. To address this gap, we conducted a qualitative study based on interviews with 30 planning professionals to uncover what CAAT projects U.S. cities are implementing, their barriers, and their facilitators. We found that U.S. cities are increasingly implementing CAAT projects such as street trees and green stormwater infrastructure to address threats like extreme heat and pluvial flooding. Importantly, CAAT projects require collaborations between city departments (e.g., transportation and forestry). We also identified a complex network of barriers and facilitators shaping CAAT project implementation. Funding, politics, laws, and cross-department collaborations can be barriers and facilitators, and supportive (or unsupportive) politics and laws are strongly connected. Additionally, underserved communities face unique barriers to implementing CAAT projects, but recent facilitators such as dedicated funding have contributed to equitable investment.
 Hamidi Shima合作论文数Department of City and Metropolitan Planning, College of Architecture and Planning, 375 S 1530 E RM 235, Salt Lake City, UT 84112, USA.46
 Guang Tian合作论文数31
 Keunhyun Park合作论文数Utah State Univ26
 Chris Nelson合作论文数Development and Environment, College of Architecture, Planning and Landscape Architecture, The University of Arizona25
 Sadegh Sabouri合作论文数Senseable City Lab, MIT23
 Keith Bartholomew合作论文数College of Architecture;University of Utah;College of Architecture, University of Utah17
 Torrey Lyons合作论文数Dept Urban Planning, Univ N Carolina13Philip Stoker合作论文数11Otto Jose Clemente合作论文数11
 m miller合作论文数Metro Analytics10Susan J. Petheram合作论文数10
 Ross C. Brownson合作论文数Institute for Public Health, Washington University in St. Louis;Brown School, Washington University in St. Louis;School of Medicine, Washington University in St. Louis9
 Susan Handy合作论文数Department of Environmental Science and Policy, University of California, Davis9
 Cynthia Chen合作论文数Department of Civil & Environmental Engineering, University of Washington9
 James Grace合作论文数Wetland and Aquatic Research Center, U.S. Geological Survey, U.S. Department of the Interior9j p goates合作论文数8
 Wookjae Yang合作论文数8Neckerman Kathryn M合作论文数Columbia Population Research Center8James W. Quinn合作论文数7jenny h liu合作论文数7David Proffitt合作论文数7Li Chen合作论文数7
 Dong-Ah Choi合作论文数Dept City & Metropolitan Planning, Univ Utah7
 Andrew G Rundle合作论文数Department of Epidemiology, Mailman School of Public Health, Columbia University;New York Academy of Medicine7Meakins Gail合作论文数7
 William H. Greene合作论文数Leonard N. Stern School of Business, New York University;Henry Kaufman Management Center, Department of Economics, New York University7
 John Luciano Renne合作论文数State University of New Jersey7
 Keuntae Kim合作论文数Dept City & Metropolitan Planning Coll Architectu, Univ Utah6Purciel-Hill Marnie合作论文数6Jerry Walters合作论文数6michelle ernst合作论文数5William Schroeer合作论文数5Dejan Eskic合作论文数5Fariba Siddiq合作论文数5
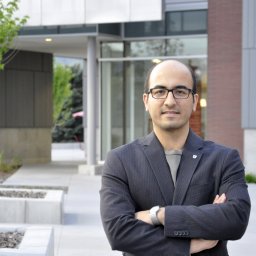 s hassan ameli合作论文数Dept City & Metropolitan Planning, Univ Utah5MaryBeth DeAnna合作论文数4
 Andrea Garfinkel-Castro合作论文数4Barbara McCann合作论文数4
 David Berrigan合作论文数National Cancer Institute, Division of Cancer Control and Population Sciences, National Institutes of Health4
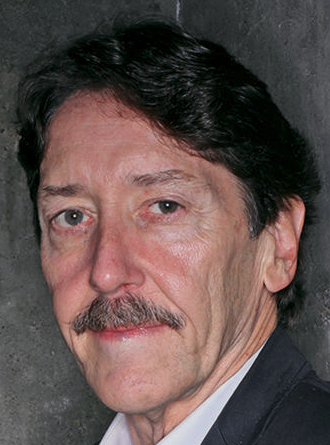 Robert Cervero合作论文数Institute of Transportation Studies, University of California, Berkeley;Department of City & Regional Planning, College of Environmental Design, University of California, Berkeley4
 Kathryn Terzano合作论文数City & Regional Planning, The Ohio State University4Frank Gallivan合作论文数4alex joyce合作论文数3Thomas Schmid合作论文数3emily meharg合作论文数3Carl Duke合作论文数3Fatemeh Kiani合作论文数3Katherine Kittrell合作论文数Univ Utah3
 Junsik Kim合作论文数Dept City & Metropolitan Planning, Univ Utah3




