Many agricultural regions rely on snowmelt runoff as a source of water for irrigation, but climate change is altering runoff dynamics, making it difficult to meet increasing irrigation water demands. It remains unclear whether irrigation water shortages are systematically occurring in snow-dependent regions across the globe. Here, we study global trends in surface runoff used to meet irrigation demands by linking rainfall and snowmelt runoff data with irrigation consumption data (1985-2020). Focusing on the most snow-dependent agricultural basins, we find that surface water runoff volumes have slightly decreased and snowmelt runoff is occurring significantly earlier in time (advancing an average of 8 d). These changes, coupled with an almost universal trend of increasing irrigation water consumption, have made snowmelt runoff less able to meet irrigation needs during crop growing seasons and increased reliance on alternative water sources (interbasin transfers or reservoirs). These results highlight potential future challenges for irrigated agriculture in snow-dependent regions.
Forests are in decline worldwide due to human activities such as agricultural expansion, urbanization, and mineral extraction. Forest loss due to generally temporary causes, such as wildfire and logging, is important to distinguish from permanent land use conversion due to the differing ecological and climate impacts of these disturbances and for the purposes of developing effective policies and management strategies. Existing global maps of the drivers of forest loss that are widely used are not spatially or thematically detailed enough for decision makers at local-to-regional scales, such as governments, land managers, or companies. Using publicly available satellite observations (Landsat, Sentinel) and ancillary biophysical and population data, we developed a 1 km resolution, global map of the dominant drivers of forest loss from 2001 to 2022 with seven classes: permanent agriculture (e.g. commodity crops or pasture), hard commodities (e.g. mining), shifting cultivation, logging, settlements and infrastructure, wildfire, and other natural disturbances. We interpreted nearly 7000 reference samples to train a global neural network model that classifies the driver of tree cover loss with an overall accuracy of 90.5%. Our results show that permanent agriculture was the leading driver of forest loss globally, representing 35% of loss from 2001 to 2022. The drivers of tree cover loss vary by region, with the leading driver identified as logging in Europe, permanent agriculture across the tropics, and wildfire in Russia, the Asian mainland, North America, and Oceania. Our results enable assessment of forest disturbance dynamics from local to global scales and can support tracking progress towards corporate and governmental zero-deforestation commitments, monitoring deforestation risks within jurisdictions and supply chains, and assessment of global biodiversity targets.
The article describes production of a high spatial resolution (30 m) bimonthly light use efficiency (LUE) based gross primary productivity (GPP) data set representing grasslands for the period 2000 to 2022. The data set is based on using reconstructed global complete consistent bimonthly Landsat archive (400TB of data), combined with 1 km MOD11A1 temperature data and 1° CERES Photosynthetically Active Radiation (PAR). First, the LUE model was implemented by taking the biome-specific productivity factor (maximum LUE parameter) as a global constant, producing a global bimonthly (uncalibrated) productivity data for the complete land mask. Second, the GPP 30 m bimonthly maps were derived for the global grassland annual predictions and calibrating the values based on the maximum LUE factor of 0.86 gCm−2d−1MJ−1. The results of validation of the produced GPP estimates based on 527 eddy covariance flux towers show an R-square between 0.48–0.71 and root mean square error (RMSE) below ~2.3 gCm−2d−1 for all land cover classes. Using a total of 92 flux towers located in grasslands, the validation of the GPP product calibrated for the grassland biome revealed an R-square between 0.51–0.70 and an RMSE smaller than ~2 gCm−2d−1. The final time-series of maps (uncalibrated and grassland GPP) are available as bimonthly (daily estimates in units of gCm−2d−1) and annual (daily average accumulated by 365 days in units of gCm−2yr−1) in Cloud-Optimized GeoTIFF (~23TB in size) as open data (CC-BY license). The recommended uses of data include: trend analysis e.g., to determine where are the largest losses in GPP and which could be an indicator of potential land degradation, crop yield mapping and for modeling GHG fluxes at finer spatial resolution. Produced maps are available via SpatioTemporal Asset Catalog (http://stac.openlandmap.org) and Google Earth Engine.
Pastures and grasslands are the largest land cover of Earth's surface, comprising fundamental landscapes for water and nutrient cycling, food production, biodiversity conservation and land management in the planet. Monitoring the conditions and productivity aspects of these lands can lead to major contributions for land degradation mitigating in line with sustainable development goals defined by the United Nations (UN) 2030 agenda. Nevertheless, an operational approach able to monitor productivity of pastures and grasslands at global scale and high spatial resolution (e.g. 30-m) is a challenging research problem. Aiming to contribute with this topic, the current work present a methodology to derive 30-m bi-monthly time-series of Gross Primary Productivity (GPP) for pastures and grasslands of the world based on GLAD Landsat ARD (collection-2) and a customized Light Use Efficiency Model (LUE). The Landsat imagery were aggregated by every two months and gapfilled by an temporal interpolation based on Fast Fourier Transform (FFT). The complete, consistent and gapfilled Landsat time-series was used to estimate the Fraction of Photosynthetically Active Radiation (FPAR) and Land Surface Water Index (LSWI), which combined with 1-km MODIS temperature (MOD11A2) and 1° CERES Photosynthetically Active Radiation (SYN1deg v4.1 - PAR) images resulted in 30-m global GPP time-series product from 2000 onwards. Our preliminary validation approach, based on FLUXNET2015 data, indicated a R2 of 0.67 and RMSE of 2.06 for in-situ stations located Europe. We are working to release the first version of the product as open data (CC-BY license) in the context of the Global Pasture Watch project and the World Resources Institute's Land & Carbon Lab, establishing partnerships with local organization and research institute to collect feedback and additional validation data to improve further versions of the product.
Yield gaps, here defined as the difference between actual and attainable yields, provide a framework for assessing opportunities to increase agricultural productivity. Previous global assessments, centred on a single year, were unable to identify temporal variation. Here we provide a spatially and temporally comprehensive analysis of yield gaps for ten major crops from 1975 to 2010. Yield gaps have widened steadily over most areas for the eight annual crops and remained static for sugar cane and oil palm. We developed a three-category typology to differentiate regions of ‘steady growth’ in actual and attainable yields, ‘stalled floor’ where yield is stagnated and ‘ceiling pressure’ where yield gaps are closing. Over 60% of maize area is experiencing ‘steady growth’, in contrast to ∼12% for rice. Rice and wheat have 84% and 56% of area, respectively, experiencing ‘ceiling pressure’. We show that ‘ceiling pressure’ correlates with subsequent yield stagnation, signalling risks for multiple countries currently realizing gains from yield growth.
AbstractThe paper describes the production and evaluation of global grassland extent mapped annually for 2000–2022 at 30 m spatial resolution. The dataset showing the spatiotemporal distribution of cultivated and natural/semi-natural grassland classes was produced by using GLAD Landsat ARD-2 image archive, accompanied by climatic, landform and proximity covariates, spatiotemporal machine learning (per-class Random Forest) and over 2.3 M reference samples (visually interpreted in Very High Resolution imagery). Custom probability thresholds (based on five-fold spatial cross-validation) were used to derive dominant class maps with balanced user’s and producer’s accuracy, resulting in f1 score of 0.64 and 0.75 for cultivated and natural/semi-natural grassland, respectively. The produced maps (about 4 TB in size) are available under an open data license as Cloud-Optimized GeoTIFFs and as Google Earth Engine assets. The suggested uses of data include (1) integration with other compatible land cover products and (2) tracking the intensity and drivers of conversion of land to cultivated grasslands and from natural / semi-natural grasslands into other land use systems.
The paper describes the production and evaluation of global grassland dynamics mapped annually for 2000-2022 at 30~m spatial resolution. The dataset showing the spatiotemporal distribution of cultivated and natural/semi-natural grassland classes was produced by using GLAD Landsat ARD-2 image archive, accompanied by climatic, landform and proximity covariates, spatiotemporal machine learning (per-class Random Forest) and over 2.3M reference samples (visually interpreted in Very High Resolution imagery). Custom probability thresholds (based on five-fold spatial cross-validation) were used to derive dominant class maps with balanced precision and recall values, 0.64 and 0.75 for cultivated and natural/semi-natural grassland, respectively. The produced maps (about 4~TB in size) are available under an open data license as Cloud-Optimized GeoTIFFs and as Google Earth Engine assets. The suggested uses of data include (1) integration with other compatible land cover products and (2) tracking the intensity and drivers of conversion of land to cultivated grasslands and from natural / semi-natural grasslands into other land use systems.
Agriculture’s global environmental impacts are widely expected to continue expanding, driven by population and economic growth and dietary changes. This Review highlights climate change as an additional amplifier of agriculture’s environmental impacts, by reducing agricultural productivity, reducing the efficacy of agrochemicals, increasing soil erosion, accelerating the growth and expanding the range of crop diseases and pests, and increasing land clearing. We identify multiple pathways through which climate change intensifies agricultural greenhouse gas emissions, creating a potentially powerful climate change–reinforcing feedback loop. The challenges raised by climate change underscore the urgent need to transition to sustainable, climate-resilient agricultural systems. This requires investments that both accelerate adoption of proven solutions that provide multiple benefits, and that discover and scale new beneficial processes and food products.
Processing large collections of earth observation (EO) time-series, often petabyte-sized, such as NASA’s Landsat and ESA’s Sentinel missions, can be computationally prohibitive and costly. Despite their name, even the Analysis Ready Data (ARD) versions of such collections can rarely be used as direct input for modeling because of cloud presence and/or prohibitive storage size. Existing solutions for readily using these data are not openly available, are poor in performance, or lack flexibility. Addressing this issue, we developed TSIRF (Time-Series Iteration-free Reconstruction Framework), a computational framework that can be used to apply diverse time-series processing tasks, such as temporal aggregation and time-series reconstruction by simply adjusting the convolution kernel. As the first large-scale application, TSIRF was employed to process the entire Global Land Analysis and Discovery (GLAD) ARD Landsat archive, producing a cloud-free bi-monthly aggregated product. This process, covering seven Landsat bands globally from 1997 to 2022, with more than two trillion pixels and for each one a time-series of 156 samples in the aggregated product, required approximately 28 hours of computation using 1248 Intel® Xeon® Gold 6248R CPUs. The quality of the result was assessed using a benchmark dataset derived from the aggregated product and comparing different imputation strategies. The resulting reconstructed images can be used as input for machine learning models or to map biophysical indices. To further limit the storage size the produced data was saved as 8-bit Cloud-Optimized GeoTIFFs (COG). With the hosting of about 20 TB per band/index for an entire 30 m resolution bi-monthly historical time-series distributed as open data, the product enables seamless, fast, and affordable access to the Landsat archive for environmental monitoring and analysis applications.
Agricultural irrigation induces greenhouse gas emissions directly from soils or indirectly through the use of energy or construction of dams and irrigation infrastructure, while climate change affects irrigation demand, water availability and the greenhouse gas intensity of irrigation energy. Here, we present a scoping review to elaborate on these irrigation-climate linkages by synthesizing knowledge across different fields, emphasizing the growing role climate change may have in driving future irrigation expansion and reinforcing some of the positive feedbacks. This Review underscores the urgent need to promote and adopt sustainable irrigation, especially in regions dominated by strong, positive feedbacks.
Irrigation accounts for ~70% of global freshwater withdrawals and ~90% of consumptive water use, driving myriad Earth system impacts. In this Review, we summarize how irrigation currently impacts key components of the Earth system. Estimates suggest that more than 3.6 million km2 of currently irrigated land, with hot spots in the intensively cultivated US High Plains, California Central Valley, Indo-Gangetic Basin and northern China. Process-based models estimate that ~2,700 ± 540 km3 irrigation water is withdrawn globally each year, broadly consistent with country-reported values despite these estimates embedding substantial uncertainties. Expansive irrigation has modified surface energy balance and biogeochemical cycling. A shift from sensible to latent heat fluxes, and resulting land–atmosphere feedbacks, generally reduce regional growing season surface temperatures by ~1–3 °C. Irrigation can ameliorate temperature extremes in some regions, but conversely exacerbates moist heat stress. Modelled precipitation responses are more varied, with some intensive cropping regions exhibiting suppressed local precipitation but enhanced precipitation downstream owing to atmospheric circulation interactions. Additionally, irrigation could enhance cropland carbon uptake; however, it can also contribute to elevated methane fluxes in rice systems and mobilize nitrogen loading to groundwater. Cross-disciplinary, integrative research efforts can help advance understanding of these irrigation–Earth system interactions, and identify and reduce uncertainties, biases and limitations. Irrigation accounts for a substantial proportion of global water usage and can have biophysical and biogeochemical impacts on Earth systems. This Review outlines key irrigation–Earth system interactions, and discusses the effect of future climate and socioeconomic changes on irrigation patterns and their interaction.
Wildfires are a growing concern to society and the environment in many parts of the world. Within the United States, the land area burned by wildfires has steadily increased over the past 40 years. Agricultural land management is widely understood as a force that alters fire regimes, but less is known about how wildfires, in turn, impact the agriculture sector. Based on an extensive literature review, we identify three pathways of impact—direct, downwind and downstream—through which wildfires influence agricultural resources (soil, water, air and photosynthetically active radiation), labour (agricultural workers) and products (crops and livestock). Through our pathways framework, we highlight the complexity of wildfire–agriculture interactions and the need for collaborative, systems-oriented research to better quantify the magnitude of wildfire impacts and inform the adaptation of agricultural systems to an increasingly fire-prone future.
This repository contains datasets used in the manuscript entitled "Bootstrapping outperforms community-weighted approaches for estimating the shapes of phenotypic distributions" by Maitner et al. For details of these datasets, see https://www.authorea.com/users/244803/articles/523535-on-estimating-the-shape-and-dynamics-of-phenotypic-distributions-in-ecology-and-evolution. All datasets contain individual (and in some cases, organ-level) trait measurements. The dataset "all_traits_unscaled_RMBL.rds" was compiled by Christine Lamanna, Lindsey L Sloat, Andrew J. Kerkhoff, and Brian J. Enquist, Full details in https://www.authorea.com/users/244803/articles/523535-on-estimating-the-shape-and-dynamics-of-phenotypic-distributions-in-ecology-and-evolution The dataset "Julies_panama_data.xlsx" was compiled by Julie Messier and collaborators, full details here: https://doi.org/10.1111/j.1461-0248.2010.01476.x The dataset "TreefrogTadpoles.xlsx" was compiled by Nick Rasmussen, full details here: https://www.jstor.org/stable/44082203 The dataset "zooplankton_2019.zip" was compiled by Ewa Merz and Francesco Pomati. For more details, see www.aquascope.ch , https://github.com/mbaityje/plankifier, https://github.com/tooploox/SPCConvert, and https://www.authorea.com/users/244803/articles/523535-on-estimating-the-shape-and-dynamics-of-phenotypic-distributions-in-ecology-and-evolution .
Climate change is altering the timing and magnitude of snowmelt, which may either directly or indirectly via global trade affect agriculture and livelihoods dependent on snowmelt. Here, we integrate subannual irrigation and snowmelt dynamics and a model of international trade to assess the global redistribution of snowmelt dependencies and risks under climate change. We estimate that 16% of snowmelt used for irrigation is for agricultural products traded globally, of which over 70% is from five countries. Globally, we observe a prodigious snowmelt dependence and risk diffusion, with particularly evident importing of products at risk in western Europe. In Germany and the UK, local fraction of surface-water-irrigated agriculture supply exposed to snowmelt risks could increase from negligible to 16% and 10%, respectively, under a 2 °C warming. Our results reveal the trade-exposure of agricultural supplies, highlighting regions and crops whose consumption may be vulnerable to changing snowmelt even if their domestic production is not. Agriculture dependent on snowmelt will face serious challenges under climate change, which increases risks for countries that import these crop products. Food security and livelihoods in countries heavily exposed to global food trade may be vulnerable even though domestic production is not affected.
Rising competition for crop usage presents policy challenges exacerbated by poor understanding of where crops are harvested for various uses. Here we create high-resolution global maps showing where crops are harvested for seven broad use categories-food, feed, processing, export, industrial, seed and losses. Yields for food crops are low relative to other crop-use categories. It is unlikely, given current trends, that the minimum calorie requirement to eliminate projected food undernourishment by 2030 will be met through crops harvested for direct food consumption, although enough calories will be harvested across all usages. Sub-Saharan African nations will probably fall short of feeding their increased population and eliminating undernourishment in 2030, even if all harvested calories are used directly as food.
Estimating the distribution of phenotypes in populations and communities is central to many questions in ecology and evolutionary biology. These distributions can be characterized by their moments: the mean, variance, skewness, and kurtosis. Typically, these moments are calculated using a community-weighted approach (e.g. community-weighted mean) which ignores intraspecific variation. As an alternative, bootstrapping approaches can incorporate intraspecific variation to improve estimates, and also quantify uncertainty in the estimate. Here, we compare the performance of different approaches for estimating the moments of trait distributions across a variety of sampling scenarios, taxa, and datasets. We introduce the traitstrap R package to facilitate inferences of trait distributions via bootstrapping. Our results suggest that randomly sampling ~9 individuals per sampling unit and species, focusing on covering all species in the community, and analysing the data using nonparametric bootstrapping generally enables reliable inference on trait distributions, including the central moments, of communities.
Remote sensing of solar-induced chlorophyll fluorescence (SIF) shows promise for monitoring the productivity of global agricultural systems. SIF-based primary productivity metrics have demonstrated higher fidelity to large-scale patterns of crop productivity than reflectance-based vegetation indices when averaged across the growing season. In-season crop yield forecasting typically relies upon reflectance-based vegetation indices, raising the question of whether in-season monitoring could be improved by utilizing SIF. Here, we analyze patterns of US agricultural productivity from USDA surveys and their in-season relationships with coarse-resolution GOME-2 SIF, high-resolution downscaled SIF, SIF-based primary productivity metrics, MODIS NDVI, and MODIS GPP. We find that coarse-resolution SIF-based metrics and NDVI exhibit similar out-of-sample in-season (April–July and April–August) predictive ability, even when spatially filtering higher-resolution NDVI data to cropland areas. The downscaled SIF product performed more poorly than the coarse-resolution SIF, and MODIS GPP performed more poorly than MODIS NDVI. All forecasts are improved by incorporating county fixed effects to control for cross-sectional differences between counties. NDVI-based metrics allow for significantly better yield predictions during drought conditions than SIF-based metrics, suggesting limited added value of SIF for early warning of drought impacts. The benefits of SIF for crop monitoring should be continually evaluated as the frequency and quality of SIF measurements continue to improve.
Many studies have estimated the adverse effects of climate change on crop yields, however, this literature almost universally assumes a constant geographic distribution of crops in the future. Movement of growing areas to limit exposure to adverse climate conditions has been discussed as a theoretical adaptive response but has not previously been quantified or demonstrated at a global scale. Here, we assess how changes in rainfed crop area have already mediated growing season temperature trends for rainfed maize, wheat, rice, and soybean using spatially-explicit climate and crop area data from 1973 to 2012. Our results suggest that the most damaging impacts of warming on rainfed maize, wheat, and rice have been substantially moderated by the migration of these crops over time and the expansion of irrigation. However, continued migration may incur substantial environmental costs and will depend on socio-economic and political factors in addition to land suitability and climate.
Rangelands are one of the Earth's major ice-free land cover types. They provide food and support livelihoods for millions of people in addition to delivering important ecosystems services. However, rangelands are at threat from climate change, although the extent and magnitude of the potential impacts are poorly understood. Any declines in vegetation biomass and fluctuations in grazing availability would be of concern for food production and ecosystem integrity and functionality. In this study, we use a global rangeland model in combination with livestock and socio-economic datasets to identify where and to what extent rangeland systems may be at climatic risk. Overall, mean herbaceous biomass is projected to decrease across global rangelands between 2000 and 2050 under RCP 8.5 (-4.7%), while inter- (year-to-year) and intra- (month-to-month) annual variabilities are projected to increase (+21.3% and +8.2%, respectively). These averaged global estimates mask large spatial heterogeneities, with 74% of global rangeland area projected to experience a decline in mean biomass, 64% an increase in inter-annual variability and 54% an increase in intra-annual variability. Half of global rangeland areas are projected to experience simultaneously a decrease in mean biomass and an increase in inter-annual variability-vegetation trends both potentially harmful for livestock production. These regions include notably the Sahel, Australia, Mongolia, China, Uzbekistan and Turkmenistan and support 376 million people and 174 million ruminant Tropical Livestock Units. Additionally, the rangeland communities currently the most vulnerable (here, with the lowest livestock productivities and economic development levels and with the highest projected increases in human population densities) are projected to also experience the most damaging vegetation trends for livestock production. Although the capacity of rangeland systems to adapt is highly complex, analyses such as these generate some of the information required to inform options to facilitate pastoral system mitigation and adaptation strategies under climate change.
 Brian Enquist合作论文数Department of Ecology and Evolutionary Biology, College of Science, University of Arizona;The Santa Fe Institute;Oxford University;Rocky Mountain Biological Laboratory13
 Nathan Mueller合作论文数Department of Ecosystem Science and Sustainability, Colorado State University;Department of Soil and Crop Sciences, Colorado State University12
 Steven J. Davis合作论文数Sustainable Solutions Lab, School of Sustainability, Stanford University6
 Davide Consoli合作论文数5Leandro Parente合作论文数5
 Mario Herrero合作论文数Department of Global Development, Cornell University;Cornell Atkinson Center for Sustainability, Cornell University5
 James Gerber合作论文数Institute on the Environment, University of Minnesota;Global Landscapes Initiative, University of Minnesota5
 Tomislav Hengl合作论文数Envirometrix Ltd;OpenGeoHub Foundation5
 Henderson Amanda N合作论文数5
 Paul West合作论文数Department of Applied Economics, College of Food, Agricultural and Natural Resource Sciences, University of Minnesota5
 Laerte Guimaraes Ferreira合作论文数Institute of Social and Environmental Studies;Federal University of Goias;Campus Samambaia - Cx;Institute of Social and Environmental Studies, Federal University of Goias5
 Vinicius Vieira Mesquita合作论文数4
 Christine Lamanna合作论文数Sustainability Solutions Initiative and4Cyrille Violle合作论文数Univ Montpellier, Univ Paul Valery Montpellier4Murat Şahin合作论文数3
 Yue Qin (覃栎)合作论文数College of Environmental Sciences and Engineering, Peking University3
 Martijn Witjes合作论文数3
 Cecile Godde合作论文数Commonwealth Sci & Ind Res Org CSIRO3
 Benjamin Blonder合作论文数Department of Environmental Science, Policy and Management, College of Natural Resources, University of California, Berkeley3
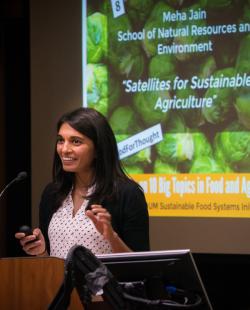 Meha Jain合作论文数School for Environment and Sustainability, University of Michigan-Ann Arbor3
 Irena Šímová合作论文数Center for Theoretical Study, Charles University;Department of Ecology, Faculty of Science, Charles University3
 Brian McGill合作论文数School of Biology and Ecology, The University of Maine3
 Samberg Leah合作论文数College of Forestry and Conservation, University of Montana3
 Yoshihide Wada合作论文数Climate and Livability Initiative, King Abdullah University of Science and Technology;Department of Physical Geography, Universiteit Utrecht;International Institute for Applied Systems Analysis3
 Fred Stolle合作论文数Jade Realty Inc3
 Ichsani Wheeler合作论文数Faculty of Agriculture, Food and Natural Resources, The University of Sydney3
 Deepak Ray合作论文数Institute on the Environment, University of Minnesota3
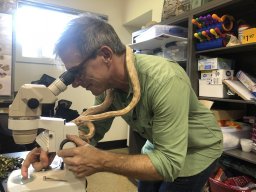 Andrew J Kerkhoff合作论文数Dept Biol, Kenyon Coll3
 Brad Boyle合作论文数3
 Stefan Siebert合作论文数Division of Agronom, Department of Crop Sciences, University of Göttingen3
 John Donoghue合作论文数2
 Carmelo Bonannella合作论文数2
 Ziga Malek合作论文数2E. Merz合作论文数2
 Naia Morueta Holme合作论文数Globe Institute, Faculty of Health and Medical Sciences, University of Copenhagen2Hyungjun Kim合作论文数Inst Ind Sci, Univ Tokyo2
 Jeffrey E. Ott合作论文数2
 Brian S Maitner合作论文数Univ Arizona, Dept Ecol & Evolutionary Biol, Tucson, AZ 85721 USA2
 Tanya Strydom合作论文数Département de Sciences Biologiques, Université de Montréal Montréal2Yusuke Satoh合作论文数Int Inst Appl Syst Anal, Laxenburg, Austria2
 Deepti Singh合作论文数School of the Environment, Washington State University2
 Yi Yao合作论文数2Sonali McDermid合作论文数Department of Environmental Studies, New York University2
 Luca Zappa合作论文数Department of Geodesy and Geoinformation, Technische Universitaet Wien2
 Mallika A. Nocco合作论文数Department of Land, Air and Water Resources, University of California, Davis2
 Steffen Ehrmann合作论文数German Ctr Integrat Biodivers Res iDiv2
 Jessica Keune合作论文数Hydroclimate Extremes Lab H CEL, Univ Ghent2
 Carsten Meyer合作论文数German Ctr Integrat Biodivers Res iDiv, Halle Jena Leipzig2
 Pouya Vahmani合作论文数Lawrence Berkeley Natl Lab, Berkeley, CA 94720 USA2




