In digital humanities (DH) and cultural heritage (CH), visualization-based storytelling (VBS) has become an important approach for structuring, interpreting, and communicating cultural data and research results. These domains differ markedly from other VBS application areas through their focus on historical phenomena; their reliance on heterogeneous and semantically ambiguous sources; their engagement with both fictional and factual constellations; their use of qualitative, interpretive, and critical perspectives; and their long-standing expertise in narrative practice and theory. As a result, DH and CH offer particularly rich opportunities for VBS, yet relevant work remains dispersed across humanities scholarship, DH and CH venues, visualization research, public application contexts, and tool-centered communities.Against this backdrop, we survey DH and CH work on story designs and VBS tools to identify trends and recurring patterns, promising practices, and open challenges. We contribute by (i) synthesizing storytelling design spaces into a framework tailored to VBS in DH and CH, (ii) mapping existing approaches to generate a field-level picture of practices and gaps, and (iii) highlighting future areas of concern and inquiry for VBS in relation to domain-specific epistemic questions. Overall, this survey seeks to consolidate an emerging community of practice and provide a shared reference point for future research.
The heritage of Nazi persecution (HNP) is at risk of fading from collective memory as survivors age and pass away. This paper reviews current visual storytelling (VS) techniques and focuses on refining, extending, and adapting existing design spaces for cultural heritage (CH) sites, particularly those related to HNP. Building on previous research, we expand design dimensions related to rich media elements and entity orientation in VS for CH. In particular, we orient the design space to fit HNP narratives and define the concept of visitor-driven, expert- and witness-driven storytelling, thus elaborating on valuable building blocks for VS in HNP. Our analysis includes 24 examples evaluated for accessibility, narrative clarity, and functionality. This work highlights trends, identifies gaps, and suggests opportunities in VS for HNP, ultimately providing a comprehensive framework to engage future digitally native generations with this significant and particularly delicate historical content concerning both victims and persecutors.
We introduce a visualization-based storytelling system designed to support the exploration and planning of long-distance hikes, exemplified through the Pacific Crest Trail. Designed to aid hikers and enthusiasts in understanding the trail’s dynamics, our tool integrates trail-segment-based narratives with interactive geospatial maps, elevation profiles, and icon-based trail facilities and wildlife information. The system adapts to user-defined travel speed and rest patterns, generating customized narrative segments enriched with multimedia and trail-specific data, including weather, water sources, wildlife, campsites, and resupply points. To assess the tool’s effectiveness and relevance, we conducted a preliminary evaluation with members of the hiking community, which highlighted the system’s usability and potential to enhance trail familiarization. The resulting feedback informed iterative design improvements of how data storytelling can enrich both the practical and experiential dimensions of trail presentations, fostering more informed, engaging hiking experiences.
The Arctic Ocean is experiencing rapid environmental change due to climate-induced warming, significantly altering underwater light conditions and the implications for benthic primary producers are uncertain. Through an iterative design process involving domain experts in Arctic marine science, we developed an interactive visualization tool that integrates large-scale remote sensing datasets to enable multi-scale exploration of temporal light dynamics. The tool features a geospatial map for regional and local analysis, a heatmap for visualizing monthly percentage changes across Arctic regions and fjords, and a line chart for examining and comparing temporal trends. Users can filter data based on minimum light requirements for four benthic primary producers and extract filtered subsets for further offline analysis. Qualitative evaluation with domain experts confirmed the tool’s effectiveness in supporting research tasks and revealed insights about changing patterns of light availability in the Arctic Ocean, which has significant implications for understanding how this sensitive ecosystem responds to rapid climate change.
This paper explores the potential of digital reconstruction and interactive storytelling to preserve historically suppressed sites. The main objective of an interdisciplinary team of data scientists from the MEMORISE project and associates of the memory association Asociación Recuerdo y Dignidad was to preserve the memory of the Francoist Santa Clara concentration camp in Soria, Spain, through the use of digital technology. Combining archival research, 3D modelling, 360 ^∘ photography, and web development, a prototype digital platform was created to visualise the transformation of the site across three historical phases: its origin as a convent, its use as a Francoist concentration camp, and its present-day condition. The platform allows users to navigate through spatial and temporal layers. Clickable media markers encourage exploration and interaction. Drawing on principles of participatory design, narrative visualisation, and open-ended user engagement, the project demonstrates how digital tools can support memory work, public engagement, and historical reflection. Our low-cost concept is especially adaptable to other physical sites that have been erased or forgotten.
Prisoners of Nazi concentration camps created paintings as a means to express their daily life experiences and feelings. Several thousand such paintings exist, but a quantitative analysis of them has not been carried out. We created an extensive dataset of 1,939 Holocaust prisoner artworks, and we employed an object detection framework that found 19,377 objects within these artworks. To support the quantitative and qualitative analysis of the art collection and its objects, we have developed an intuitive and interactive dashboard to promote a deeper engagement with these visual testimonies. The dashboard features various visual interfaces, e.g., a word cloud showing the detected objects and a map of artwork origins, and options for filtering. We presented the interface to domain experts, whose feedback highlights the dashboard's intuitiveness and potential for both quantitative and qualitative analysis while also providing relevant suggestions for improvement. Our project demonstrates the benefit of digital methods such as machine learning and visual analytics for Holocaust remembrance and educational purposes.
Musical instruments are indispensable to music traditions worldwide and often made from natural materials derived from species that are increasingly endangered. International trade threatens the survival of some of these species, as addressed by their inclusion in the UN Convention on International Trade in Endangered Species of Wild Fauna and Flora (CITES). However, CITES regulations can substantially impact music traditions and alone are insufficient to preserve trade-relevant species from extinction, such as the pau-brasil ( Paubrasilia echinata ), which is used for the bows of stringed instruments. Therefore, new CITES listings of species or species products used in the manufacture of musical instruments, or potential future shifts of CITES-listed species to the strictest category, will require anticipation, preparation, and precautionary actions. In international species trade negotiations, it is crucial to target the protection of species and music traditions beyond trade regulations. We propose novel social–ecological pathways to address these challenges and reconcile conflicting stakeholder interests between species conservation and cultural conservation.
Distant viewing approaches have typically used image datasets close to the contemporary image data used to train machine learning models. To work with images from other historical periods requires expert annotated data, and the quality of labels is crucial for the quality of results. Especially when working with cultural heritage collections that contain myriad uncertainties, annotating data, or re-annotating, legacy data is an arduous task. In this paper, we describe working with two pre-annotated sets of medieval manuscript images that exhibit conflicting and overlapping metadata. Since a manual reconciliation of the two legacy ontologies would be very expensive, we aim (1) to create a more uniform set of descriptive labels to serve as a "bridge" in the combined dataset, and (2) to establish a high-quality hierarchical classification that can be used as a valuable input for subsequent supervised machine learning. To achieve these goals, we developed visualization and interaction mechanisms, enabling medievalists to combine, regularize and extend the vocabulary used to describe these, and other cognate, image datasets. The visual interfaces provide experts an overview of relationships in the data going beyond the sum total of the metadata. Word and image embeddings as well as co-occurrences of labels across the datasets enable batch re-annotation of images, recommendation of label candidates, and support composing a hierarchical classification of labels.
Network visualization is one of the most widely used tools in digital humanities research. The idea of uncertain or "fuzzy" data is also a core notion in digital humanities research. Yet network visualizations in digital humanities do not always prominently represent uncertainty. In this article, we present a mathematical and logical model of uncertainty as a range of values which can be used in network visualizations. We review some of the principles for visualizing uncertainty of different kinds, visual variables that can be used for representing uncertainty, and how these variables have been used to represent different data types in visualizations drawn from a range of non-humanities fields like climate science and bioinformatics. We then provide examples of two diagrams: one in which the variables displaying degrees of uncertainty are integrated/pinto the graph and one in which glyphs are added to represent data certainty and uncertainty. Finally, we discuss how probabilistic data and what-if scenarios could be used to expand the representation of uncertainty in humanities network visualizations.
Phytoplankton and sea ice algae are traditionally considered to be the main primary producers in the Arctic Ocean. In this Perspective, we explore the importance of benthic primary producers (BPPs) encompassing microalgae, macroalgae, and seagrasses, which represent a poorly quantified source of Arctic marine primary production. Despite scarce observations, models predict that BPPs are widespread, colonizing ~3 million km 2 of the extensive Arctic coastal and shelf seas. Using a synthesis of published data and a novel model, we estimate that BPPs currently contribute ~77 Tg C y −1 of primary production to the Arctic, equivalent to ~20 to 35% of annual phytoplankton production. Macroalgae contribute ~43 Tg C y −1 , seagrasses contribute ~23 Tg C y −1 , and microalgae-dominated shelf habitats contribute ~11 to 16 Tg C y −1 . Since 2003, the Arctic seafloor area exposed to sunlight has increased by ~47,000 km 2 y −1 , expanding the realm of BPPs in a warming Arctic. Increased macrophyte abundance and productivity is expected along Arctic coastlines with continued ocean warming and sea ice loss. However, microalgal benthic primary production has increased in only a few shelf regions despite substantial sea ice loss over the past 20 y, as higher solar irradiance in the ice-free ocean is counterbalanced by reduced water transparency. This suggests complex impacts of climate change on Arctic light availability and marine primary production. Despite significant knowledge gaps on Arctic BPPs, their widespread presence and obvious contribution to coastal and shelf ecosystem production call for further investigation and for their inclusion in Arctic ecosystem models and carbon budgets.
This paper serves as an extension of our prior work titled 'A Survey of Geospatial-Temporal Visualizations for Military Operations', by delving deeper into the temporal aspects resulting in a broadening of our design space. In addition to this, we undertake an extended examination of an expanded range of military products that encompass diverse operational domains, including sub-sea, naval, ground, air, space, and cyber operations. The primary objective of this extended survey paper is to explore cutting-edge methods of integrating geospatial-temporal visualizations into military decision-support systems, thereby fostering potential advancements in the capabilities of these systems. Through a systematic approach, we identify, investigate, and discuss suitable visualization solutions and their potential benefits to military command and control systems through the lens of the Military Operations Process. This extended survey identifies gaps and opportunities for improvement of existing military products where identified geospatial-temporal visualizations can enhance military commanders' decision-making capabilities and consequently, their ability to act.
 Jakob Kusnick合作论文数University of Southern25
 Gerik Scheuermann合作论文数Institut für Informatik, Universitat Leipzig;Institute of Computer Science, Leipzig University23
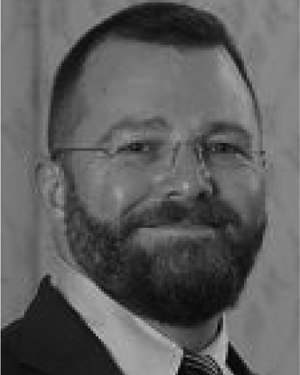 David Joseph Wrisley合作论文数New York University14
 Christofer Meinecke合作论文数Leipzig University12
 Richard Khulusi合作论文数Univ Leipzig, Inst Comp Sci, Image & Signal Proc Grp, Leipzig, Germany8
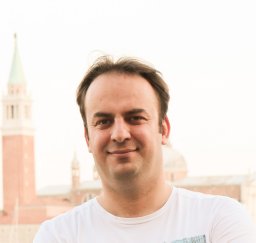 Tariq Yousef合作论文数Univ Leipzig, Inst Comp Sci, NLP Grp, Augustuspl 10, D-04109 Leipzig, Germany7
 Josef Focht合作论文数Univ Leipzig, Inst Musicol, Museum Mus Instruments, Leipzig, Germany6Martin Reckziegel合作论文数6
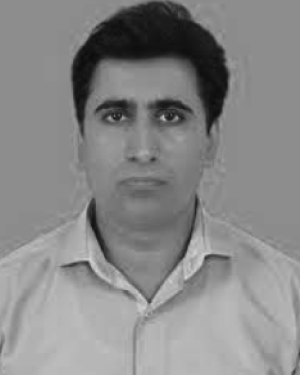 Muhammad Faisal Cheema合作论文数Leipzig University5
 Florian Windhager合作论文数Danube University Krems5Judith Blumenstein合作论文数4
 Liem, J.合作论文数4Marco Büchler合作论文数4Christian Heine合作论文数Institut für Informatik, University of Leipzig4
 Eva Mayr合作论文数Danube University Krems4
 Nicklas Sindlev Andersen (Nicklas Andersen)合作论文数Syddansk Universitet4
 Thomas Efer合作论文数3Chiara Palladino合作论文数Dept Class, Furman Univ3
 Gerhard Heyer合作论文数Univ Leipzig, Dept Comp Sci, Nat Language Proc, Leipzig, Germany3
 Mennatallah El-Assady合作论文数Department of Computer Science, ETH Zurich;Institut für Visual Computing, ETH Zürich;ETH AI Center3
 Christina Gillmann合作论文数3
 Dirk Zeckzer合作论文数TU Kaiserslautern3
 Nikolai Stoianov合作论文数INDECT Project Team, Technical University of Sofia3
 Silke Lichtenberg合作论文数2Estelle Guéville合作论文数2
 Adam James Bradley合作论文数2Samuel Beck合作论文数2
 Emily Beech合作论文数Botanic Gardens Conservation International2
 Katharine Coles合作论文数University of Utah2
 Eric C. Alexander合作论文数2
 Udo Michael Nehren合作论文数Institute for Technology and Resources Management in the Tropics and Subtropics, University of Applied Sciences Cologne2
 Christopher Collins合作论文数Visualization for Information Analysis Lab, Ontario Tech University;Meta2
 Min Chen合作论文数Oxford e-Research Centre, Department of Engineering Science, University of Oxford;Pembroke College, University of Oxford2
 Arthur Zimek合作论文数Department of Mathematics and Computer Science, University of Southern Denmark2
 Jan Byska合作论文数University of Bergen2Marco Chiarandini合作论文数Fachbereich Informatik;Technische Universitat Darmstadt;Fachbereich Informatik, Technische Universitat Darmstadt2
 Greta Franzini合作论文数2
 Malin C Rivers合作论文数Royal Botanic Gardens Kew2
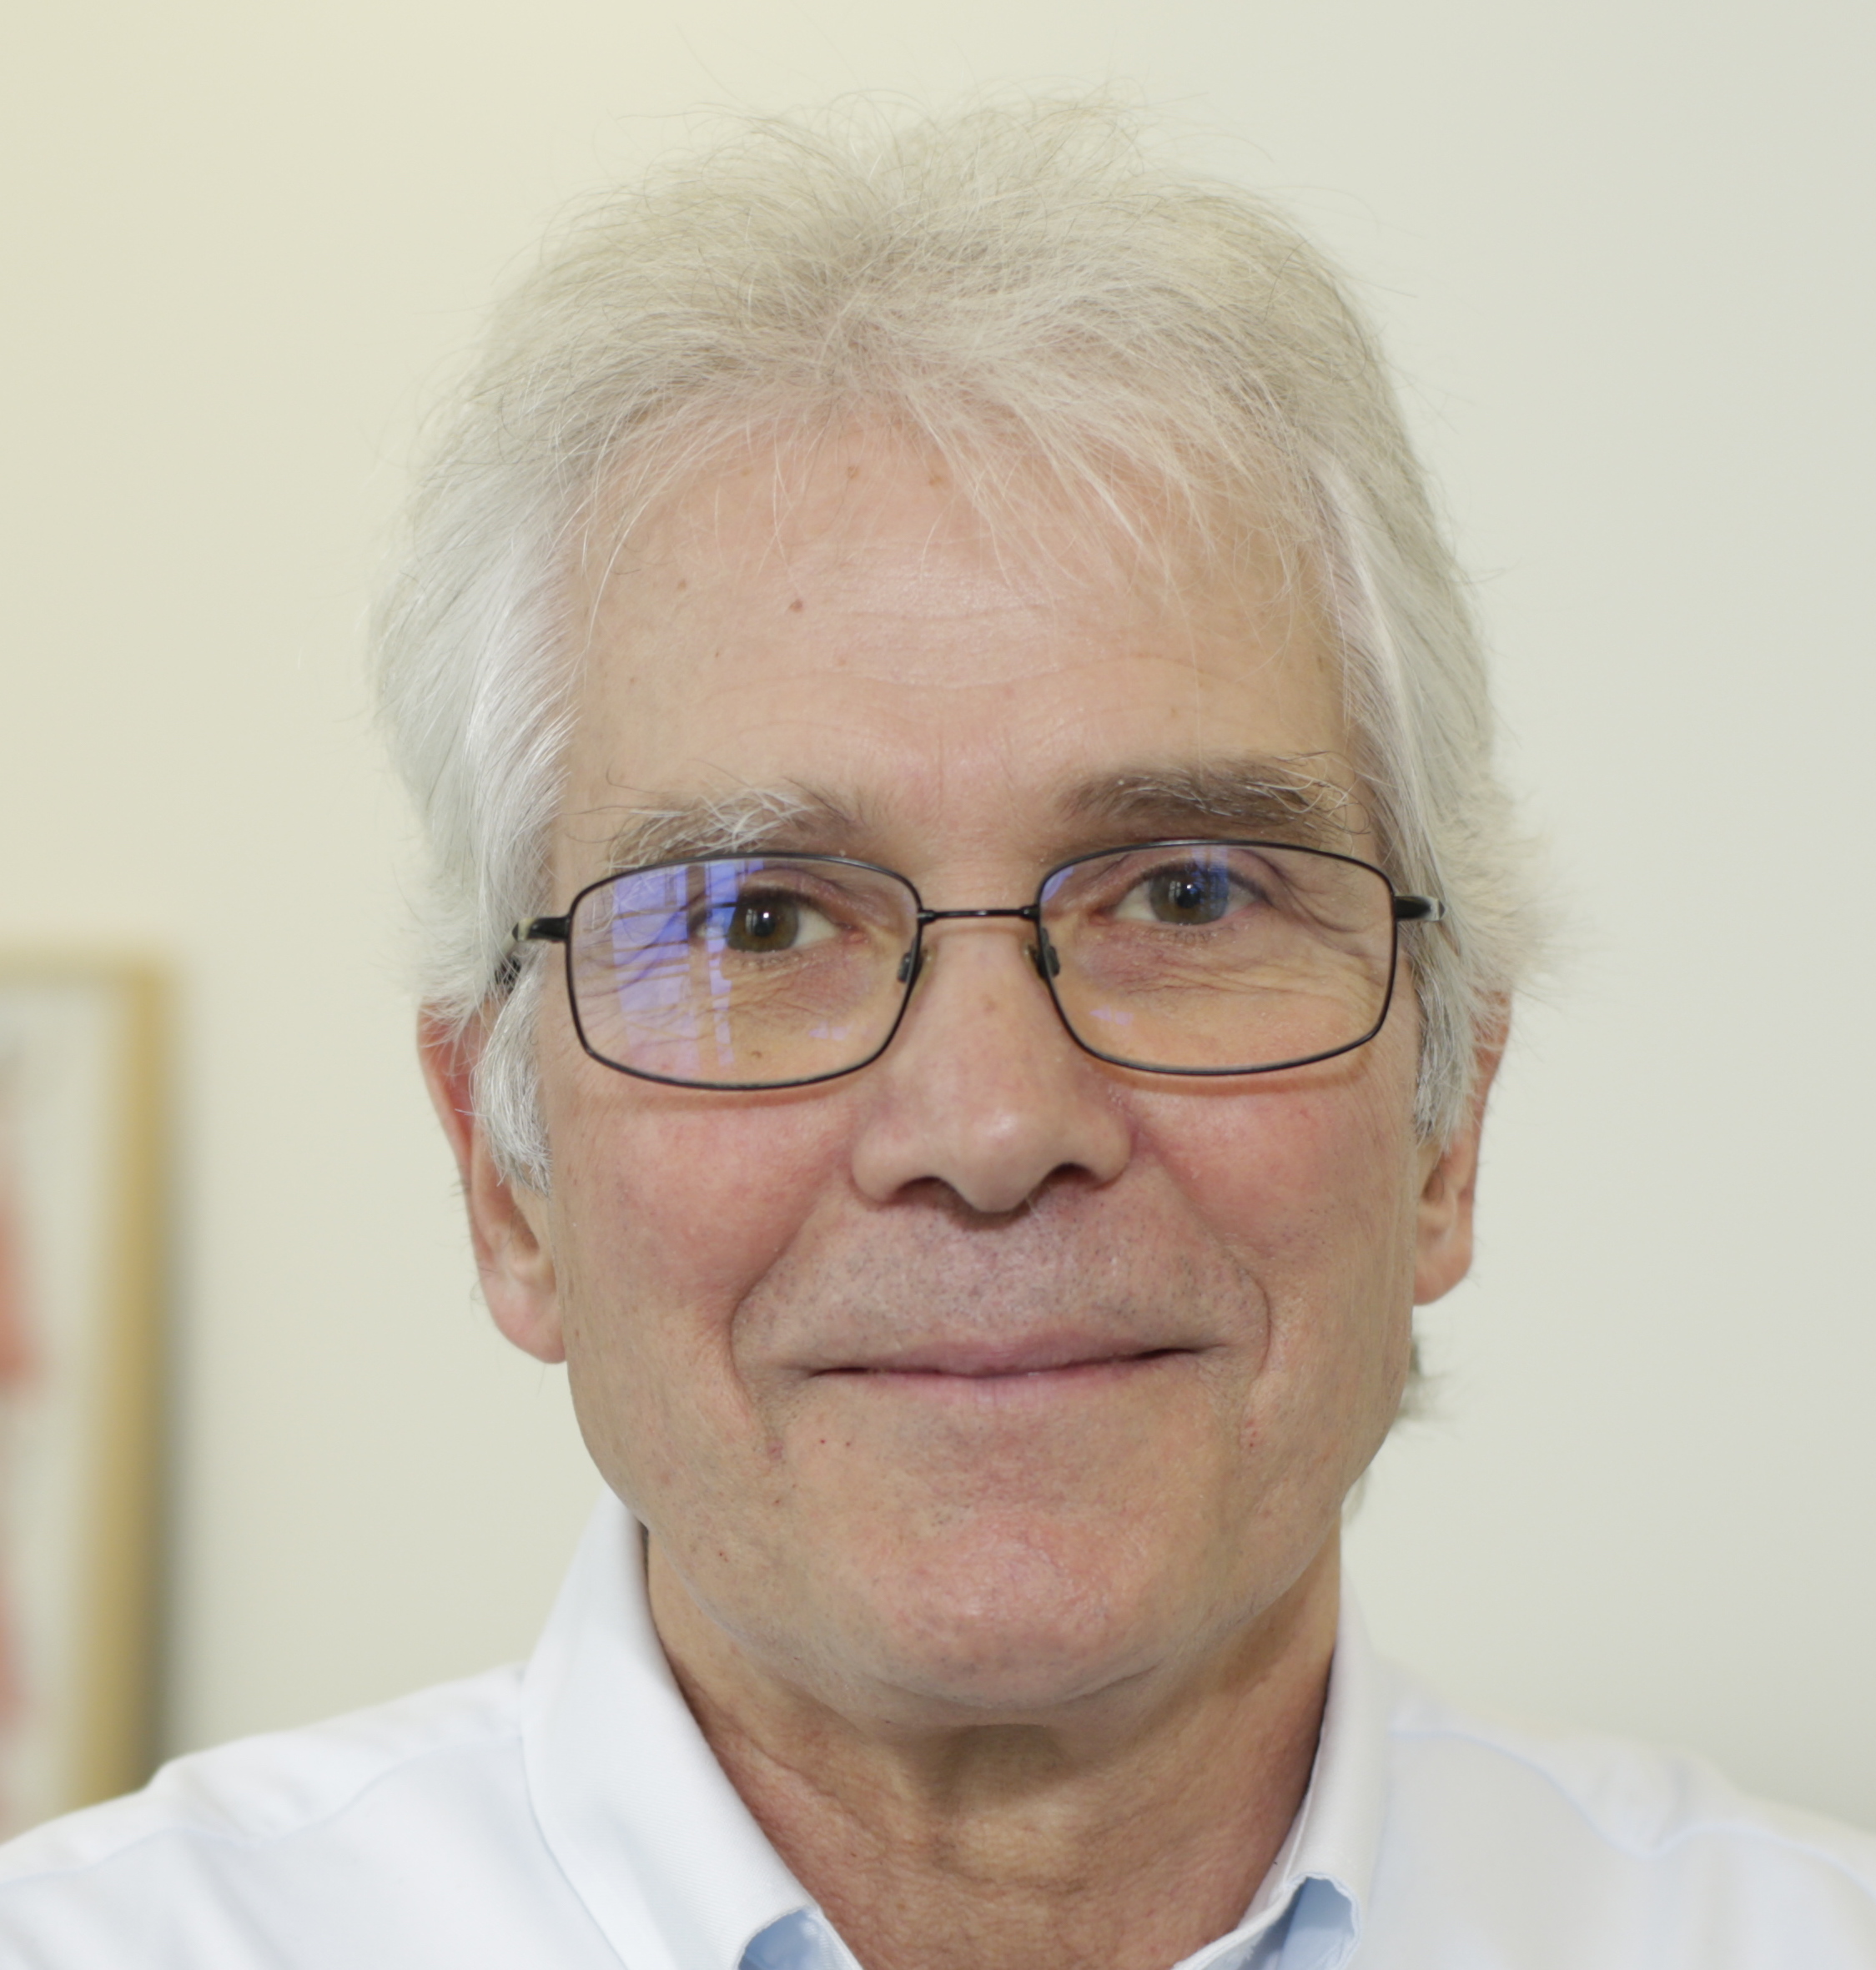 Jean-Pierre Gattuso (让·皮埃尔·加图索)合作论文数Laboratoire d’Océanographie de Villefranche, Sorbonne University;Institute for Sustainable Development and International Relations;Centre National de la Recherche Scientifique2
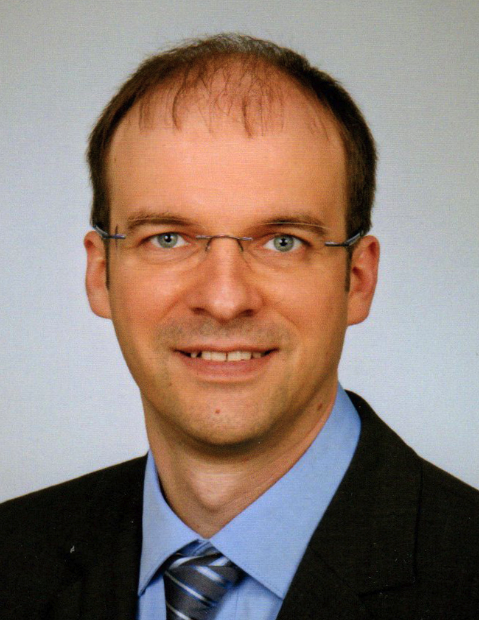 Steffen Koch合作论文数Institute for Visualization and Interactive Systems, University of Stuttgart2
 Karl Attard合作论文数Dunstaffnage Marine Laboratory, Scottish Association for Marine Science2
 Elisabeth Huber-Sannwald合作论文数Instituto Potosino de Investigación Científica y Tecnológica, A.C. (IPICYT),2
 Panagiotis Tampakis合作论文数Department of Mathematics and Computer Science, University of Southern Denmark2Eva Wöckener-Gade合作论文数1Jian Chen合作论文数1Malte Rehbein合作论文数1Christopher Andrews合作论文数1
 Ayan Biswas合作论文数University of Delaware1Takayuki Itoh合作论文数1




