Prescribed fires are widely used for land management in the United States, but their emissions remain difficult to quantify due to their small spatial extent and short duration. We present here the first demonstration that high-resolution "special observations" from the TEMPO geostationary instrument resolve sub-hourly nitrogen dioxide NO2 column enhancements from individual prescribed fires in the southeastern US. These observations are able to detect local plumes and track their evolution at minute-to-hourly timescales, enabling top-down and time-resolved emission estimates. Across four case studies in Alabama, Florida, and Georgia during 2025-2026, TEMPO quantifies emissions from individual prescribed fire events that could not previously be time-resolved by existing low-Earth-orbit satellite systems (e.g., TROPOMI, VIIRS). These results demonstrate that geostationary observations can quantify emissions from small, short-lived prescribed fires, thus improving the representation of these emissions in inventories used for fire management and downstream air quality applications.
Abstract. The Global Fire Emissions Database (GFED) is widely used to quantify spatiotemporal variability and long-term trends in burned area and fire emissions, supporting assessments of fire impacts on ecosystems and atmospheric composition. GFED has historically relied on observations from the Moderate Resolution Imaging Spectroradiometer (MODIS), but orbital drift and planned sensor decommissioning pose challenges for maintaining record continuity and near-real-time (NRT) monitoring. Here we present the GFED5 near-real-time extension (GFED5NRT), a global fire emissions dataset that enables daily NRT analyses using active fire observations from the Visible Infrared Imaging Radiometer Suite (VIIRS). GFED5NRT uses biome- and region-specific lookup tables of effective fire area and fuel consumption, derived from VIIRS observations and standard GFED5 datasets, to estimate burned area and emissions from VIIRS active fire counts in a manner consistent with the GFED5 time series. Comparisons with GFED5 and independent datasets show strong agreement in spatial patterns, seasonal cycles, and interannual variability of fire activity. GFED5NRT captures recent major fire extremes and provides daily global NRT estimates of burned area and emissions for multiple trace gases and aerosols. Together, GFED5 and GFED5NRT provides a coherent framework for long-term analyses and NRT monitoring of evolving fire regimes in a changing climate. The GFED5NRT dataset is publicly available at https://doi.org/10.5281/zenodo.18702700 (Chen et al., 2026).
Climate change is intensifying fire behavior, with the largest and fastest-spreading fires causing the greatest impacts on people and ecosystems. Yet the mechanisms driving variability and trends in large fires remain poorly understood. Using 12-hour satellite-derived fire tracking data from 2012 to 2023, we show that the merging of separate ignitions into multi-ignition complexes is a key process amplifying fire size and destructive potential across temperate and boreal ecoregions. Multi-ignition fires account for 31% of the burned area in California and 59% in the Arctic-boreal domain, spread faster and persist longer than single-ignition fires, and disproportionately contribute to extreme fire years in California, Canada, and Siberia. They also generate stronger atmospheric feedbacks, produce more pyrocumulonimbus events, and strain firefighting capacity by dispersing suppression resources. Recognizing and accounting for fire-merging dynamics are critical for improving wildfire prediction, risk assessment, and management.
Recent record-breaking fire activity in the western US poses clear threats to humans, ecosystems, and climate. Larger and faster fires increase the challenges for fire managers and further motivate the need for improved tracking of extreme fire behavior. There are also known limitations to our current ability to monitor fires from space. These include infrequent coverage from moderate resolution (<= 1 km) sensors, smoke and cloud obscuration, omission of small or low-intensity fires, and atmospheric attenuation of fire radiative power (FRP). These effects diminish our ability to quantify fire behavior and emissions, including persistent burning behind the flaming fire front, particularly in ecosystems with high fuel loads. In this study, we examined the Visible Infrared Imaging Radiometer Suite (VIIRS) imagery and data products to assess the utility of candidate fire pixels in addition to the low/nominal/high confidence 375-m fire detections already included in the active fire product. We found that these candidate pixels added 45% more daytime detections and 12% more nighttime detections for large fires in the western US 2020 fire season. Candidate fires were highly consistent with areas of flaming and smoldering fire activity identified by near-coincident airborne data as well as patterns of known active or candidate fires in sequential VIIRS overpasses, without significantly increasing false detections (commission errors). The candidate fire detections helped fill data gaps due to cloud obscuration during large fires that generated pyrocumulonimbus (pyroCb) clouds. Including this additional information also impacted estimates of fire activity, increasing fire persistence by 20% and FRP by 7% across our sample. Although the contribution from candidate fire detections to total FRP was relatively small, including these additional pixels could provide a more consistent estimate of fire emissions for smoke models and air quality forecasts by filling gaps in active fire information and improving the representation of smoldering fire activity. These results demonstrate the potential to augment the standard VIIRS product with candidate fire information for known large fire events to improve fire tracking and downstream products. Such approaches to leverage additional VIIRS information may be suitable for other biomass burning regions where global fire detection algorithms provide incomplete information for specific fire types and observing conditions.
Smoke fine particulate matter (PM2.5) from increasing wildfires in the western United States threatens public health. While land managers often prioritize reducing wildfire risk in the wildland-urban interface, the impact on regional air quality from mitigating wildfire spread is less explored. We develop a framework to quantify wildfire contributions to smoke exposure and assess targeted land management strategies. This data-driven approach integrates fire emissions and smoke transport to generate a smoke risk index at 0.25°×0.25° resolution. We deploy the smoke risk index in an online tool, enabling stakeholders to analyze smoke risk under various scenarios of burned area, fuel consumption, and land management. Using Northern California as a case study, we estimate that in 2020, targeted land management in the 15 highest-risk areas (~3.5% of the total) could have reduced smoke exposure by 17.6%. However, most prescribed burns conducted from 2017-2020 did not overlap with these high-risk zones. Our framework also estimates excess deaths from smoke PM2.5 exposure, attributing ~36,400 (95% CI: 25,400-47,200) deaths nationally due to western US fires in the year following the 2020 fire season. Our adaptable tool can incorporate higher-resolution datasets and help stakeholders prioritize fuel treatment and fire suppression to mitigate smoke exposure risks.
Smoke from the Los Angeles (LA) wildfires that started on January 7, 2025 caused severe air quality impacts across the region. Government agencies released guidance on assessing personal risk, pointing to publicly available data platforms that present information from monitoring networks and smoke plume outlines. Additional satellite-based products provide supporting information during dynamic wildfire smoke events. We evaluate the regional air quality impacts of the fires through publicly available fine particulate matter (PM2.5) and nitrogen dioxide (NO2) observations from regulatory monitoring stations, PurpleAir low-cost sensors, the TEMPO and TROPOMI satellite sensors, and Hazard Mapping System (HMS) Smoke Plumes during this multifire event. The most extreme air quality impacts were observed on January 8-9, particularly in the southern half of LA county, where daily average PM2.5 concentrations at the downtown LA regulatory monitor reached 101.7 mu g/m3 and 52.3 mu g/m3 in Compton. On January 8th, 12 PurpleAir sensors located closer to burn areas exceeded daily PM2.5 concentrations of 225 mu g/m3. While smoke impacts were largely consistent across all data sources, differences in the spatiotemporal, including vertical, resolution of each product may affect interpretability for end users. This study underscores the importance of integrating multiple air quality data sources and improving accessibility to enhance public health messaging during wildfire events.
Open biomass burning has major impacts globally and regionally on atmospheric composition. Fire emissions include particulate matter, tropospheric ozone precursors, and greenhouse gases, as well as persistent organic pollutants, mercury, and other metals. Fire frequency, intensity, duration, and location are changing as the climate warms, and modelling these fires and their impacts is becoming more and more critical to inform climate adaptation and mitigation, as well as land management. Indeed, the air pollution from fires can reverse the progress made by emission controls on industry and transportation. At the same time, nearly all aspects of fire modelling – such as emissions, plume injection height, long-range transport, and plume chemistry – are highly uncertain. This paper outlines a multi-model, multi-pollutant, multi-regional study to improve the understanding of the uncertainties and variability in fire atmospheric science, models, and fires' impacts, in addition to providing quantitative estimates of the air pollution and radiative impacts of biomass burning. Coordinated under the auspices of the Task Force on Hemispheric Transport of Air Pollution, the international atmospheric modelling and fire science communities are working towards the common goal of improving global fire modelling and using this multi-model experiment to provide estimates of fire pollution for impact studies. This paper outlines the research needs, opportunities, and options for the fire-focused multi-model experiments and provides guidance for these modelling experiments, outputs, and analyses that are to be pursued over the next 3 to 5 years. The paper proposes a plan for delivering specific products at key points over this period to meet important milestones relevant to science and policy audiences.
Timely information on wildfire burn severity is critical to assess and mitigate potential post-fire impacts on soils, vegetation, and hillslope stability. Tracking individual fire spread and intensity using satellite active fire data provides a pathway to near real-time (NRT) information. Here, we generated a large database (n = 2177) of wildfire events in the western United States (U.S.) between 2012 and 2021 using active fire detections from the Visible Infrared Imaging Radiometer Suite (VIIRS) sensor on the Suomi National Polar-orbiting Partnership (SNPP) satellite and the Fire Events Data Suite (FEDS) algorithm to track large fire growth every 12 h. We integrated fire tracking data with final fire perimeters and burn severity data from the Monitoring Trends in Burn Severity (MTBS) program to evaluate the relationship between burn severity and fire behavior metrics derived from the fire tracking approach, including the rate of fire spread and average fire radiative power (FRP) of fire detections for each 12-h growth increment. When stratified by vegetation type, FRP and rate of spread metrics were positively correlated with classified burn severity for each 12-h growth increment, highlighting the potential to rapidly identify areas of high and low severity burning. In forests, integrated measures of FRP over the fire lifetime captured persistent flaming and smoldering that compensated for initial differences between AM (01:30) and PM (13:30) fire detections. Predictive modeling of these relationships based on multiple fire behavior indicators and vegetation type from the LANDFIRE program yielded an accuracy of 78
Wildfires in the western US increasingly threaten infrastructure, air quality, and public health. Prescribed ("Rx") fire is often proposed to mitigate future wildfires, but treatments remain limited, and few studies quantify their effectiveness on recent major wildfires. We investigate the effects of Rx fire treatments on subsequent burn severity across western US ecoregions and particulate matter (PM2.5) emissions in California. Using high-resolution (30-m) satellite imagery, land management records, and fire emissions data, we employ a quasi-experimental design to compare Rx fire-treated areas with adjacent untreated areas to estimate the impacts of recent Rx fires (Fall 2018-Spring 2020) on the extreme 2020 wildfire season. We find that within 2020 wildfire burn areas where Rx fires were used prior to 2020, burn severity changed by -16% (p < 0.001) and smoke PM2.5 emissions changed by -101 kg per acre (p < 0.1). Rx fires in the wildland-urban interface ("WUI") were less effective in reducing burn severity and smoke PM2.5 emissions than those outside the WUI. Overall, Rx fires led to a net reduction of -14% in PM2.5 emissions, including those from the Rx fires themselves. The proposed policy of treating one million acres annually in California could reduce smoke emissions by 655,000 tons over the next 5 years, equivalent to 52% of the emissions from 2020 wildfires. Our analysis provides comprehensive estimates of the net benefits of Rx fire on subsequent burn severity and smoke PM2.5 emissions in the western US, an empirical basis for evaluating proposed Rx fire expansions, and valuable constraints for future modeling.
Wildfire activity has increased dramatically in the western United States over the last three decades, having a significant impact on air quality and human health. However, quantifying the drivers of trends in wildfires and subsequent smoke concentrations is challenging, as both natural variability (NV) and anthropogenic climate change (ACC) play important roles. Here, we devise an approach involving observed meteorology and vegetation and a range of models to determine the relative roles of ACC and NV in driving burned area across the western United States. We also examine the influence of ACC on smoke concentrations. We estimate that ACC accounts for 33 to 82% of observed total burned area, depending on the ecoregion, yielding 65% of total fire emissions on average across the western United States from 1992 to 2020. In all ecoregions except Mediterranean California, ACC contributes to a greater percentage of burned area in lightning-ignited wildfires than in human-ignited wildfires. On average, ACC contributes 49% to smoke PM2.5 concentrations in the western United States from 1997 to 2020, and explains 58% of the increasing trend in smoke PM2.5 from 2010 to 2020. Northern California and areas in Oregon, Washington, and Idaho experience the greatest smoke concentrations attributable to ACC, averaging 40 to 66% of total PM2.5 over 2010-2020. Our work highlights the significant role of ACC in degrading air quality in the western United States and identifies those regions most vulnerable to wildfire smoke and thus adverse health impacts.
BACKGROUND:Climate change has led to an increase in wildfires, a major source of air pollution, which may be particularly harmful to individuals diagnosed with cancer. The objective of this study was to examine the relationships of air pollution and wildfires with mortality risk among cancer survivors. METHODS:Surveillance, Epidemiology, and End Results (SEER) cancer registries provided information on 7,051,014 patients diagnosed with cancer from 2000 to 2021 in the United States. Cox regression was used to calculate adjusted hazard ratios (HRs) and 95 % confidence intervals (CIs) for the associations between exposures to particulate matter < 2.5 µm (PM2.5), nitrogen dioxide (NO2), ozone (O3), and wildfires (estimated using high-resolution geospatial datasets) with all-cause and cause-specific mortality risk. RESULTS:There were 3,452,593 deaths, including 2,369,364 from cancer, 525,409 from cardiopulmonary, and 557,820 from other causes. Among cancer survivors, higher exposure to PM2.5 and wildfires (but not NO2 or O3) were associated with increased risk for all-cause, cancer, and other mortality. The association between PM2.5 and cancer mortality was stronger in counties more heavily impacted by wildfires (HR per 10 μg/m3 in counties with ≥ median 0.39 wildfires per year: 1.17, 95 % CI 1.04-1.33) vs. no wildfires (HR 1.06, 95 % CI 0.97-1.15) (p interaction = 0.0064). CONCLUSIONS:Among patients diagnosed with cancer, PM2.5 air pollution, particularly in areas heavily impacted by wildfires, is associated with increased risk for mortality.
Background. NOAA's Hazard Mapping System (HMS) smoke product comprises smoke plumes digitised from satellite imagery. Recent studies have used HMS as a proxy for surface smoke presence. Aims We compare HMS with airport observations, air quality station measurements and model estimates of near-surface smoke. Methods. We quantify the agreement in numbers of smoke days and trends, regional discrepancies in levels of near-surface smoke fine particulate matter (PM2.5) within HMS polygons, and separation of total PM2.5 on smoke and non-smoke days across the contiguous US and Alaska from 2010 to 2021. Key results. We find large overestimates in HMS-derived smoke days and trends if we include light smoke plumes in the HMS smoke day definition. Outside the western US and Alaska, near-surface smoke PM2.5 within areas of HMS smoke plumes is low and almost indistinguishable across density categories, likely indicating frequent smoke aloft. Conclusions. Compared with airport, Environmental Protection Agency (EPA) and model-derived estimates, HMS most closely reflects surface smoke in the Pacific and Mountain regions and Alaska when smoke days are defined using only heavy plumes or both medium and heavy plumes. Implications We recommend careful consideration of biases in the HMS smoke product for air quality and public health assessments of fires.
In the western United States, prolonged drought, a warming climate, and historical fuel buildup have contributed to larger and more intense wildfires as well as to longer fire seasons. As these costly wildfires become more common, new tools and methods are essential for improving our understanding of the evolution of fires and how extreme weather conditions, including heat waves, windstorms, droughts, and varying levels of active-fire suppression, influence fire spread. Here, we develop the Geostationary Operational Environmental Satellites (GOES)-Observed Fire Event Representation (GOFER) algorithm to derive the hourly fire progression of large wildfires and create a product of hourly fire perimeters, active-fire lines, and fire spread rates. Using GOES-East and GOES-West geostationary satellite detections of active fires, we test the GOFER algorithm on 28 large wildfires in California from 2019 to 2021. The GOFER algorithm includes parameter optimizations for defining the burned-to-unburned boundary and correcting for the parallax effect from elevated terrain. We evaluate GOFER perimeters using 12 h data from the Visible Infrared Imaging Radiometer Suite (VIIRS)-derived Fire Event Data Suite (FEDS) and final fire perimeters from the California's Fire and Resource Assessment Program (FRAP). Although the GOES imagery used to derive GOFER has a coarser resolution (2 km at the Equator), the final fire perimeters from GOFER correspond reasonably well to those obtained from FRAP, with a mean Intersection-over-Union (IoU) of 0.77, in comparison to 0.83 between FEDS and FRAP; the IoU indicates the area of overlap over the area of the union relative to the reference perimeters, in which 0 is no agreement and 1 is perfect agreement. GOFER fills a key temporal gap present in other fire tracking products that rely on low-Earth-orbit imagery, where perimeters are available at intervals of 12 h or longer or at ad hoc intervals from aircraft overflights. This is particularly relevant when a fire spreads rapidly, such as at maximum hourly spread rates of over 5 km h−1. Our GOFER algorithm for deriving the hourly fire progression using GOES can be applied to large wildfires across North and South America and reveals considerable variability in the rates of fire spread on diurnal timescales. The resulting GOFER product has a broad set of potential applications, including the development of predictive models for fire spread and the improvement of atmospheric transport models for surface smoke estimates. The resulting GOFER product has a broad set of potential applications, including the development of predictive models for fire spread and the improvement of atmospheric transport models for surface smoke estimates (https://doi.org/10.5281/zenodo.8327264, Liu et al., 2023).
Wildfires can have a significant impact on air quality in Australia during severe burning seasons, but incomplete knowledge of the injection heights of smoke plumes poses a challenge for quantifying smoke exposure. In this study, we use two approaches to quantify the fractions of fire emissions injected above the planetary boundary layer (PBL), and we further investigate the impact of plume injection fractions on daily mean surface concentrations of fine particulate matter (PM2.5) from wildfire smoke in key cities over northern and southeastern Australia from 2009 to 2020. For the first method, we rely on climatological, monthly mean vertical profiles of smoke emissions from the Integrated Monitoring and Modelling System for wildland fires (IS4FIRES) together with assimilated PBL heights from NASA Modern-Era Retrospective Analysis for Research and Application (MERRA) version 2. For the second method, we develop a novel approach based on the Multi-angle Imaging SpectroRadiometer (MISR) observations and a random forest, machine learning model that allows us to directly predict the daily plume injection fractions above the PBL in each grid cell. We apply the resulting plume injection fractions quantified by the two methods to smoke PM2.5 concentrations simulated by the Stochastic Time-Inverted Lagrangian Transport (STILT) model in target cities. We find that characterization of the plume injection heights greatly affects estimates of surface daily smoke PM2.5, especially during severe wildfire seasons, when intense heat from fires can loft smoke high in the troposphere. However, using climatological injection profiles cannot capture well the spatiotemporal variability in plume injection fractions, resulting in a 63 % underestimation of daily fire emission fluxes injected above the PBL in comparison with those fluxes derived from MISR injection fractions. Our random forest model successfully reproduces the daily injected fire emission fluxes against MISR observations (R2=0.88, normalized mean bias = 10 %) and predicts that 27 % and 45 % of total fire emissions rise above the PBL in northern and southeastern Australia, respectively, from 2009 to 2020. Using the plume behavior predicted by the random forest method also leads to better model agreement with observed surface PM2.5 in several key cities near the wildfire source regions, with smoke PM2.5 accounting for 5 %–52 % of total PM2.5 during fire seasons from 2009 to 2020.
Indonesia faces significant air quality issues due to multiple emissions sources, including rapid urbanization and peatland fires associated with agricultural land management. Limited prior research has estimated the episodic shock of intense fires on morbidity and mortality in Indonesia but has largely ignored the impact of poor air quality throughout the year on biomarkers of cardiovascular disease risk. We conducted a cross-sectional study of the association between particulate matter less than 2.5 microns in diameter (PM2.5) and blood pressure. Blood pressure measurements were obtained from the fifth wave of the Indonesian Family Life Survey (IFLS5), an ongoing population-based socioeconomic and health survey. We used the GEOS-Chem chemical transport model to simulate daily PM2.5 concentrations at 0.5° × 0.625° resolution across the IFLS domain. We assessed the association between PM2.5 and diastolic and systolic blood pressure, using mixed effects models with random intercepts for regency/municipality and household and adjusted for individual covariates. An interquartile range increase in monthly PM2.5 exposure was associated with a 0.234 (95% CI: 0.003, 0.464) higher diastolic blood pressure, with a greater association seen in participants age 65 and over (1.16 [95% CI: 0.24, 2.08]). For the same exposure metric, there was a 1.90 (95% CI: 0.43, 3.37) higher systolic blood pressure in participants 65 and older. Our assessment of fire-specific PM2.5 yielded null results, potentially due to the timing and locations of health data collection. To our knowledge, this is the first study to provide evidence for an association between PM2.5 and blood pressure in Indonesia.
Prescribed fire is increasingly proposed as a policy strategy to reduce wildfire risks, but evidence of its effectiveness in lowering fire severity and smoke emissions remains limited in the western US. We empirically demonstrate that areas treated with prescribed fire and subsequently burned during California’s extreme 2020 wildfire season showed a -14% net reduction in smoke emissions, though these treatments were less effective near populated areas. Our findings suggest that expanding prescribed fire use can meaningfully reduce smoke emissions, even when factoring in smoke from the prescribed fires themselves. The proposed policy of treating one million acres annually in California could reduce overall smoke emissions by 655,000 metric tons over the next five years—equivalent to 52% of the emissions from 2020 wildfires. Our results also suggest that broader application of prescribed fires can provide benefits in mitigating severe wildfire impacts and improve air quality in fire-prone regions worldwide.
Wildfire activity has increased dramatically in the western United States (US) over the last three decades, having a significant impact on air quality and human health. However, quantifying the drivers of trends in wildfires and subsequent smoke exposure is challenging, as both natural variability and anthropogenic climate change play important roles. Here we devise an approach involving observed meteorology and vegetation and a range of models to determine the relative roles of anthropogenic climate change and natural variability in driving burned area across the western US. We also examine the influence of anthropogenic climate change on smoke exposure. We estimate that anthropogenic climate change accounts for 33-82 depending on the ecoregion, yielding 65 across the western US from 1992 to 2020. In all ecoregions except Mediterranean California, anthropogenic climate change contributes to a greater percentage of burned area in lightning-caused wildfires than in human-caused wildfires. On average, anthropogenic climate change contributes 49 concentrations in the western US from 1997 to 2020, and explains 58 increasing trend in smoke PM2.5 from 2010 to 2020. We further find that populations in northern California, western Oregon, Washington, and parts of Idaho have experienced the greatest smoke exposure attributable to anthropogenic climate change in recent years. Our work highlights the significant role of anthropogenic climate change in degrading air quality in the western US and identifies those regions most vulnerable to wildfire smoke and thus adverse health impacts.
Background: NOAA’s Hazard Mapping System (HMS) smoke product comprises smoke plumes digitized from satellite imagery. Recent studies have used HMS as a proxy for surface smoke presence. Aims: We compare HMS to airport observations, air quality station measurements, and model estimates of near-surface smoke. Methods: We quantify the agreement in smoke days and trends, regional discrepancies in levels of near-surface smoke fine particulate matter (PM2.5) within HMS polygons, and separation of total PM2.5 on smoke and non-smoke days across the contiguous U.S. and Alaska from 2010-2021. Key Results: We find large overestimates in HMS-derived smoke days and trends if we include light smoke plumes in the HMS smoke day definition. Outside of the western U.S. and Alaska, near-surface smoke PM2.5 within areas of HMS smoke plumes are low and almost indistinguishable across density categories, likely indicating frequent smoke aloft. Conclusions: Compared to airport, EPA, and model-derived estimates, HMS most closely reflects surface smoke in the Pacific and Mountain regions and Alaska when smoke days are defined using only heavy plumes or both medium and heavy plumes. Implications: We recommend careful consideration of biases in the HMS smoke product for air quality and public health assessments of fires.
 Jinbo Yang (杨锦波)合作论文数West China Hospital of Stomatology, Sichuan University30
 Loretta J. Mickley合作论文数John A. Paulson School of Engineering and Applied Sciences, Harvard University;Atmospheric Chemistry Modeling Group, Harvard University28
 Miriam Marlier合作论文数Department of Environmental Health Sciences, Fielding School of Public Health, University of California, Los Angeles20
 Xuedong Zhou (周学东)合作论文数West China School of Stomatology, Sichuan University20
 Ruth DeFries合作论文数Department of Ecology, Evolution, and Environmental Biology, Climate School, Columbia University;Earth Institute, Columbia University19
 Yafei Wu (吴亚菲)合作论文数West China School of Stomatology, Sichuan University16
 Jianguo Liu (刘建国)合作论文数Zunyi Medical University16
 Heng Zhuang合作论文数15Song Li (李颂)合作论文数13Yue Xiao (肖悦)合作论文数13
 Zhengwei Huang (黄正蔚)合作论文数Shanghai Ninth People's Hospital, School of Medicine, Shanghai Jiao Tong University12
 Jiyao Li (李继遥)合作论文数West China Hospital of Stomatology, Sichuan University12FuXian Cao (曹福娴)合作论文数11
 Ritesh Gautam合作论文数Center for Earth Observing and Space Research;George Mason University;Center for Earth Observing and Space Research, George Mason University10Makoto M. Kelp合作论文数9
 Yu Lu (陆玉)合作论文数Beijing Stomatological Hospital & School of Stomatology, Capital Medical University9Lei Zhao (赵蕾)合作论文数9
 Deqin Yang (杨德琴)合作论文数College of Stomatology, Chongqing Medical University9
 Song Ge (葛颂)合作论文数Department of Oral Medicine, Affiliated Stomatology Hospital, School of Stomatology, Zunyi Medical University9Da Liu合作论文数8Shu Meng (孟姝)合作论文数8
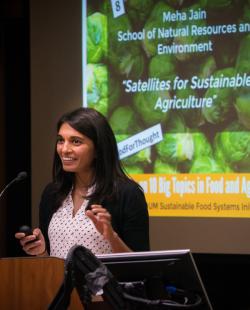 Meha Jain合作论文数School for Environment and Sustainability, University of Michigan-Ann Arbor8
 Sukhwinder Singh合作论文数Ctr Chron Dis Control6Ling Zhan (詹玲)合作论文数6
 Douglas C. Morton合作论文数Biospheric Sciences Laboratory, Goddard Space Flight Center, National Aeronautics and Space Administration6
 Alexandra Karambelas合作论文数6Genli Pi (皮根莉)合作论文数6Yang Chen合作论文数6
 Subha S Raj合作论文数5Zhidong Qiu合作论文数5
 Upasana Panda合作论文数5Snehitha M. Kommula合作论文数5
 Ernesto Reyes-Villegas合作论文数School of Natural Sciences, University of Manchester5XiaoRong Xiao (肖晓蓉)合作论文数5
 Singh Manoj K合作论文数Centre for Mechanical Technology and Automation (TEMA-UA),, University of Aveiro5
 Xiaojing Huang (黄晓晶)合作论文数Fujian Medical University5
 James T Randerson合作论文数Department of Earth System Science, School of Physical Sciences, University of California, Irvine5
 Ulrich Pöschl合作论文数Multiphase Chemistry Department, Max Planck Institute for Chemistry;Department of Chemistry, Pharmacy and Geosciences, Johannes Gutenberg University4Miah Caine合作论文数4
 Mira L. Pöhlker合作论文数Experimental Aerosol and Cloud Microphysics Department, Leibniz Institute for Tropospheric Research4
 Rebecca Scholten合作论文数Trier Univ, Environm Remote Sensing & Geoinformat, D-54286 Trier, Germany4
 Morgan A. Crowley合作论文数Department of Natural Resource Sciences, McGill University4Zhao-hui LIU (刘昭慧)合作论文数4KuiFang He (何奎芳)合作论文数4TieZhu Zhang (张铁柱)合作论文数4
 James Allan合作论文数Centre for Atmospheric Science, School of Earth, Atmospheric and Environmental Sciences, The University of Manchester;Department of Earth and Environmental Sciences, School of Natural Sciences, Faculty of Science and Engineering, The University of Manchester;National Centre for Atmospheric Science4
 Scot T. Martin合作论文数Department of Earth and Planetary Sciences, Harvard University;Harvard John A. Paulson School of Engineering and Applied Sciences4
 Jessica L. McCarty合作论文数4




