Continuous ground-based microwave (MW) measurements with the RPG-HATPRO radiometer at the observational site of St. Petersburg State University located near the coastline of the Gulf of Finland have provided a large amount of data on the cloud liquid water path (LWP) of non-raining clouds. The 12-year (2013–2024) time series of the LWP values has been analysed and the diurnal evolution of the LWP has been assessed for each month of the year. The calculations have been made for the LWP in the range 0–0.4 kg m−2 using different sampling subsets that include the so-called true and virtual LWP values. True LWP values correspond to measurements with clouds in the field of view of the radiometer, whereas virtual LWP values correspond to measurements with clouds or with clear sky in the field of view of the instrument and, therefore, virtual values can be zero (in clear sky cases). Based on the correlation analysis, time periods characterised by similar meteorological conditions and suitable for assessing the daily dynamics of LWP were identified. The LWP diurnal cycles in December, January, and February demonstrated a similar pattern with a maximum around local astronomical noon and with a minimum around midnight. For the remaining months except March and June, the maximum LWP is observed in the early morning and the minimum is observed in the afternoon. This cycle is characteristic of marine stratocumulus clouds. The diurnal cycles of the LWP in March and June, peaking in the afternoon and morning, respectively, are typical of convective continental clouds. Thus, the LWP diurnal cycle in the coastal zone of the Gulf of Finland may have characteristics of both marine and continental clouds. Parameters of the two-mode sinusoidal approximation of the diurnal cycle of the LWP in different seasons are presented.
The atmospheric air quality is one of the crucial factors determining people's health, duration and quality of life. The importance of ammonia (NH3) and ethylene (C2H4) is due to the fact that they are precursors of secondary organic aerosols (SOA) and phytotoxicants, which significantly affect air quality, cause human diseases and damage plants. The Fourier Transform Infrared (FTIR) spectrometry is a powerful tool for long-term monitoring of the atmospheric gas composition, including toxic gases. The paper presents the results of atmospheric FTIR measurements of NH3 and C2H4 at the St. Petersburg State University observational site (59.88 degrees N, 29.83 degrees E, 20 m above sea level) located in a suburb of greater Saint Petersburg. This work demonstrates the applicability of the ground-based atmospheric FTIR spectroscopy to long-term monitoring of air pollution in urbanized areas and in particular to provide information on the NH3 and C2H4 abundance in the atmosphere, including the analysis of their annual cycle, long-term trends, and positive anomalies. It was shown that for NH3 and C2H4, a statistically significant decrease in column-averaged dry-air mole fraction values (XNH3 and XC2H4) was observed, amounting to (-2.3 +/- 0.2)%/year for the 2009-2025 period and with the rate (-2.2 +/- 0.4)%/year for the 2016-2025 period, respectively. Periodically recorded XNH3 anomalies indicate the presence of intensive emission sources in the region, subjecting ecosystems in adjacent areas to constant exposure to NH3 concentrations exceeding the critical level. Anomalously high values of XNH3 and XC2H4 were recorded simultaneously only once-on 17 October 2017. Using data on HCN total column (as a forest fire indicator) and the results of atmospheric dispersion modeling, it was shown that this pollution event was caused by the influence of biomass burning products emitted from wildfires located approximately 250 km to the north-west from the observational site in the Helsinki area (Finland).
Quantifying long-term variations in the cloud liquid water path (LWP) is crucial to obtain a better understanding of the processes relevant to cloud–climate feedback. The 12-year (2013–2024) time series of LWP values obtained from ground-based measurements by the RPG-HATPRO radiometer near the Gulf of Finland is analysed, and the linear trends of the LWP for different sampling subsets of data are assessed. These subsets include all-hour, daytime, and night-time measurements. Two different approaches have been used for trend assessment, which produced similar results. Statistically significant linear trends have been detected for most data subsets. The most pronounced general trend over the period 2013–2024 has been detected for the daytime LWP, and it constitutes −0.0011 ± 0.00015 kg m−2 yr−1. This trend is driven mainly by the daytime LWP trend for the warm season (May–July, −0.0014 ± 0.00015 kg m−2 yr−1), which is considerably larger than the trend for the cold season (November–January, −0.00064 ± 0.00026 kg m−2 yr−1). Additionally, the analysis shows that the absolute number of clear-sky measurements decreased approximately by a factor of 4 if the years 2013 and 2024 are compared.
Global climate change is one of the most important scientific, social, and economic problems of our time. To estimate the significance of these changes and understand the physical and chemical processes associated with them, it is necessary to monitor the atmospheric content of climatically important gases and their fluxes into the atmosphere. This paper summarizes the results of more than thirty years (1991–2023) of spectroscopic study of the atmospheric composition at St. Petersburg State University (SPbU). The main attention is paid to stationary and mobile FTIR (Fourier Transform InfraRed) measurements carried out at SPbU over the past 15 years and aimed at both studying temporal changes in the gaseous composition of the atmosphere and estimating emissions of climatically important gases from the territory of the St. Petersburg agglomeration. The paper presents new estimates of trends in CH4, CO2, OCS, CO, HCN, C2H6, H2CO, CH3OH, HCOOH, and C2H2 over 2009–2023, as well as experimental estimates of CH4 and CO2 area fluxes from the territory of St. Petersburg derived from measurements during EMME (Emission Monitoring Mobile Experiment) observational campaigns.
Saint Petersburg is the second most populous city in the Russian Federation and the fourth in Europe. According to official statistics, ∼5.6 million people permanently live in the city. In order to experimentally estimate greenhouse gas emissions from the territory of the St. Petersburg agglomeration, an original combined approach was developed and implemented during EMME-2019 and ЕММЕ-2020 observational campaigns. The paper summarizes the results of mobile experiments in 2019 and 2020. The period March – early May chosen for the EMME campaigns is shown to be optimal for estimating CO2 emissions. The average anthropogenic additives caused by emissions from the territory of St. Petersburg were assessed at ∼1.07 ppmv for CO2 and ∼6.61 ppbv for CH4. Experimental estimates of specific greenhouse gas fluxes for the territory of the St. Petersburg agglomeration amounted to 72 kt km−2 year−1 CO2 and 198 t km−2 year−1 CH4 for six days of the campaign in 2020; 80 kt km−2 year−1 CO2 and 161 t km−2 year−1 CH4 for 15 days of the campaigns in 2019 and 2020. The CH4/CO2 and CO/CO2 emission ratios for St. Petersburg in March–early May 2020 averaged 6.4 and 5.7 ppbv/ppmv, respectively. Lockdown restrictions due to COVID-19 pandemic affected the structure of emission from the territory of St. Petersburg, namely, a sharp decrease in transport activity significantly decreased CO emissions from motor vehicles.
The information on the cloud liquid water path (LWP) is required for many applications including global and regional climate modelling, weather forecasting, and hydrological cycle modelling. The results of derivation of the land–sea LWP contrast from LWP measurements with the satellite SEVIRI (Spinning Enhanced Visible Infra-Red Imager) instrument over land and water bodies in northern Europe are presented. The study of the diurnal cycle of the LWP contrast for some water bodies discovered two maxima nearly symmetrical about the noon UTC. They were observed in most cases at measurement points in the Gulf of Riga and in the Gulf of Finland in the Baltic Sea. Presumably, those maxima were artefacts of observations caused by the so-called “cloud bow effect.” Calculations of a scattering angle for the satellite measurements at these points confirm this conclusion. The problems of data filtering and analyzing in the cases of manifestation of this disturbing effect are discussed. An approach to data analysis is suggested. This approach and the results can be used to assess the quality of LWP measurements by SEVIRI in various regions of the globe.
Key long-lived greenhouse gases (CO2, CH4, and N2O) are perhaps among the best-studied components of the Earth’s atmosphere today; however, attempts to predict or explain trends or even shorter-term variations of these trace gases are not always successful. Infrared spectroscopy is a recognized technique for the ground-based long-term monitoring of the gaseous composition of the atmosphere. The current paper is focused on the analysis of new data on CO2, CH4, and N2O total columns (TCs) retrieved from high resolution IR solar spectra acquired during 2009–2022 at the NDACC atmospheric monitoring station of St. Petersburg State University (STP station, 59.88°N, 29.83°E, 20 m asl.). The paper provides information on the FTIR system (Fourier-transform infrared) installed at the STP station, and an overview of techniques used for the CO2, CH4, and N2O retrievals. Trends of key greenhouse gases and their confidence levels were evaluated using an original approach which combines the Lomb–Scargle method with the cross-validation and bootstrapping techniques. As a result, the following fourteen-year (2009–2022) trends of TCs have been revealed: (0.56 ± 0.01) % yr−1 for CO2; (0.46 ± 0.02) % yr−1 for CH4; (0.28 ± 0.01) % yr−1 for N2O. A comparison with trends based on the EMAC numerical modeling data was carried out. The trends of greenhouse gases observed at the STP site are consistent with the results of the in situ monitoring performed at the same geographical location, and with the independent estimates of the global volume mixing ratio growth rates obtained by the GAW network and the NOAA Global Monitoring Laboratory. There is reasonable agreement between the CH4 and N2O TC trends for 2009–2019, which have been derived from FTIR measurements at three locations: the STP site, Izaña Observatory and the University of Toronto Atmospheric Observatory.
Results of a series of spectroscopic measurements of the tropospheric NO2 content carried out on a closed route of the Ring Road of St. Petersburg in different seasons in 2012, 2014, 2015, and 2016 are considered. A unified approach to the interpretation of all experimental data using numerical modeling of air pollution spread and a priori information about the spatial distribution of its anthropogenic sources has significantly improved the accuracy of determining the integral NOx emissions. The total NOx volume, reduced to gross annual anthropogenic emissions from the territory of St. Petersburg, amounted to 81 000 ± 17 000 t. This value slightly exceeds the air pollution city inventory official data (from 61 000 to 63 000 t per year), consistent within the error margin with the estimate obtained earlier on the basis of similar mobile measurements in the spring of 2019 (75 000 ± 26 000 t per year).
Санкт-Петербург - второй по численности населения город Российской Федерации и четвертый в Европе. Согласно официальной статистике в городе постоянно проживают ~ 5,6 млн человек. С целью получения экспериментальных оценок выбросов парниковых газов с территории Санкт-Петербургской агломерации был разработан оригинальный комплексный подход, реализованный в рамках измерительных кампаний EMME (Emission Monitoring Mobile Experiment) 2019 и 2020 гг. Проведено обобщение результатов мобильных экспериментов 2019 и 2020 гг. Показано, что период «март - начало мая», выбранный для проведения кампаний ЕММЕ, является оптимальным для оценок выбросов СО2. Средние значения антропогенных добавок, обусловленных выбросами с территории Санкт-Петербурга, для средних концентраций CO2 и CH4 в толще атмосферы составили ~ 1,07 ppmv и ~ 6,61 ppbv соответственно. Экспериментальные оценки удельных потоков парниковых газов на территории Санкт-Петербургской агломерации - 72 кт × км-2 × год-1 СО2 и 198 т × км-2 × год-1 СН4 по результатам шестидневной кампании 2020 г.; 80 кт × км-2 × год-1 CO2 и 161 т × км-2 × год-1 CH4 для 15 дней кампаний 2019 и 2020 гг. Эмиссионные соотношения СH4/CO2 и CO/CO2 для Санкт-Петербурга в марте - начале мая 2020 г. составили в среднем 6,4 и 5,7 ppbv/ppmv соответственно. Карантинные ограничения (COVID-19) повлияли на структуру выбросов Санкт-Петербурга: резкое снижение транспортной активности привело к значительному уменьшению выбросов СО от автотранспорта. St. Petersburg is the second most populous city in the Russian Federation and the fourth in Europe. According to official statistics, ~ 5.6 million people live in the city permanently. In order to experimentally estimate greenhouse gas emissions from the territory of the St. Petersburg agglomeration, an original combined approach was developed and implemented during EMME-2019 and ЕММЕ-2020 observational campaign. The paper summarizes the results of mobile experiments in 2019 and 2020. It is shown that the period “March - early May”, chosen for the EMME campaigns, is optimal for estimating CO2 emissions. It was found that the average values of anthropogenic additives caused by emissions from the territory of St. Petersburg are ~ 1.07 ppmv and ~ 6.61 ppbv for CO2 and CH4, respectively. Experimental estimates of specific greenhouse gas fluxes for the territory of the St. Petersburg agglomeration amounted to 72 kt × km-2 × year-1 CO2 and 198 t × km-2 × year-1 CH4 for six days of 2020 campaign; 80 kt × km-2 × year-1 CO2 and 161 t × km-2 × year-1 CH4 for 15 days of campaigns 2019 and 2020. The CH4/CO2 and CO/CO2 emission ratios for St. Petersburg in March - early May 2020 averaged 6.4 and 5.7 ppbv/ppmv, respectively. Quarantine restrictions (COVID-19) affected the emission structure of St. Petersburg: a sharp decrease in transport activity led to a significant decrease in CO emissions from motor vehicles.
Liquid water path (LWP) is one of the most important cloud parameters and is crucial for global and regional climate modelling, weather forecasting, and modelling of the hydrological cycle and interactions between different components of the climate system: the atmosphere, the hydrosphere, and the land surface. Space-borne observations by the SEVIRI instrument have already provided evidence of the systematic difference between the cloud LWP values derived over the land surface in Northern Europe and those derived over the Baltic Sea and major lakes during both cold and warm seasons. In the present study, the analysis of this LWP land-sea contrast for the period 2011–2017 reveals specific temporal and spatial variations, which, in some cases, seem to be artefacts rather than of natural origin. The geographical objects of investigation are water bodies and water areas located in Northern Europe that differ in size and other geophysical characteristics: the Gulf of Finland and the Gulf of Riga in the Baltic Sea and large and small lakes in the neighbouring region. The analysis of intra-seasonal features has detected anomalous conditions in the Gulf of Riga and the Gulf of Finland, which show up as very low values of the LWP land-sea contrast in August with respect to the values in June and July every year within the considered time period. This anomaly is likely an artefact caused by the LWP retrieval algorithm since the transition from large LWP contrast to very low contrast occurs sharply, synchronically, and at a certain date every year at different places in the Baltic Sea.
Climate change is one of the most important global problems of the 21st century. The territory of Russia is located in an area of significant observed and forecasted climate change. Achieving Russia's carbon neutrality by 2060 requires the development of a national system for monitoring greenhouse gas emissions and uptake. To achieve this goal, the Ministry of Science and Higher Education launched a pilot programme to create a national network of carbon polygons. St Petersburg State University together with Voeikov Main Geophysical Observatory created the concept of Ladoga carbon polygon focusing the study the greenhouse gas absorption (or sequestration) potential of forest ecosystems typical for Northwest Russia. The evolution of this project assumes the establishment of a forest carbon farm (nature-based solutions). Based on the assumption that the territories of forest areas that were previously part of the state agricultural lands of the Leningrad region can be used for carbon farms (afforestation, enhanced carbon uptake by changing land use), an estimate of CO2 absorption has been made. For the total area of forest carbon farms of 677.9 · 103 ha, it was evaluated of 3700 ± 1900 kt CO2/year or (1000 ± 520) ·106kg С/ year. It is shown that the CO2 absorption of such carbon farms can offset up to 20 % of the total CO2 emission of the Leningrad Region and not more than 8 % of the total CO2 emission for the combined region consisting of Leningrad Region and St Petersburg. The economic effect of the operation of forest carbon farms can only be achieved in the long term. At the current price level per tonne of CO2 (35 USD/(t CO2 )), a 1 hectare of forest carbon farm would yield an income of 9500 USD over a 75-year lifetime. This determines the economic feasibility of creating carbon farms, which is also due to the potential for the production of carbon units based on them, which will either be traded on carbon exchanges or be taken into account as the results of activities aimed at reducing carbon emissions.
Based on the analysis of high-resolution FTIR spectra recorded at the atmospheric monitoring station of St. Petersburg State University during 2009–2022, a possibility of deriving the NO2 tropospheric column from ground-based measurements of direct solar radiation in the mid-IR range is studied. The best agreement (correlation coefficient r = 0.68) with simultaneous DOAS measurements of the NO2 tropospheric column at the same monitoring station is provided by a retrieval technique based on the use of the spectral range 2914.30–2914.85 cm−1 in combination with the Tikhonov–Phillips regularization. It is shown that FTIR measurements make it possible to reliably detect high levels of tropospheric NO2 at the SPbSU monitoring station. Our results can be used at the FTIR stations of the NDACC network for significant expansion of the geography of tropospheric NO2 monitoring.
Megacities are strong sources of environmental pollution. Accurate estimates of the corresponding emissions are important to assess environmental impact and to ensure reliable operation of numerical atmospheric models. One of the most important factors of air pollution in large cities and industrial centers is anthropogenic emission of nitrogen oxides, NOx (= NO + NO2). St. Petersburg is the second largest industrial city in Russia and one of the largest northern megacities in the world. This study aims to experimentally derive the total NOx emission from the metropolitan area of St. Petersburg, based on data from mobile DOAS measurements of NO2 amount. We use data from a series of mobile experiments performed around the city in March and April 2019 and combine them with NO2 field calculations based on HYSPLIT (Hybrid Single-Particle Lagrangian Integrated Trajectory) simulations. As an initial approximation to a priori information on the spatial distribution of NOx emission sources in the St. Petersburg area, we consider ODIAC (Open-source Data Inventory for Anthropogenic CO2) data. Based on fitting the HYSPLIT simulation results to our mobile DOAS (Differential Optical Absorption Spectroscopy) measurements, and applying some assumptions about the daily, weekly and seasonal cycles of urban anthropogenic pollution, we obtained an experimental estimate of total NOx emissions of 77 +/- 27 kilotons in 2019. Moreover, we managed to obtain an estimate of the contribution of urban thermal power plants to the total NOx emissions, which amounting to similar to 28%.
Abstract. Combined zenith and off-zenith ground-based observations by modern microwave radiometers provide an opportunity to study horizontal inhomogeneities of the humidity field in the troposphere and of the cloud liquid water path (LWP) spatial distribution. However, practical applications are difficult and require thorough analysis of the information content of measurements, assessment of errors of data processing algorithm and the development of the quality control procedures. In this study we analyse the application of our LWP retrieval algorithm based on the inversion of the radiative transfer equation to the problem of detection of the LWP horizontal inhomogeneities by means of ground-based microwave observations in the vicinity of a coastline of a water object of medium size. The study is based on data acquired by the microwave radiometer RPG-HATPRO which is located in the suburbs of St.Petersburg, Russia, at 2.5 km distance from the coastline of the Neva Bay (the Gulf of Finland) and is operating in angular scanning mode in the vertical plane. The retrieval setup is organised in such a way that zenith and off-zenith measurements provide equal sensitivity to atmospheric parameters. The optimal elevation angles for off-zenith observations are selected. The possibility to detect LWP horizontal inhomogeneity, namely the LWP land-sea contrast, for different measurement geometries (elevation angles) and values of cloud base height is analysed. It is shown that ground-based microwave observations in the vicinity of a coastline can be a valuable tool for validation of the space-borne measurements of the LWP land-sea contrast if three principal requirements are met: (a) the multi-parameter physical inversion method is used for retrieving LWP; (b) rigorous bias correction and quality control procedures are applied to the retrieval results; (c) the information on the cloud base height is available. As a result of processing the microwave measurements at the observational site of St.Petersburg State University, the monthly-averaged values of the LWP land-sea difference have been obtained for summer months within the period 2013–2021. For 24 out of 25 months of high quality observations, the LWP land-sea monthly difference is positive (larger values over land and smaller values over water) and can reach 0.06–0.07 kg m−2. The estimations of the LWP land-sea contrast obtained from the ground-based microwave measurements at the observational site of St.Petersburg University are in very good agreement with the values of the LWP land-sea contrast obtained from the multi-year space-borne measurements by the SEVIRI instrument (Spinning Enhanced Visible and InfraRed Imager) in the region of the Neva Bay (the Gulf of Finland) in June and July. For August, the so-called “August anomaly” detected by space-borne observations is not confirmed by the ground-based measurements.
В течение трех лет, в марте-апреле 2019-2021гг. проводилась измерительная кампания, нацеленная на изучение антропогенных загрязнений мегаполиса Санкт-Петербург, а также на оценку эмиссионных соотношений и антропогенных выбросов парниковых (CO2, CH4) и химически активных (CO, NOx) газов. Основными приборами, использовавшимися в кампании, были портативные Фурье-спектрометры, которые применялись для наземных измерений общего содержания CO2, CH4 и CO с подветренной и наветренной сторон города. Фактическая эволюция шлейфа городских загрязнений NOx регистрировалась с использованием мобильных DOAS-измерений рассеянного солнечного излучения в видимой области спектра. DOAS-измерения осуществлялись вдоль кольцевой автодороги (КАД) при помощи спектрометра OceanOptics HR4000, установленного на автомобиле.
Abstract. Liquid water path (LWP) is one of the most important cloud parameters. The knowledge on LWP is critical for many studies including global and regional climate modelling, weather forecasting, modelling of hydrological cycle and interactions between different components of the climate system: the atmosphere, the hydrosphere, and the land surface. Satellite observations by the SEVIRI and AVHRR instruments have already provided the evidences of the systematic difference between the LWP values derived over the land surface and over the Baltic Sea and major lakes in Northern Europe during both cold and warm seasons. The goal of the present study is to analyse the phenomenon of the LWP horizontal inhomogeneities in the vicinity of various water bodies in Northern Europe making focus on the temporal and spatial variation of LWP. The objects of investigation are water bodies and water areas located in Northern Europe which are different in size and other characteristics: Gulf of Finland, Gulf of Riga, the Neva River bay, lakes Ladoga, Onega, Peipus, Pihkva, Ilmen, and Saimaa. The input data are the LWP values of pure liquid-phase clouds derived from the space-borne observations by the SEVIRI instrument in 2011–2017 during daytime. The study revealed that in general the mean values of the land-sea LWP gradient are positive during all seasons (larger values over land, smaller values over water surface). However, the negative gradients were also detected over several relatively small water bodies during cold (winter) season. The important finding is the positive trend of the land-sea LWP gradient detected within the time period 2011–2017. The analysis of intra-seasonal features revealed special conditions on the territory of the Gulf of Finland where in June and July large and moderate positive LWP gradients prevail over negative ones while in August positive and negative gradients are much smaller (in terms of absolute values) and occur with equal frequency. This result can lead to the conclusion about possible common physical mechanisms that drive the land-sea LWP difference in the Baltic Sea region at small distances from the coastline. The diurnal cycle of the LWP land-sea gradient has been detected in June and July while there was no evidence for it in August. For several specific cases, atmospheric parameters over the mesoscale domain comprising Gulf of Finland and several lakes have been simulated with the numerical model ICON in limited area and weather prediction mode. These simulations have clearly demonstrated the LWP land-sea gradient and have pointed out less stability of the atmosphere over land surfaces.
The results of the cloud liquid water path (LWP) “land–sea” gradient retrieval from ground-based measurements of the downwelling microwave radiation near the Gulf of Finland coastline in the suburbs of Saint-Petersburg are presented. The measurements were carried out at the Department of Physics, St. Petersburg State University, by an RPG-HATPRO radiometer operating in the angular scanning mode. The inverse problem is solved by linear regression with the use of different statistical models of cloudiness for training the algorithm. Seven-year average values of the gradient of LWP for summer and winter have been obtained. The results demonstrate the presence of a positive “land–sea” gradient of LWP (larger values over the land and smaller values over the sea) in both periods, which qualitatively agrees with available satellite data.
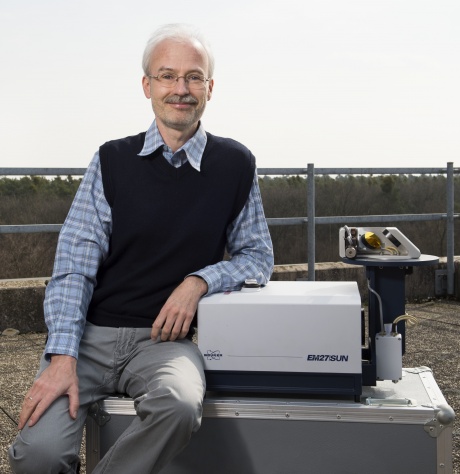
Global climate change is one of the most important scientific, societal and economic contemporary challenges. Fundamental understanding of the major processes driving climate change is the key problem which is to be solved not only on a global but also on a regional scale. The accuracy of regional climate modelling depends on a number of factors. One of these factors is the adequate and comprehensive information on the anthropogenic impact which is highest in industrial regions and areas with dense population – modern megacities. Megacities are not only “heat islands”, but also significant sources of emissions of various substances into the atmosphere, including greenhouse and reactive gases. In 2019, the mobile experiment EMME (Emission Monitoring Mobile Experiment) was conducted within the St. Petersburg agglomeration (Russia) aiming to estimate the emission intensity of greenhouse (CO2, CH4) and reactive (CO, NOx) gases for St. Petersburg, which is the largest northern megacity. St. Petersburg State University (Russia), Karlsruhe Institute of Technology (Germany) and the University of Bremen (Germany) jointly ran this experiment. The core instruments of the campaign were two portable Bruker EM27/SUN Fourier transform infrared (FTIR) spectrometers which were used for ground-based remote sensing measurements of the total column amount of CO2, CH4 and CO at upwind and downwind locations on opposite sides of the city. The NO2 tropospheric column amount was observed along a circular highway around the city by continuous mobile measurements of scattered solar visible radiation with an OceanOptics HR4000 spectrometer using the differential optical absorption spectroscopy (DOAS) technique. Simultaneously, air samples were collected in air bags for subsequent laboratory analysis. The air samples were taken at the locations of FTIR observations at the ground level and also at altitudes of about 100 m when air bags were lifted by a kite (in case of suitable landscape and favourable wind conditions). The entire campaign consisted of 11 mostly cloudless days of measurements in March–April 2019. Planning of measurements for each day included the determination of optimal location for FTIR spectrometers based on weather forecasts, combined with the numerical modelling of the pollution transport in the megacity area. The real-time corrections of the FTIR operation sites were performed depending on the actual evolution of the megacity NOx plume as detected by the mobile DOAS observations. The estimates of the St. Petersburg emission intensities for the considered greenhouse and reactive gases were obtained by coupling a box model and the results of the EMME observational campaign using the mass balance approach. The CO2 emission flux for St. Petersburg as an area source was estimated to be 89 ± 28 ktkm-2yr-1, which is 2 times higher than the corresponding value in the EDGAR database. The experiment revealed the CH4 emission flux of 135 ± 68 tkm-2yr-1, which is about 1 order of magnitude greater than the value reported by the official inventories of St. Petersburg emissions (∼ 25 tkm-2yr-1 for 2017). At the same time, for the urban territory of St. Petersburg, both the EMME experiment and the official inventories for 2017 give similar results for the CO anthropogenic flux (251 ± 104 tkm-2yr-1 vs. 410 tkm-2yr-1) and for the NOx anthropogenic flux (66 ± 28 tkm-2yr-1 vs. 69 tkm-2yr-1).
The anthropogenic impact is a major factor of climate change, which is highest in industrial regions and modern megacities. Megacities are a significant source of emissions of various substances into the atmosphere, including CO2 which is the most important anthropogenic greenhouse gas. In 2019 and 2020, the mobile experiment EMME (Emission Monitoring Mobile Experiment) was carried out on the territory of St Petersburg which is the second-largest industrial city in Russia with a population of more than 5 million people. In 2020, several measurement data sets were obtained during the lockdown period caused by the COVID-19 (COronaVIrus Disease of 2019) pandemic. One of the goals of EMME was to evaluate the CO2 emission from the St Petersburg agglomeration. Previously, the CO2 area flux has been obtained from the data of the EMME-2019 experiment using the mass balance approach. The value of the CO2 area flux for St Petersburg has been estimated as being 89±28 kt km−2 yr−1, which is 3 times higher than the corresponding value reported in the official municipal inventory. The present study is focused on the derivation of the integral CO2 emission from St Petersburg by coupling the results of the EMME observational campaigns of 2019 and 2020 and the HYSPLIT (HYbrid Single-Particle Lagrangian Integrated Trajectories) model. The ODIAC (Open-Data Inventory for Anthropogenic CO2) database is used as the source of the a priori information on the CO2 emissions for the territory of St Petersburg. The most important finding of the present study, based on the analysis of two observational campaigns, is a significantly higher CO2 emission from the megacity of St Petersburg compared to the data of municipal inventory, i.e. ∼75800±5400 kt yr−1 for 2019 and ∼68400±7100 kt yr−1 for 2020 versus ∼30 000 kt yr−1 reported by official inventory. The comparison of the CO2 emissions obtained during the COVID-19 lockdown period in 2020 to the results obtained during the same period of 2019 demonstrated the decrease in emissions of 10 % or 7400 kt yr−1.
Improvement of cloud modelling for global and regional climate and weather studies requires comprehensive information on many cloud parameters. This information is delivered by remote observations of clouds from ground-based and space-borne platforms using different methods and processing algorithms. Cloud liquid water path (LWP) is one of the main obtained quantities. Previously, measurements of LWP by the SEVIRI (Spinning Enhanced Visible and InfraRed Imager) and AVHRR (Advanced Very High Resolution Radiometer) satellite instruments provided evidence for the systematic differences between LWP values over land and water areas in northern Europe. An attempt is made to detect such differences by means of ground-based microwave observations performed near the coastline of the Gulf of Finland in the vicinity of St Petersburg, Russia. The microwave radiometer (RPG-HATPRO, Radiometer Physics GmbH - Humidity And Temperature PROfiler), located 2.5 km from the coastline, is functioning in the angular scanning mode and is probing the air portions over land (at an elevation angle of 90 degrees) and over water (at seven elevation angles in the range 4.8-30 degrees). The influence of the land-sea LWP difference on the brightness temperature values in the 31.4 GHz spectral channel has been demonstrated, and the following features have been detected: (1) an interfering systematic signal is present in the 31.4 GHz channel, which can be attributed to the humidity horizontal gradient, (2) clouds over the opposite shore of the Gulf of Finland mask the LWP gradient effect. Preliminary results of the retrieval of LWP over water by the statistical regression method applied to the microwave measurements by HATPRO in the 31.4 and 22.24 GHz channels are presented. The monthly averaged results are compared to the corresponding values derived from the satellite observations by the SEVIRI instrument and from the reanalysis data.
 Dmitry V Ionov合作论文数23
 Yuri Timofeyev合作论文数16
 Maria V. Makarova合作论文数15
 A. V. Poberovskii合作论文数9Yu. M. Timofeyev合作论文数8Ym Timofeev合作论文数6H GRASSL合作论文数6N. A. Zaitsev合作论文数6Stefani C. Foka合作论文数5
 Alexander Polyakov合作论文数5
 Anke Kniffka合作论文数5
 Yana Virolainen合作论文数5Yu. M. Timofeev合作论文数5v a polyakov合作论文数4S. Ch. Foka合作论文数3Yuriy M. Timofeyev合作论文数3k grossmann合作论文数3
 Viktor Ivakhov合作论文数3Hamud Kh. Imhasin合作论文数3
 Frank Hase合作论文数Forschungszentrum Karlsruhe3Thomas Blumenstock合作论文数Institute of Meteorology and Climate Research, Karlsruhe Institute of Technology3Ya. A. Virolainen合作论文数3Helen M. Steele合作论文数3
 Thomas Von Clarmann合作论文数Fakultät für Bauingenieur-, Geo- und Umweltwissenschaften, Karlsruher Instituts für Technologie;Institut für Meteorologie und Klimaforschung, Karlsruher Instituts für Technologie3
 Vladimir V. Rozanov合作论文数3
 M. J. Newchurch合作论文数University of Alabama at Huntsville3S. I. Osipov合作论文数2E. Yu. Biryukov合作论文数2A. V. Poberovsky合作论文数2B. Kerridge合作论文数2Egor Y. Biryukov合作论文数2
 E. V. Abakumov合作论文数2N. N. Paramonova合作论文数2
 Carlos Alberti合作论文数2
 V. V. Kalinnikov合作论文数Innopolis University2
 Sergey Osipov合作论文数King Abdullah Univ Sci & Technol, Div Phys Sci & Engn, Thuwal, Saudi Arabia2Anatoly Poberovsky合作论文数2
 Bernd Rainer Funke合作论文数Instituto de Astrofísica de Andalucía, Consejo Superior de Investigaciones Científicas2Katja Drdla合作论文数2
 Anu Dudhia合作论文数Department of Physics, University of Oxford2A. V. Rakitin合作论文数2
 Thorsten Warneke合作论文数2
 David Edwards合作论文数Atmospheric Chemistry Observations & Modeling Lab, National Center for Atmospheric Research2A. Linden合作论文数2Vincent G. Brackett合作论文数2M. Lopez-Puertas合作论文数1Ki Selyakov合作论文数1aleksandr polyakov合作论文数1B. K. Makarov合作论文数1




