The programmer’s attention have been utilized for the behavioral research in programming education. Existing approaches mainly focused on the programmer’s visual attention measured by gaze trackers. However, for the scenarios of programming and debugging, the measurement on just eye movements is not sufficient for understanding programming attention. The measurements on programmer’s other modals of behaviors, including mouse clicks and keyboard inputs, are also required. In this paper, we focus on the programming attention visualization problem in the debugging test scenario. A series of attention visualization approaches are proposed for the two main types of interactions, i.e. reading source code and editing/debugging by keyboard and mouse. We develop methods to visualize student’s attentions from either reading or debugging interactions, and then merge them into multimodal programming attention. The experiment results show that, the proposed multimodal attention graphs can show the diversity of students’ debugging strategies in terms of reading and editing focus in code line and time dimensions. It can help the teacher infer the students’ behavioral intentions and conduct individual diagnose in debugging tests.
This paper introduces BURT, a web-based chatbot for interactive reporting of Android app bugs. BURT is designed to assist Android app end-users in reporting high-quality defect information using an interactive interface. BURT guides the users in reporting essential bug report elements, i.e., the observed behavior, expected behavior, and the steps to reproduce the bug. It verifies the quality of the text written by the user and provides instant feedback. In addition, BURT provides graphical suggestions that the users can choose as alternatives to textual descriptions. We empirically evaluated BURT, asking end-users to report bugs from six Android apps. The reporters found that BURT's guidance and automated suggestions and clarifications are useful and BURT is easy to use. BURT is an open-source tool, available at github.com/sea-lab-wm/burt/tree/tool-demo. A video showing the full capabilities of BURT can be found at https://youtu.be/SyfOXpHYGRo
Researchers explored the cognitive process of students by analyzing their eye-tracking data in some specified computer programming tasks. Although there are some quantified analysis and data visualization methods proposed in this area, none of them is designed to visualize the attention migration in debugging task. In this paper, we designed a novel kind of chart, i.e. Attention Cloud Map (ACM), for this purpose. We model the semantic code space into a polar coordinate system, and map the code lines and functions of the test program are mapped into points and sectors. We put the bug line in the center point, and mark the relevant code areas in the code space. By plotting the heat map of the amount of eye fixation attention in given time slices, we can obtain a serial of attention distributions in the code space. Experiment results show that, such attention cloud map can enable us to observe the debugging strategy of individual student, and abstract the average progress of one student group, which can be provide some references for the evaluation of students’ debugging performances.
Many software bugs are reported manually, particularly bugs that manifest themselves visually in the user interface. End-users typically report these bugs via app reviewing websites, issue trackers, or in-app built-in bug reporting tools, if available. While these systems have various features that facilitate bug reporting (e.g., textual templates or forms), they often provide limited guidance, concrete feedback, or quality verification to end-users, who are often inexperienced at reporting bugs and submit low-quality bug reports that lead to excessive developer effort in bug report management tasks. We propose an interactive bug reporting system for end-users (BURT), implemented as a task-oriented chatbot. Unlike existing bug reporting systems, BURT provides guided reporting of essential bug report elements (i.e., the observed behavior, expected behavior, and steps to reproduce the bug), instant quality verification, and graphical suggestions for these elements. We implemented a version of BURT for Android and conducted an empirical evaluation study with end-users, who reported 12 bugs from six Android apps studied in prior work. The reporters found that BURT'S guidance and automated suggestions/clarifications are useful and BURT is easy to use. We found that BURT reports contain higher-quality information than reports collected via a template-based bug reporting system. Improvements to BURT, informed by the reporters, include support for various wordings to describe bug report elements and improved quality verification. Our work marks an important paradigm shift from static to interactive bug reporting for end-users.
Debugging behavior measurement is a traditional field. There are many studies on debugging behaviors, but most of the measurement materials are programs with a single bug, and there are rarely multiple bugs in one program. In a multi-bug test scenario, unlike a single bug, we need to consider the connection between multiple bugs, i.e. the relationship between the order or performance of bug fixation and the code in which bugs are located. There is little basic knowledge about the research based on multiple bugs at present. In this paper, we tentatively perform a measurement study based on debugging behaviors in a multi-bug program. We concentrate on discovery and solution sequences and temporal performance of bugs, as well as the relationship between complexity and debugging behaviors for different bugs. Our results show that debugging behaviors have some correlations with the bug complexity if the code indentation is cited to describe the complexity of bugs. Our work can be used as a reference for the future in-depth study of code complexity and debugging behaviors.
Many studies have shown the benefits of introducing open-source projects into teaching Software Engineering (SE) courses. However, there are several limitations of existing studies that limit the wide adaptation of open-source projects in a classroom setting, including (1) the selected project is limited to one particular project, (2) most studies only investigated on its effect on teaching a specific SE concept, and (3) students may make mistakes in their contribution which leads to poor quality code. Meanwhile, software companies have successfully launched programs like Google Summer of Code (GSoC) and FindBugs "fixit" to contribute to open-source projects. Inspired by the success of these programs, we propose GitHub-OSS Fixit, a team-based course project where students are taught to contribute to open-source Java projects by fixing bugs reported in GitHub. We described our course outline to teach students SE concepts by encouraging the usages of several automated program analysis tools. We also included the carefully designed instructions that we gave to students for participating in GitHub-OSS Fixit. As all lectures and labs are conducted online, we think that our course design could help in guiding future online SE courses. Overall, our survey results show that students think that GitHub-OSS Fixit could help them to improve many skills and apply the knowledge taught in class. In total, 154 students have submitted 214 pull requests to 24 different Java projects, in which 93 of them have been merged, and 46 have been closed by developers.
Various visualization methods have been proposed for eye movement analysis in programming education. However, most of them were utilized for the general scenario of program comprehension. In this paper, we focus on the eye movement visualization in a specified scenario of error-finding test, in which the students are asked to find multiple errors in a C-language program and submit the result by clicking the corresponding checkbox. A novel visualization scheme namely Attention Distribution Graph (ADG), is proposed to describe the line-level transition of student’s visual attention. We adopt time distance to click event and line number to describe the spatio-temporal space of eye movement, and color the space grids according to the proportion of fixation duration. Experiment results show that, from the distribution of colored grids in ADG, we can infer the student’s cognitive process in a successful error-finding task. It provides a normalized view to analyze the students’ eye movement toward a same bug, especially on the influence of preceding reading to the later decision.
 Wenqing Cheng (程文青)合作论文数School of Electronic Information and Communications, Huazhong University of Science and Technology4
 Wei Liu (刘威)合作论文数School of Electronic Information and Communications, Huazhong University of Science and Technology4
 Xinyu Li (李新宇)合作论文数School of Mechanical Science & Engineering, Huazhong University of Science and Technology3
 Junayed Mahmud合作论文数George Mason University2
 Denys Poshyvanyk合作论文数Department of Computer Science, School of Computing, Data Sciences & Physics, William and Mary2
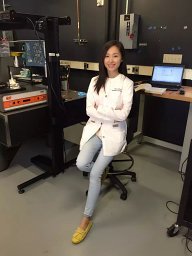 Yang Song合作论文数Shanghai Jiao Tong University2
 Kevin Moran合作论文数SAGE Lab, Department of Computer Science, College of Engineering and Computer Science, University of Central Florida2
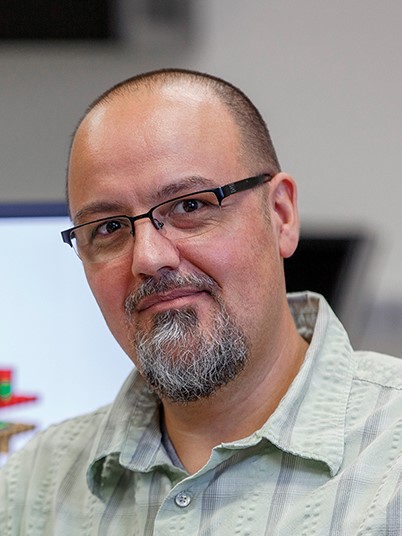 Andi Marcus合作论文数Department of Computer Science, The University of Texas at Dallas2
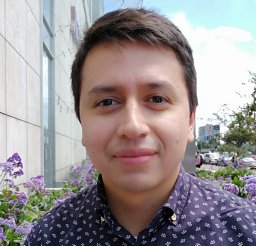 Oscar Chaparro合作论文数2
 Nadeeshan Gimhana De Silva合作论文数1
 Ziqiang Li合作论文数1
 Xiao-Wen Zhang合作论文数Southern University of Science and Technology1
 HuiTong Liu (刘慧通)合作论文数1
 Jing Xu (徐竞)合作论文数School of Optical and Electronic Information, Huazhong University of Science and Technology;Wuhan National Laboratory for Optoelectronics, Huazhong University of Science and Technology1
 Shin Hwei Tan (陈馨慧)合作论文数Department of Computer Science and Software Engineering, Concordia University;Automated Program RepaIr and MaintEnance Lab, Concordia University1




