自IPCC发布第六次科学评估报告(AR6)[1]以来,除了世界气象组织(WMO)逐年发布的全球气候状况报告 [2-4],美国国家大气海洋局(NOAA)和美国航空航天局(NASA)以及中国气象局也分别发布了 2022 年全球气候报告 [5-7].这些报告结果一致表明,2015—2022 年全球明显变暖,是有观测记录以来连续最暖的 8 年.近 8 年的全球变暖特征主要表现为:人类排放增加,日最低温度明显变暖,热浪增加,北极超暖,陆面温度明显变暖,海洋热容量最暖,海洋酸化增加,海洋热浪增加,海冰融化加剧,冰川融化退缩,多年冻土融化,陆地积雪范围和日数减少,海平面上升;一些地区洪涝频发,而另一些地区酷热干旱、热浪与野火多发等.在此期间,大部分极端事件的发生频率为每年 4 次,较常年(3 次)增加.在上述报告基础上,本文综述了 2015—2022 年全球最暖的特征,特别是近 3 年的特点.
厄尔尼诺事件与全球冷暖和旱涝密切联系,因此一直是受到关注的问题 [1].本文综述在全球变暖背景下,观测到的厄尔尼诺变化和与人类活动的关系以及预估未来在全球变暖背景下的变化.
沙尘暴是一种灾害性天气现象,全球每年大约有 20 亿t的沙尘排放到大气中,包括自然和人为因素造成.世界气象组织(WMO)从2017 年开始每年发布《大气浮尘公报》,介绍自 2016 年以来每年全球沙尘变化 [1-2].全球变暖对沙尘暴的发生和变化有什么影响,是公众关心的问题,本文综述观测到的沙尘暴的变化特征和未来在全球变暖的背景下对沙尘暴变化的预估与展望.
地球系统能量收支平衡即能量守恒,在大气顶部,入射的太阳辐射与出射辐射(包括反射的太阳辐射和地气系统发射的长波辐射)基本平衡.但是近百年来人类活动向大气排放的温室气体明显增加,例如CO2从工业革命前(1750年)的280×10-6,到2019年的(410±0.2)×10-6,增加148%;CH4和N2O增加了260%和123%[1].
自20世纪70年代初期开始,一些科研团队已经开始利用气候模式和数理统计方法做未来30年或更长时期气候变化的预估,到现在已经有50年了.这50年气候变化的观测事实已经出来了,因此很有必要定量地检验一下预估效果如何,以便估计现在做的未来气候变化预估的可信度.目前一些科学团队 [1]和IPCC第六次评估报告 [2]已经对近几十年全球气温预估效果做了一些客观定量的评估,文中简要综述这两个研究成果.
观测表明近百年全球在变暖,特别是自1970年以来更加明显,相应海平面上升、冰雪融化、异常与极端天气以及气候事件频发,给社会与经济造成极大影响 [1-4].值得注意的是,在21世纪的未来80年是否会继续保持增暖的趋势,以及这种变暖在历史上的地位和从古气候暖期所获得的启示,本文将集中在这个问题上.
Atmospheric moisture transport (AMT) contributes significantly to the recent accelerated Arctic warming. However, the impact of AMT has not been well quantified, not to mention the relative contribution of its impact on microphysical latent heating (LAH) and longwave radiative heating (LWH). A series of Polar‐WRF model experiments with different magnitudes of AMT are conducted to study the response of winter Arctic temperature to AMT variations. Results show that atmospheric precipitable water is very sensitive to AMT variations and thus can define the changes in surface air temperature by altering surface downward longwave radiation. Additionally, because evaporation and sublimation tend to balance the AMT‐induced moisture changes near the surface, LWH in the lower troposphere is determined by downward longwave radiation and thus can be the dominant factor for temperature variations. However, temperature in the mid‐ and upper troposphere is primarily determined by changes in LAH, because the content of ice‐phase cloud aloft is significantly affected by AMT. In addition, the changes in LWH in the mid‐ and upper troposphere are governed by upward longwave radiation, thus offsetting some of the temperature variations. These findings have implications for the attribution of Arctic current warming and the prediction of its future temperature change.
1 气候突变、翻转点和不可逆 在古气候和历史时期气候变化中有时会发生气候突变,近几十年全球明显变暖,引发人们对是否会发生气候突变的关注. 对气候突变与翻转点和不可逆有许多定义,根据 IPCC 报告,气候突变(abrupt climate change)是指气候从一种稳定态(或稳定持续的变化趋势)跳跃式和快速地(几十年或更短)转变到另一种稳定态(至少稳定几十年或稳定持续的变化趋势)的现象,对人类和自然系统产生严重干扰.它表现为气候在时空上从一个统计特性到另一个统计特性的急剧变化,或地球系统非线性响应.这涉及时间尺度和空间尺度,即从区域到全球尺度非常快地发生变化,非常快是指比气候外强迫造成的变率要快,一般简称气候突变.
2020年全球面临一次突如其来的严重疫情,即新冠肺炎,给人类带来灾难性的后果。世界卫生组织动员各国政府和公众奋起抗击疫情。与此同时,一些气象与环境专家开始研究气象、环境与新冠肺炎的关系,陆续正式或非正式发表了一些文章。这些研究关注新冠肺炎与气象和环境因素的关系,包括新冠肺炎与季节的关系(认为可能冬季更严重)、与纬度的关系(认为可能在中高纬度更严重)、与空气污染的关系(认为可能污染越重病情越重)、与温度的关系(认为可能越冷病情更严重),有些研究还建立数学模型做定量分析,预测和估计未来疫情的发展和动态(认为2020年秋冬季将进入第二波,还有研究预测疫情结束时间 )。
1观测到的全球变暖世界气象组织(WMO)2020年全球气候状况报告[1]给出,2020年较1850—1900年变暖(1.2±0.1)℃,是自有观测记录以来3个最暖的年之一(2016,2019,2020年),而2016—2020年和2011—2020年分别是有观测记录以来最暖的5年和最暖的10年。注意到,2020年大气中CO2浓度超过410×10-6,是1750年的148%。近百年的变暖不同于以前的特征为变暖持续的时间最长、从长期冷期转为变暖、迅速变暖和几乎全球各处都变暖。这样一种变暖的特征在气候系统的5个圈层有什么响应?以下将给出观测到的5个圈层变暖的证据[1-6]。
按照归因分析的研究方法和工具,综述了近些年有关人类影响引起全球变暖证据的科学研究成果.利用全球气候模式考虑人类影响,采用指纹法检测和归因证实,发现人类影响几乎肯定是引起近百年特别是近50年全球变暖的主因.地球系统5个圈层(大气、海洋、陆地、冰雪、生物)与全球变暖有关的证据,如热浪增加、寒潮减弱、低层大气变暖、陆地和海洋变暖、受海水热膨胀和冰融化引起全球海平面上升、冰雪和永冻土融化加速、海洋酸度增加、植物生长季延长等,都与人类影响有密切联系.
基于BCC-CSM季节气候预测模式系统历史回报数据和国家气象信息中心提供的中国地面降水月值数据,通过多方法对比并讨论了影响预测结果的因素,利用长短期记忆(Long Short-Term Memory,LSTM)网络预测2014年和2015年中国夏季降水.结果表明:LSTM网络的预测效果较逐步回归、BP神经网络及模式输出结果有一定优势.参数调优对于LSTM网络预测效果影响较大,重要参数有隐含层节点数、训练次数和学习率.选择合适的起报月份数据有助于提升季节预测的准确性,利用4月起报的数据预测夏季降水效果较好.海冰分量因子对降水季节预测有正贡献.在2014年、2015年夏季降水回报试验中,LSTM网络对降水整体形势有一定的预测能力,Ps评分分别为74分、71分,距平符号一致率分别为55.63%、55.25%,Ps评分的均值高于同期全国会商及业务模式.
近些年世界气象组织不断传出全球继续变暖的信息 [1],引起公众和政策制定者对全球变暖更加广泛的关注.文中将简单综述未来气候变化预估的研究方法和工具、气候模式模拟和预估目前气温变化的效果检验以及未来20多年(2016—2040年)全球气温变化的预估.
1 地球系统科学需要人工智能 众所周知,地球系统包含了大气圈、水圈、陆地岩石圈、冰雪圈和生物圈等的复杂的相互作用和反馈,涵盖自然的和人类的全方位相互作用,直接涉及复杂的数学、地理、物理、化学和生物等多学科,间接则涉及社会和经济等众多领域.时间尺度可以从百万分之一秒到亿年,可以研究古代、历史时期、现代,以及未来的预测与预估;空间尺度宽泛,从原子到行星尺度,可以研究一个点,也可以研究整个宇宙,因此对认识地球系统带来许多困难.然而地球系统的变化涉及人类的生存,因此是全人类共同关心的问题.
Atmospheric moisture transport (AMT) is known to have an influence on the winter Arctic surface air temperature (SAT). However, a systematic investigation involving a verification of the physical linkages and spatial sensitivity within the Arctic, as well as a quantification of such contribution is still lacking. Our work first verifies the variation coherence between AMT and the SAT over the winters of 1979–2015, based on multiple data sets. Climate model projections reveal tendencies towards more frequent high values in both SAT and AMT from 2010 to 2065 relative to that from 1950 to 2005, as well as a high correlation coefficient between their detrended series. Then, a composite analysis is applied based on different AMT values. During high‐AMT episodes, enhanced AMT intrudes into the Arctic, with the Norwegian Sea as the gateway, and further induces unevenly distributed warming inside the Arctic. The greatest warming occurs in the Barents‐Kara Sea, which is tightly associated with the altered atmospheric moisture content and its subsequent changes of surface radiation balance. In addition, the intruding moisture can induce latent heat release and sea ice melting, which also influences the warming. Furthermore, by conducting numerical model experiments in the winter of 2012/2013, a total warming effect of 9.66 °C averaged across the Arctic for the original AMT is revealed. By setting different incremental AMT values in five cases, the leading role of AMT is found to switch in the 0.5MT case (the case wherein the AMT value is 0.5 times the original) from altering the atmospheric moisture content to producing precipitation. This finding suggests that evenly spaced AMTs result in the alleviation of SAT increases.
Two sets of decadal prediction experiments were performed with Beijing Climate Center climate system model version 1.1 (BCC-CSM1.1) with different initialization strategies. One experiment is relaxing modeled ocean temperature to the Simple Ocean Data Assimilation (SODA) reanalysis data (SODAInit). In the other (EnOI_ Hadlnit) experiment, the modeled ocean temperature were relaxed toward the assimilated ocean data, which were generated by assimilating sea surface temperature (SST) of the Hadley Centre Sea Ice and Sea Surface Temperature (HadISST) data to the ocean model of BCC-CSM1.1 using Ensemble Optimum Interpolation (EnOI) method. Comparisons between EnOI_HadInit and SODAInit hindcasts show that EnOI_HadInit is more skillful in predicting SST over the North Pacific, the southern Indian Ocean, and the North Atlantic. Improved prediction skill is also found for surface air temperature (SAT) over South Europe, North Africa, and Greenland, which is associated with the skillful prediction of the Atlantic multi-decadal oscillation in EnOl_Hadlnit. EnOl_Hadlnit and SODAInit are both skillful in predicting East Asian SAT, which is related to their skillful predictions of the tropical western Pacific SST. The result indicates that assimilated data generated by the ocean model of BCC-CSM1.1 with EnOI assimilation provide better initial conditions than SODA reanalysis data for the decadal predictions of BCC-CSMI.1.
2018年秋季IPCC 发布了《IPCC全球升温1.5 ℃特别报告》( 简称 SR15),报告中指出:将全球变暖限制在 1.5℃需要社会各方进行快速、深远和前所未有的变革.并且说明:与将全球变暖限制在 2℃相比,限制在 1.5℃对人类和自然生态系统有明显的益处,同时还可确保社会更加可持续和公平.本文将进一步再思考以下几点:(1) 升温1.5℃特别报告与AR5人类排放的设计的对比,即对比全球增暖 1.5℃与人类排放的设计以及可能出现的时间;(2) 人类排放以外的其他各种强迫对全球增暖的可能贡献;(3) 古气候和历史时期出现较今 ( 或工业化前,即 1850—1900 年 ) 增暖 1.5℃的特点;(4) 人类排放可控制的底线.
Wind energy has been rapidly developed in China during the past decades and the installed capacity has been the largest in the world. In the future, utilization of wind power is still expected to carry out in China mainly with a large-scale centralized layout. Here, we examine the potential climatic impacts of large-scale windfarms associated with deployment scale in China using numerical experiments, in which four deployment scenarios were designed. These four scenarios represented relatively small- (484 GW), medium- (2165 GW) and large-scale (3490 GW and 5412 GW) installed wind power capacities, respectively. Results showed that turbulent kinetic energy, wind velocity, and air temperature varied consistently within those windfarms with the largest changes in turbine hub heights. Moreover, the above relatively large-scale windfarms could induce regional warming with a maximum of above 0.8 degrees C in North China. This regional warming may be linked to an anomalous circulation pattern with a negative pressure anomaly center in Northeast China and a positive pressure anomaly center in the middle and lower reaches of the Yangtze-Huaihe River Basin.
中华人民共和国自建国以来发生了巨大的变化,特别是改革开放40年来变化更大.笔者经历了这段时间,以自己亲身参与的气候变化研究的感受从一个侧面反映中国社会的伟大变革. 20世纪70年代以来气候与气候变化研究逐步走向成熟,其标志性特点是世界气象组织(WMO)于1979年2月在日内瓦召开第一次世界气候大会.中国科学家代表团由谢义炳率队,代表有曾庆存,张丕远和王绍武.大会提出了大气二氧化碳浓度增加将导致地球升温的警告,气候变化首次作为一个受到国际社会关注的问题提上议事日程.谢义炳和王绍武教授回来后在教研室详细介绍了会议内容,使我认识到气候变化研究的重要性.1979年7月王绍武教授受邀参加在英国召开的气候和历史国际研讨会,在会上做了中国500年旱涝报告(王绍武,赵宗慈),并被收录在1981年出版的Climate and History中.
由于全球海平面的变化与海洋热容量的变化和海洋与陆地冰盖(或冰川)的融化密切相关,因此全球海平面变化是衡量全球气候变化的重要指标.IPCC第五次科学评估报告继续强调,全球变暖和全球海平面上升密切相关[1].但是,由于海洋观测资料的获取困难和气候模式的不确定性等因素,提出对全球变暖与海平面上升有必要进行更深入的研究,近年世界气候研究计划(WCRP)召开了海平面变化研讨会[2],给出了自IPCC第五次评估报告以来的进展,由于研究涉及的领域宽泛,本文仅就近百年的全球观测再建事实、气候模式的模拟与预测,以及对未来的展望综述全球变暖与海平面上升的研究进展.
 Yong Luo (罗勇)合作论文数Department of Earth System Science, Tsinghua University113
 Xinyu Wen (闻新宇)合作论文数Department of Atmospheric & Oceanic Sciences, School of Physics, Peking University30
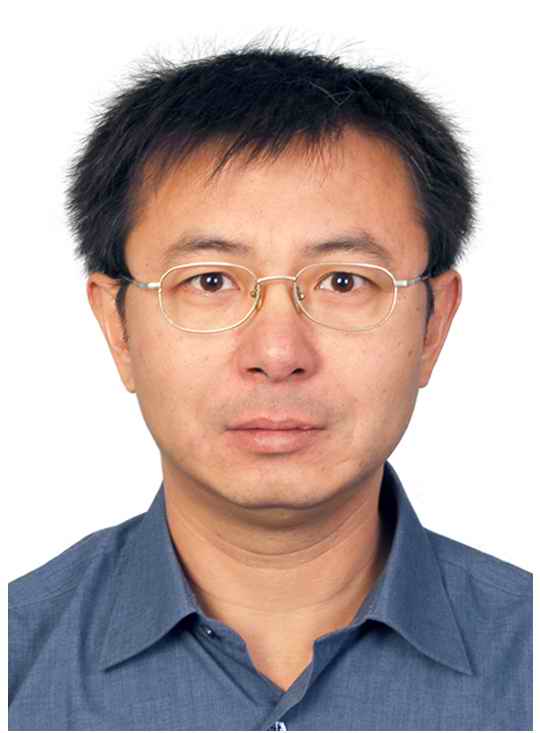 Xuejie Gao (高学杰)合作论文数Climate Change Research Center, Institute of Atmospheric Physics, Chinese Academy of Sciences;University of Chinese Academy of Sciences27
 Jianbin Huang (黄建滨)合作论文数Institute of Physical Chemistry, College of Chemistry and Molecular Engineering, Peking University22
 Yihui Ding (丁一汇)合作论文数China Meteorological Administration21
 Ying Jiang (江滢)合作论文数15
 Wenjie Dong (董文杰)合作论文数School of Atmospheric Sciences, Sun Yat-sen University;State Key Laboratory of Earth Surface Processes and Resource Ecology, Beijing Normal University9
 Filippo Giorgi合作论文数The Abdus Salam International Centre for Theoretical Physics9
 Ying Xu合作论文数7
 Guoyu Ren (任国玉)合作论文数Laboratory for Climate Studies, National Climate Center, China Meteorological Administration6Pei Xing合作论文数5
 Yanluan Lin (林岩銮)合作论文数Department of Earth System Science, Tsinghua University5
 Guangyu Shi (石广玉)合作论文数Institute of Atmospheric Physics, Chinese Academy of Sciences;School of Atmospheric Physics, Nanjing University of Information Science & Technology;University of Chinese Academy of Sciences5Mingju Hao合作论文数4
 Qingquan Li (李清泉)合作论文数Laboratory for Climate Studies, National Climate Centre;Graduate Division, Chinese Academy of Meteorological Sciences;China Meteorological Administration4Guoli Tang合作论文数4Lei Wang (王磊)合作论文数4Suping Nie (聂肃平)合作论文数4
 Zuqiang Zhang (张祖强)合作论文数China Meteorological Administration3
 Yan Guo (郭彦)合作论文数Faculty of Geographical Science, Beijing Normal University;Institute of Disaster Risk Science, Beijing Normal University3Dongfeng Zhang合作论文数3Yi-Hua Lin合作论文数3Qinhua Tian (田沁花)合作论文数3
 Jeremy S. Pal合作论文数Abdus Salam ICTP3Haojun SHEN (沈皓俊)合作论文数2OUYANG Li-cheng (欧阳里程)合作论文数2Wei Zhou合作论文数2Hongwei Sun合作论文数2Min Wei合作论文数2Guoquan Hu (胡国权)合作论文数2ShanJiang Huang (黄山江)合作论文数2XiaoSu Dai (戴晓苏)合作论文数2HongBin Liu (刘洪滨)合作论文数2DeEr Zhang (张德二)合作论文数2
 Dongliang Li (李栋梁)合作论文数School of Atmospheric Sciences, Nanjing University of Information Science and Technology2
 Shaohong Wu (吴绍洪)合作论文数Institute of Geographic Sciences and Natural Resources Research, Chinese Academy of Sciences;University of Chinese Academy of Sciences2
 Lai-Yung Ruby Leung合作论文数Pacific Northwest National Laboratory2
 Yun Qian合作论文数Pacific Northwest National Laboratory2
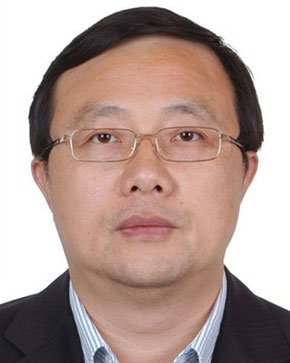 Fumin Ren (任福民)合作论文数Graduate Division, Chinese Academy of Meteorological Sciences2
 Panmao Zhai (翟盘茂)合作论文数Graduate Division, Chinese Academy of Meteorological Sciences2
 Xiaojun Guo (郭晓军)合作论文数Institute of Mountain Hazards and Environment, Chinese Academy of Sciences;University of Chinese Academy of Sciences2
 Deliang Chen (陈德亮)合作论文数Department of Earth System Science, Tsinghua University2
 Bao Yang (杨保)合作论文数School of Geography and Ocean Science, Nanjing University;Northwest Institute of Eco-Environment and Resources, Chinese Academy of Sciences2
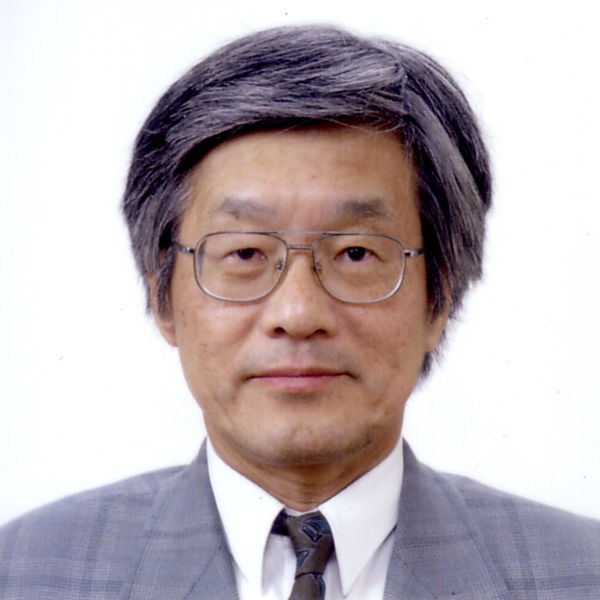 Akio Kitoh合作论文数Japan Meteorological Business Support Center2
 Ye Wu (吴烨)合作论文数School of Environment, Tsinghua University;Graduate School, Tsinghua University2




