Glutathione (GSH) and cysteine (Cys) are crucial low-molecular-weight thiol antioxidants that protect ocular tissues from oxidative stress, a key driver of age-related eye diseases. The balance between their reduced (GSH/Cys) and oxidized (GSSG/CySS) forms reflect tissue oxidative status. Despite their importance, existing analytical methods typically quantify these analytes separately, requiring multiple assays. In this work, a robust liquid chromatography-tandem mass spectrometry method for the concurrent quantification of GSH, GSSG, Cys, and CySS in ocular tissues has been developed and validated. The workflow uses derivatization of reduced thiols with monobromobimane, followed by solid-phase extraction and separation using reversed-phase high-performance liquid chromatography with an 8-min gradient elution of acetonitrile and heptafluorobutyric acid. Analytes were detected by positive-ion mode multiple reaction monitoring on a triple quadrupole mass spectrometer and quantified using extracted ion chromatograms. The method demonstrated excellent linearity, precision, and accuracy, with all quality control samples meeting acceptance criteria. Method sensitivity and reproducibility were also validated. Application to human, rat, bovine, and rabbit lenses, as well as rat retina, cornea, aqueous humor, and vitreous humor revealed distinct tissue- and species-specific redox profiles. Rat ocular tissues were found to be in a predominantly reduced state, with reduced thiols at higher concentrations than their oxidized counterparts. Rabbit lenses exhibited the highest GSH concentrations, while human lenses showed lower levels, a finding potentially related to donor age. This method has broad applicability in studies investigating the role of oxidative stress in ocular health and the development of novel treatments to prevent ocular disease.
(A) Correlation between RhoGDI2 expression levels and metastatic potential in osteosarcoma patients. (B) Cells were exposed to hypoxia for 24 h or cells infected with control lentivirus (pCCL) and lentivirus-WSB1. RhoGDI2 mRNA expression was analyzed by RT-PCR and shown as a histogram after normalization, β-Actin was used as a control gene. (C) KHOS/NP cells treated with hypoxia for 24h together with 10 μM MG132, and RhoGDI2 protein levels were measured by western-blot analysis. (D) Colocalization of endogenous WSB1 and RhoGDI2. KHOS/NP cells were subjected to immunofluorescence staining with anti-WSB1 and anti-RhoGDI2 antibodies.
Time-lapse movie of representative KHOS/NP cells infected with lentivirus-WSB1 on gelatin-coated surfaces.
Primers used for amplification and Illumina® sequencing of genomic DNA samples from shRNA screens.
Wound healing assay of KHOS/NP cells infected with lentivirus-WSB1 or control lentivirus (pCCL.)
Primer sequences for evaluating shRNA-mediated knockdown of POR by quantitative real-time PCR.
Wound healing assay of KHOS/NP cells infected with lentivirus-WSB1, lentivirus-RhoGDI2, lentivirus-WSB1 plus lentivirus-RhoGDI2, or control lentivirus (pCCL).
Time-lapse movie of representative KHOS/NP cells infected with control lentivirus (pCCL) on gelatin-coated surfaces.
Supplementary Data from Roles of DNA repair and reductase activity in the cytotoxicity of the hypoxia-activated dinitrobenzamide mustard PR-104A
Evaluation of SN30000-induced bystander cell killing in a co-culture system (S1); SN30000 clonogenic survival curves for HT-29, PANC-1 cells and HKO1 (S2); Plating efficiency in HT-29, PANC-1 and HKO2 reductase screens (S3); Density distributions and correlations of reductase screen sequencing data (S4); Log2 enrichment factors of shRNAs significantly selected in the reductase screens (S5); Depletion of POR protein by shRNAs in PANC-1 and HT-29 cells (S6); Replicate SN30000 clonogenic survival assays performed in stably transduced HT-29 and PANC-1 cells (S7); Measurement of plating efficiency in HKO1 and HKO2 whole-genome screens (S8); Coincidence of shRNAs significantly selected (Z > 1.96) in HT-29 and PANC-1 reductase screens and the HKO1 genome-wide screen (S9); Validation of POR shRNAs and clonogenic survival following SN30000 treatment of POR-knockout HCT116 cells (S10); Spatial distribution of POR and CA-IX expression in tongue SCC (S11); Quantitation of POR and CA-IX expression in HNSCC (S12); POR IHC staining in isogenic xenografts used for method development (S13); POR mRNA expression and sequence variation in the TCGA HNSCC dataset (S14).
Description of additional methods and procedures used in the study. Also includes Supplementary References.
Spearman correlation of expression of flavoproteins with SN30000 metabolism in tumor cell lines.
H&E staining of lung tissues in tail vein injection of KHOS/NP cells were performed in BALB/c (nu/nu) mice.
 William R. Wilson合作论文数48
 Jingli Wang合作论文数17
 Francis W Hunter合作论文数Auckland Cancer Society Research Centre, University of Auckland16
 Danny Rischin合作论文数Division of Cancer Medicine, Peter MacCallum Cancer Centre;Department of Medical Oncology, Peter MacCallum Cancer Centre;The University of Melbourne15Zvi Shalev合作论文数14Sreevalsan Sreebhavan合作论文数Univ Auckland, Fac Med & Hlth Sci, Auckland Canc Soc Res Ctr, Auckland 1, New Zealand14
 Bradly Wouters合作论文数Department of Medical Biophysics, Temerty Faculty of Medicine, University of Toronto;Princess Margaret Cancer Centre, University Health Network14
 Jason Moffat合作论文数Department of Molecular Genetics, University of Toronto;The Hospital for Sick Children14
 Marianne Koritzinsky合作论文数Department of Medical Biophysics, Temerty Faculty of Medicine, University of Toronto14
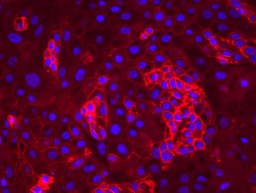 Young Richard J合作论文数Peter MacCallum Canc Ctr14Ketela Troy合作论文数14
 Benjamin Solomon合作论文数Department of Medical Oncology, Peter MacCallum Cancer Centre14
 Bo Yang (杨波)合作论文数School of Pharmacy, Zhejiang University;Hangzhou City University14
 Qiaojun He (何俏军)合作论文数College of Pharmaceutical Science, Zhejiang University14
 Ravi Vellanki合作论文数14Naveen Joshi合作论文数13Ilan Weinreb合作论文数13
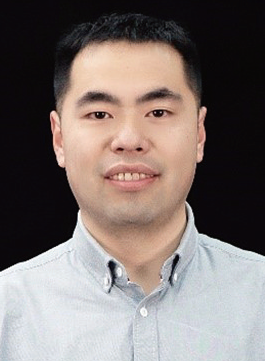 Ji Cao (曹戟)合作论文数College of Pharmaceutical Sciences, Zhejiang University;Innovation Institute for Artificial Intelligence in Medicine, Zhejiang University13Kevin R Brown合作论文数12
 David Goldstein合作论文数Department of Medical Oncology, Prince of Wales Hospital12
 Meidan Ying (应美丹)合作论文数College of Pharmaceutical Sciences, Zhejiang University12Graham J. Atwell合作论文数11
 Ling Ding (丁玲)合作论文数College of Pharmaceutical Sciences, Zhejiang University11
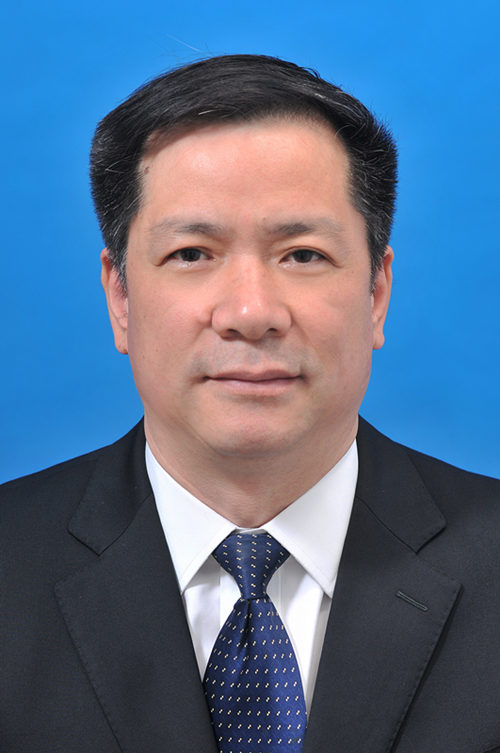 Nengming Lin (林能明)合作论文数Affiliated Hangzhou First People's Hospital, Zhejiang University School of Medicine11Frederik B Pruijn合作论文数10
 Ning Zhang (张宁)合作论文数浙江大学医学院8Adam V Patterson合作论文数8Teresa J Melink合作论文数7Lin Guanyu合作论文数7
 Yijie Wang (王一颉)合作论文数Computer Science Department, Indiana University at Bloomington6Christopher P Guise合作论文数6
 Michael B. Jameson合作论文数Department of Clinical Oncology Private Bag, Auckland Hospital6Hay Michael P合作论文数5
 Kashyap Patel合作论文数University of Dundee, University of Dundee5
 Mark McKeage合作论文数Department of Pharmacology, Faculty of Medical and Health Sciences, The University of Auckland;Auckland Oncology;Auckland City Hospital5
 Bill Denny合作论文数5
 Jing Wang (王静)合作论文数Institute of Medicinal Biotechnology, Peking Union Medical College4Dong Rong合作论文数4
 Moana Tercel合作论文数Auckland Cancer Society Research Centre, School of Medical Sciences, Faculty of Medical and Health Sciences, The University of Auckland4John Gutheil合作论文数3Zhang Ning合作论文数3
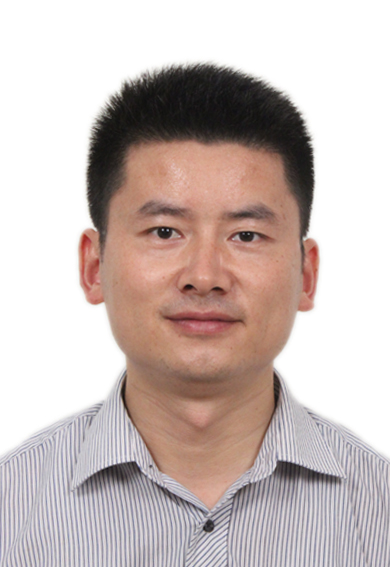 Jianguo Sun (孙建国)合作论文数Institute of Pharmaceutical Sciences, China Pharmaceutical University;State Key Laboratory of Natural Medicines, China Pharmaceutical University3
 Sophia B Chernikova合作论文数Department of Radiation Oncology, Stanford University3Benito Juliana合作论文数3
 Marina Konopleva合作论文数Department of Oncology, Albert Einstein College of Medicine;Department of Molecular Pharmacology, Albert Einstein College of Medicine3
 Jeff Smaill合作论文数Auckland Cancer Society Research Centre, Faculty of Medical and Health Sciences, The University of Auckland3Liyanage H D Sarath合作论文数3Robert F. Anderson合作论文数3




