Given the high levels of stress reported among university students, identifying everyday environmental settings that could alleviate these conditions has become increasingly urgent. University campuses are typically organized by functional zoning, with commute routes playing a key role in connecting daily activities. However, little is known about how specific environmental features along commute routes affect students' psychophysiological states. To address this gap, this study used an evidence-based framework that integrated in-situ experiments, wearable biometric sensors, spatial analysis, and advanced modeling techniques. Combining statistical models with machine learning, we tested fifteen characteristics across three dimensions, i.e., visual quality, safety, and functionality. Results showed that features related to visual quality and safety had the most consistent effects. Among these, overall route maintenance, green view, street aesthetics, and the appearance of border trees emerged as major relievers of stress, while traffic-related factors such as motor vehicles, non-motorized vehicles, and pedestrian crowding acted as stressors. Notably, several environmental features exhibited nonlinear dose-response relationships with specific thresholds, challenging the conventional view that certain elements are simply beneficial or harmful. These findings provide a scientific basis for health-oriented campus planning and support evidence-based interventions aimed at improving psychophysiological resilience in university campuses.
Given the growing number of cities in scientific collaboration networks, it is of fundamental importance to reveal functional roles and changing patterns of individual cities. However, existing studies lacked a global-scale, functionality-oriented analysis of individual cities and their dynamics. We derived the global scientific collaboration networks over two decades using publications in geography from 2003 to 2022. This spatial scale and temporal coverage allow demonstrating a globally comprehensive functional understanding of scientific collaborations. We presented a novel methodological framework to detect community structures, identify functional roles, and characterize changing patterns. We show that many communities are spatially coherent and dominated by cities of a single country, while a few communities are spatially incoherent and contributed by cities of different countries. This structure helps identify the six functional roles that cities play both within and between communities. Globally, in 2022, 79.95% of cities were weakly collaborated with other cities, while only 1.52% of cities located mainly in European and American countries played significant roles as both regional hubs and strong connectors. Remarkably, we reveal interesting patterns underlying the changes in the functional roles of individual cities over time, including the frequency heterogeneity, the temporal recancy, and the functional proximity.
We propose a deep learning-based network model, relying on multi-view multi-scale fusion with transformer, for understanding semantical information of electrical substation point clouds. Our method is inspired by human recognition of 3D objects using information from multiple perspectives and with multiple levels of details, and it is constructed by a dynamic integration of multi-view 3D morphological representation and multi-scale 3D geometric characterization. Additionally, we leverage the channel and spatial attention mechanism to capture the relationship between morphological representations at multiple views and utilize the self and cross attention mechanism to understand the relationship between geometric characterization at multiple scales. To verify our model, experiments were conducted based on our substation point clouds dataset and two benchmark datasets. Our model shows a better performance than the state-of-the-art methods, and it achieves an overall accuracy of 91.15% on our dataset, 93.30% on ModelNet40, and 92.80% on ModelNet40-C, indicating its effectiveness and robustness.
Road transport becomes the dominant driver behind the increase in global transport energy consumption, and consequently, vehicle emissions are a primary contributor to global climate change and atmospheric pollution. Despite extensive research into vehicle emissions, significant challenges persist in the refinement and application of emission models. Here, we review key techniques for developing emission factors and categorize vehicle emission models into macroscopic, mesoscopic, microscopic, and machine learning-based models. Specifically, we emphasize that an increasing number of scholars have been developing deep learning-based vehicle emission models owing to the rapid advancement of deep learning technology. We summarize the usages of vehicle emission models to compile emission inventories and discuss their applications in urban site selection, environmental pollution control, traffic management, and policy formulation. However, variations exist among vehicle emission models in terms of modeling accuracy, applicability, and computational complexity. Thus, future research should address the following challenges: (1) development of localized emission models that are suitable for different regions and scenarios; (2) fusion of deep learning-based emission models with physical models to develop novel models; (3) coupling of emission models with traffic simulation models to tackle urban sustainable transportation issues; (4) formulation of transportation policies for sustainable urban development.
Ensuring adequate access to healthy food is essential for public health. As a rapidly growing food access channel, online food delivery (OFD) services have gained widespread popularity globally, particularly in China. The accessibility of food through OFD retailers remains underexplored, however. This study addresses this gap by analyzing comprehensive data sets of 129,140 OFD retailers and 240,455 offline food retailers across ten categories in two Chinese megacities (Shenzhen and Wuhan). We estimated the service area sizes (distance decay effects) of all retailers and systematically evaluated OFD and offline food accessibility in terms of total accessibility levels, spatial inequities, categorical distributions, and market shares. The results highlight significant differences between OFD and offline food accessibility patterns, driven by distinct service area structures. Offline food retailers have a three-level hierarchical structure. A few retailers at the upper level and middle-level hierarchies have large service area sizes, whereas a huge number of retailers at the lower level hierarchy have small service area sizes. By contrast, service area sizes of all OFD retailers are equalized by enlarging those of lower level retailers and reducing those of middle-level and upper level retailers. The results of this study deepen our understanding of how OFD services alter the distance decay effects of food retailers, and how these effects shape accessibility to food retailers of various categories, including healthy and unhealthy food retailers, as well as restaurants.
The Jinan Spring Area serves as a representative of northern China’s karst regions. To explore the land-use change characteristics and their driving mechanisms, six periods of Landsat series land-use data were collected for the years 1986, 1995, 2000, 2009, 2016 and 2022. A Random Forest model was employed for classifying the remote sensing data, while the land use dynamic and land use transfer matrix were used to analyse the scale, composition, morphology, pattern and spatial and temporal characteristics of land use changes from 1986 to 2022. Principal component analysis (PCA) was used to quantitatively assessed the intensity of the driving factors influencing land use dynamics. The findings revealed thatthe land use types in Jinan are predominantly arable land and woodland, accounting for over 70
The international migration network, comprising the movements of people between countries, is one of the most important global systems of interaction, which can reflect the complex international relations of economics, cultures, and politics and has huge impacts on global sustainability. However, the conventional gravity model cannot model its complicated interactions accurately. In this article, we propose a novel reverse gravity model using genetic algorithm to reconstruct the complicated interaction patterns with high accuracy. To verify the feasibility of our method, it was applied to a series of international migration networks. We found that the derived node attractions were highly correlated with socioeconomic factors and network metrics, and the calculated node positions outperformed the geometric centers from the perspective of human migration that related to economy and demography. Our approach could be a preferred choice to investigate the spatial–temporal interactive patterns in geographical space, facilitating comprehension of the mechanisms underlying their generation and evolution.
Sustainable Development Goal (SDG) 11 aims to promote a more livable urban environment for humanity. However, the rapid global urbanization process has exerted significant pressure on urban environment, posing challenges for many cities to achieve this target. The urbanization process within urban agglomeration is accompanied by rapid and diverse land use change. Exploring the relationship between land use change and environmental factors is crucial for achieving sustainable urban development. To address this issue, this study investigates the interactive relationship between pixel-scale land use change and environmental indicators (CO2, Land Surface Temperature, and PM2.5) in China's three major urban agglomerations from 2000 to 2020. This study aims to analyze major land use change patterns, explore intrinsic connections among environmental indicators, and assess the impact of land use change on these indicators. The findings show that cropland, forestland, and built-up land are the major types of land change in all three urban agglomerations. Regions characterized by high population density, heavy industry, and intense transportation exhibit more pollutant emissions. Rapid urban construction has resulted in different types of environmental degradation issues. This study provides a comprehensive examination of the relationship between urbanization and environmental issues.
Natural gas has been widely recognized as an economic and environmental-friendly alternative fuel in the transport sector. Many cities have implemented the policy to encourage taxis to replace gasoline with natural gas. However, few studies have comprehensively evaluated its energy-environmental-economic benefits (i.e., providing alternative energy, producing less CO2 emissions and saving fuel costs). To fill the gap, this study proposes a new multi-task deep-learning-based microscopic model for estimating vehicular carbon dioxide (CO2) emissions and fuel consumption simultaneously under natural gas and gasoline usage scenarios. Trajectories of 14,534 taxis are collected for empirical studies. Model validation results show that the proposed model outperforms five state-of-the-art baselines and achieves a very high accuracy of CO2 emission and fuel consumption estimations. Empirical results found that taxis replacing gasoline with natural gas can reduce CO2 emissions by 22.1% and reduce fuel costs by 38.3%. The results of this study have several methodological and policy implications for using natural gas in the transport sector.
In recent decades, Digital transformation has significantly shifted human activities from physical space to cyber space. When users access the internet, uniform resource locator (URL) data are autogenerated. Using URLs, this study presents a novel framework for exploring cyber space structure from the perspectives of complex networks and activity fragmentation. Web domains within URL data are metaphorically regarded as 'digital locations,' and consecutive digital locations form 'cyber trajectories.' Human activities that occur at digital locations are semantically labeled and used to generate activity-based motifs. Motifs are defined as frequently occurring processes in cyber trajectories. Based on this, three network types are constructed: Global cyber human activity network, including all trajectories, and space-dependent and motif-dependent cyber human activity networks, focusing on specific regions and motifs. A case study conducted in Jilin, China, using approximately 4.3 gigabytes of URL data, revealed: 1) Cyber human activity patterns exhibit strong regularity and clustering of several types, with metropolitan regions favoring simpler patterns; 2) Cyber human activity networks demonstrate heavy-tailed and hierarchically polycentric structures; 3) The importance of websites in information dissemination increases super linearly along with their increased connectivity. This work deepens our understanding of cyber space functionality, offering insights into cyber information propagation.
The image recognition of the main components of electric power towers is a primary focus of UAV inspec-tions,as accurately identifying these tower components holds significant value for ensuring the smooth operation of power grids.To address this need,the paper proposes a method for recognizing the main components of electric power towers based on deep learning and knowledge graph.Firstly,the paper establishes topological relationships between component types,forming a spatial knowledge graph of the towers.Subsequently,it designs a model for se-mantic relationship inference that integrates semantic features of components with their topological relationships,re-sulting in feature enhancement.Finally,by concatenating these enhanced features with the original features,feature fusion is achieved.Experimental results demonstrate that the proposed method outperforms Reasoning-RCNN,Cascade-RCNN,and Faster-RCNN in the multi-target recognition of unstrung towers.It enables precise recognition of the main tower components,thus offering valuable insights for UAV-based power line inspections.
Accurate evaluation of food accessibility is the prerequisite for developing sustainable food policies. Most existing studies have evaluated food accessibility by setting a single service area size for all food retailers across a study area. In reality, service area sizes can vary significantly among different types of food retailers in different geographical regions, thus forming a retailer hierarchy. In this study, we propose a new machine learning method to delineate service areas and hierarchical levels for all food retailers in a large study area. Based on the proposed method, a comprehensive case study of 79,419 food retailers was carried out in Wuhan, China. This study revealed three hierarchical levels of food retailers in Wuhan. Retailers at higher positions in the hierarchy had fewer entities but larger service areas. The hierarchical levels of food retailers can be accurately determined by fifteen attractiveness factors. These results underscore the dominant role of middle- and upper-level retailers in determining food accessibility; that is, they accounted for only 6.9 percent of total retailers but contributed to 96.3 percent of total accessibility. Ignoring the hierarchical structure of food retailers will introduce significant bias in food accessibility evaluations.
User equilibrium (UE) has long been regarded as the cornerstone of transport planning studies. Despite its fundamental importance, our understanding of the actual UE state of road networks has remained surprisingly incomplete. Using big datasets of taxi trajectories, this study investigates the UE states of road networks in two Chinese mega-cities, i.e., Wuhan and Shenzhen. Effective indicators, namely relative gaps, are introduced to quantify how actual traffic states deviate from theoretical UE states. Advanced machine learning techniques, including XGBoost and SHAP values, are employed to analyze nonlinear relationships between network disequilibrium states and seven influencing factors extracted from trajectory data. The results in these two study areas reveal consistent and significant gaps between actual traffic states and the theoretical UE states at various times of the day during both weekdays and weekends. The XGBoost analysis shows that differences in travel distances, travel speeds, and signalized intersection numbers among alternative routes are the primary causes of road network disequilibrium. The results of this study could present several important methodological and policy implications for using the UE models in transport applications.
How to select a suitable spatial weighting scheme for convolutional graph neural networks (ConvGNNs) is challenging. In this study, we propose a ConvGNN, termed learnable graph convolutional (LGC) network, which learns spatial weightings between a road and its k-hop neighbours as learnable parameters in the spatial convolutional operator. A dynamic LGC (DLGC) network is further proposed to learn the dynamics of spatial weightings by explicitly considering the temporal correlations of spatial weightings at different times of the day. A multi-temporal DLGC (MTDLGC) network is developed for forecasting traffic variables in road networks. Results of case study suggest that the MT-DLGC network can achieve higher prediction accuracy than other state-of-the-art baselines. Both LGC and DLGC networks can be used as general spatial weighting schemes for baselines with better forecasting performance than existing spatial weighting schemes, e.g., graph attention. The source code of this study is available publicly at https://github.com/Mayaohong/MTDLGC.
Prediction of short-term traffic flow has been examined recently, but little attention has been paid to the prediction of citywide turning traffic flow at intersections. Based on an in-depth analysis of turning traffic flow patterns, we propose a novel attention-based spatiotemporal deep learning model to predict citywide short-term turning traffic flow at road intersections with high accuracy. First, we examine the spatiotemporal patterns of turning traffic flow. Then, an end-to-end deep learning structure with four components is designed to model turning traffic flow. In our model, graph convolutional network is revised to learn spatial dependencies and sparseness, and gate recurrent unit network with an attention mechanism is developed to learn temporal dependencies and fluctuations. Experiments were conducted in Wuhan, China, where taxicab trajectory data were used to train and validate our model. The results suggest that our model outperforms current state-of-the-art models with higher accuracy on estimating turning traffic flow.
Previous studies have mainly focused on the independent role of landscape characteristics or preference on psychological restoration respectively. However, few studies have explored the complex relationships between restorative effects, landscape characteristics, preference and place bonding factors, particularly in urban parks. The development of new data environment and technique methods enables such a synthesis of innovative approach to reveal the influences of urban park characteristics and various psychological factors on collegers' perceived restoration. A typical urban park in Wuhan, China, was selected for pilot study, in which 1560 crowdsourced images were collected using the Public Participation Geographic Information System (PPGIS) tool. With the help of Deep Learning techniques, landscape characteristics were combined with perceptual factors for the Partial Least Squares (PLS) based statistical analysis. It was found that some landscape properties, such as vegetation and water, presented indirect impacts in activating restoration via psychological mediators. The mediating effect of sense of place and the moderating effects of landscape characteristics on the preference-restoration nexus were revealed. These findings shed new light on the complex process in environmental restoration in which psychological and physical factors are intertwined. At the end, theoretical and managerial implications were proposed for the improvement of landscape planning in restoration studies.
The availability of Spatiotemporal Big Data has provided a golden opportunity for time geographical studies that have long been constrained by the lack of individual-level data. However, how to store, manage, and query a huge number of time geographic entities effectively and efficiently with complex spatiotemporal characteristics and relationships poses a significant challenge to contemporary GIS platforms. In this article, a hierarchical compressed linear reference (CLR) model is proposed to transform network-constrained time geographic entities from three-dimensional (3D) (x, y, t) space into two-dimensional (2D) space. Accordingly, time geographic entities can be represented as 2D spatial entities and stored in a classical spatial database. The proposed CLR model supports a hierarchical linear reference system (LRS) including not only underlying a link-based LRS but also multiple higher-level route-based LRSs. In addition, an LRS-based spatiotemporal index structure is developed to index both time geographic entities and the corresponding hierarchical network. The results of computational experiments on large datasets of space-time paths and prisms show that the proposed hierarchical CLR model is effective at storing and managing time geographic entities in road networks. The developed index structure achieves satisfactory query performance in milliseconds on large datasets of time geographic entities.
采用k-Shape方法对公共自行车系统站点进行聚类,得到5种站点活动模式;叠加土地利用数据得到站点附近主要用地类型,结合站点活动模式可将站点划分为工作型、居住型、娱乐型、运输型站点;统计站点集群5个工作日内的及早晚高峰时段的流量转移,探究站点集群之间的流量转移模式.研究发现:①人们骑行以短途旅行为主;②早晚高峰流量转移呈现相反的流向;③早晚高峰时段发生的跨类别骑行行为,均是由于站点集群之间的临近站点带来的转移流量;④ 与早高峰时段不同,晚高峰时段流量转移呈现出独有的娱乐模式.
The order k Voronoi diagram (OkVD) is an effective geometric construction to partition the geographical space into a set of Voronoi regions such that all locations within a Voronoi region share the same k nearest points of interest (POIs). Despite the broad applications of OkVD in various geographical analysis, few efficient algorithms have been proposed to construct OkVD in real road networks. This study proposes a novel algorithm consisting of two stages. In the first stage, a new one-to-all k shortest path finding procedure is proposed to efficiently determine the shortest paths to k nearest POIs for each node. In the second stage, a new recursive procedure is introduced to effectively divide boundary links within different Voronoi regions using the hierarchical tessellation property of the OkVD. To demonstrate the applicability of the proposed OkVD construction algorithm, a case study of place-based accessibility evaluation is carried out. Computational experiments are also conducted on five real road networks with different sizes, and results show that the proposed OkVD algorithm performed significantly better than state-of-the-art algorithms.
Clustering the trajectories of vehicles moving on road networks is a key data mining technique for understanding human mobility patterns, as well as their interactions with urban environments. The development of efficient and scalable trajectory clustering algorithms, however, still faces challenges because of the computational costs when measuring similarities among a large number of network-constrained trajectories. To address this problem, a novel trajectory clustering framework based on the well-developed Density-Based Spatial Clustering of Applications with Noise (DBSCAN) approach is proposed. This proposed framework accurately quantifies similarities using a trajectory representation of continuous polylines in the space and time dimensions, and does not require trajectory discretization. Further, the proposed framework utilizes the space-time buffering concept to formulate e-neighborhood queries that directly retrieve the e-neighbors of trajectories and thus avoids computing a trajectory similarity matrix. State-of-the-art trajectory databases and index structures are incorporated to further improve trajectory clustering performance. A comprehensive case study was carried out using an open dataset of 20,161 trajectories. Results show that the proposed framework efficiently executed trajectory clustering on the large test dataset within 3 min. This was approximately 2,700 times faster than existing DBSCAN algorithms.
 Xin Li (李欣)合作论文数School of Civil Engineering and Architecture, Guangxi University14
 Bi Yu Chen (陈碧宇)合作论文数State Key Laboratory of Information Engineering in Surveying, Mapping and Remote Sensing, Wuhan University10
 Bin Jiang (江斌)合作论文数LivableCityLAB, Society Hub, The Hong Kong University of Science and Technology (Guangzhou)10
 Kun Qin (秦昆)合作论文数School of Remote Sensing Information Engineering, Wuhan University9
 Xuesong Yu (喻雪松)合作论文数8
 Hui-Ping Chen合作论文数State Key Laboratory of Information Engineering in Surveying, Mapping and Remote Sensing, Wuhan University, Wuhan 430079, China6
 Xintao Liu合作论文数Hong Kong Polytech Univ, Dept Land Surveying & Geoinformat, Hong Kong, Peoples R China5
 Kenneth Carling合作论文数Institute for Labour Market Policy Evaluation (IFAU), Kyrkogardsgatan 6, PO Box 513, SE-751 20 Uppsala, Sweden4
 Johan Hakansson合作论文数Science and Technology4Xuan-Yan Chen合作论文数3
 Penggao Yan合作论文数School of Remote Sensing and Information Engineering, Wuhan University3Kai Chen合作论文数3
 Wenzhong Shi (史文中)合作论文数Department of Land Surveying and Geo-Informatics, Faculty of Construction and Environment, Hong Kong Polytechnic University3
 Jianya Gong (龚健雅)合作论文数School of Remote Sensing and Information Engineering, Wuhan University;State Key Laboratory of Information Engineering in Surveying, Mapping and Remote Sensing, Wuhan University3
 Yuliang Zou (邹宇量)合作论文数School of Public Health, Wuhan University3
 Ling Zhu (朱凌)合作论文数北京建筑大学3Chenxi Cai合作论文数2Yu-Bo Luo (骆钰波)合作论文数2
 Lin Zhou (周麟)合作论文数School of Public Administration and Policy, Renmin University of China2
 Qili Gao (高琦丽)合作论文数Weizhong College of Financial Technology, Shenzhen University;Shenzhen Audencia Financial Technology Institute2Xiongwu Fu合作论文数2
 Wenxuan Liu合作论文数College of Computer Science and Technology, Wuhan University of Technology, Hubei, China2Chengkun Liu合作论文数2
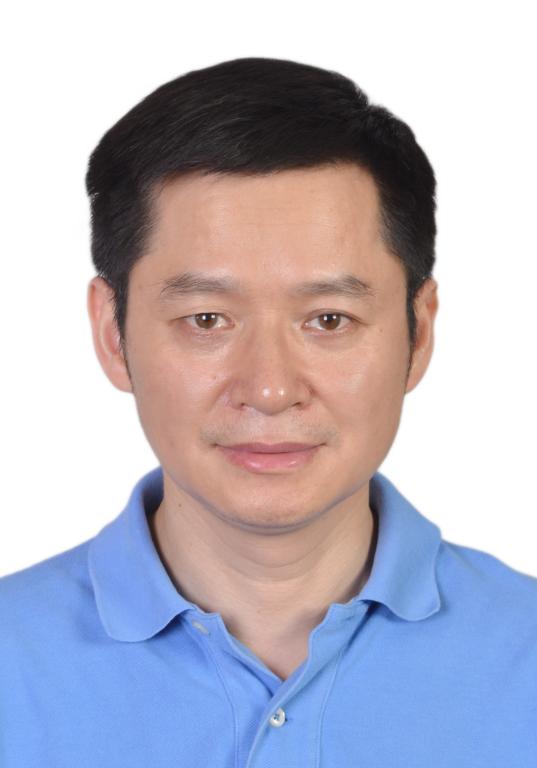 Hongbing Tao (陶红兵)合作论文数School of Medicine and Health Management, Tongji Medical College, Huazhong University of Science and Technology2
 Rui Xiao (肖锐)合作论文数School of Remote Sensing Information Engineering, Wuhan University2
 William Hing Keung Lam (林興強)合作论文数Department of Civil & Environmental Engineering, Faculty of Construction and Environment, The Hong Kong Polytechnic University2
 Jiye Wang (王继业)合作论文数State Grid Digital Technology Holding Co.,Ltd2
 Qing-Quan Li (李清泉)合作论文数Shenzhen University;The Chinese University of Hong Kong, Shenzhen2
 Yang Xu (徐陽)合作论文数Department of Land Surveying and Geo-Informatics, The Hong Kong Polytechnic University2
 Yulong Wang (王玉龙)合作论文数武汉大学印刷与包装系2
 Donggen Wang (王冬根)合作论文数Department of Geography, Faculty of Social Sciences, Hong Kong Baptist University2SHAN Jie (单杰)合作论文数1Minglei Liao合作论文数1Wenxin Teng合作论文数1Chinzorig Sukhbaatar合作论文数1Yixuan La合作论文数1Dejun Gao合作论文数1Jiale Wang合作论文数1Xiaojun Shan合作论文数1Hanyu Yin合作论文数1Guojiang Yu合作论文数1Yaohong Ma合作论文数1Xinyi Li合作论文数1Qi Liu合作论文数1Wenfang Tan合作论文数1Jingyi Zhang合作论文数1GANG Shen-ting (刚什婷)合作论文数1Qi Li合作论文数1




