The 3D real scene models can vividly and intuitively represent various aspects of urban information. These models have been applied in multiple fields. However, a quantitative review of the development status and trends in 3D real scene modelling research is still scarce. To address this gap, this study performed a bibliometric analysis. We analysed 3701 research articles indexed in the Web of Science Core Collection from 2005 to 2024. We used bibliometric tools including Bibliometrix, COOC software, and CiteSpace to investigate the research status and hotspots in the 3D real scene modelling field. We also identified the current gaps and strengths. In addition, we discuss future research priorities and development directions. The results revealed the following: 1) Key Research Topics: The primary research focuses include these areas: point cloud, virtual reality, 3D reconstruction, cluttered scene, constraint-free view-based 3D object retrieval, neural radiance field, and textured urban model. 2) Growth Trends: Research interest in 3D real scene modelling has rapidly grown since 2019 and continues to expand. Technologies such as deep learning have played an increasingly significant role. Emerging directions, such as AI-assisted modelling and the integration of the metaverse, have recently become prominent. 3) Highly Cited Papers: Highly cited studies primarily focus on topics such as deep learning algorithms and neural radiance field. This review systematically outlines the development trajectory of 3D real scene modelling research and provides valuable references for future studies and applications.
The remote sensing ecological index (RSEI) serves as a pivotal metric for evaluating the regional ecological environment quality (EEQ). Nevertheless, accurately quantifying and identifying its response to multi-factor coupling remain a considerable challenge. Therefore, in this study, an improved Remote Sensing Ecological Index with Local Adaptability (RSEILA) method was employed to analyze the EEQ’s spatiotemporal distribution pattern using the Google Earth Engine platform. Then, the Geodetector model was employed to identify the driving mechanisms responsible for EEQ variation under multi-factor coupling. The results show the following: (1) Over the past two decades, the EEQ has consistently achieved moderate to good levels and has exhibited an overall trend of improvement. (2) At the spatial scale, the distribution pattern of the RSEILA in Anhui Province was characterized by high values in the south and low values in the north, which was closely associated with the natural geographic conditions and land use patterns. (3) Multi-factor coupling exerted a significant spatiotemporal scale effect on the drivers of EEQ levels. At the temporal scale, EEQ levels were predominantly influenced by policy measures, while spatially topography and human activities were identified as the primary drivers of the EEQ changes. The findings of this research provide a theoretical foundation for enhancement and administration of the EEQ in Anhui Province and analogous regions.
The integration of Ice, Cloud, and Land Elevation Satellite-2 (ICESat-2) data with Optical Photogrammetric Satellite Stereo Imagery (OPSSI) for Block Adjustment (BA) has emerged as a novel approach for generating large-area, high-accuracy Digital Elevation Models (DEMs). However, owing to the discrepancies between these two data platforms and the systematic errors of their sensors, errors arise in the BA fusion outcomes during the matching process of the two datasets. To tackle this issue, this paper proposes a method aimed at enhancing the accuracy of the BA process. Initially, the multi-characteristic constraint is used to filter the ICESat-2 ATL08 product to obtain control points and check points. Subsequently, the Terrain Matching Correction is applied to control points, and then integrated with the GF-7 OPSSI for BA to generate DEM. Ultimately, the check points are employed to assess the accuracy of the established DEM. Experiments in a 2,000 km2 test area in the Wuding River Basin show that: (1) The inclusion of ICESat-2 data has remarkably enhanced the accuracy of DEM modeling utilizing GF-7 OPSSI, and the Root Mean Square Error (RMSE) has been reduced from the range of 5-10 m to 2-6 m. (2) Multi-characteristic constraint filtering is crucial for the identification of high quality ICESat-2 control points in flat and low relief areas. When implementing this filtering method, the established criteria should comprehensively consider both the quantity and the spatial distribution of control points to ensure optimal results. (3) Terrain Matching Correction on ICESat-2 data has effectively elevated the vertical accuracy of DEM modeling, particularly in regions with flat terrain. The RMSE of the vertical accuracy in such areas can be decreased by 1-3 m. In summary, the integration of spaceborne laser altimeter data with OPSSI holds immense significance for the production of large-scale and high-accuracy DEMs, offering a promising solution for terrain modeling and analysis on regional scales.
This study aims to predict the carbon sequestration capacity of Chinese grasslands to address climate change and achieve carbon neutrality goals. Grassland carbon sequestration is a crucial part of the global carbon cycle. However, its capacity is significantly impacted by climate change and human activities, making its dynamic changes complex and challenging to predict. This study adopts a fractional-order accumulation grey model, using 11 provinces in China as samples, to analyze and forecast grassland carbon sequestration. The study finds significant differences in grassland carbon sequestration trends across the sample regions. The carbon sequestration capacity of the grasslands in Xizang (Tibet) and Heilongjiang province is increasing, while it is decreasing in other provinces. The varying prediction results are influenced not only by regional climatic and natural conditions, but also by human interventions such as overgrazing, irrational reclamation, excessive mineral resource exploitation, and increased tourism development. Therefore, more region-specific grassland management and protection strategies should be formulated to enhance the carbon sequestration capacity of grasslands and promote the sustainable development of ecosystems. The significance of this study lies not only in providing scientific guidance for the protection and sustainable management of Chinese grasslands, but also in contributing theoretical and practical insights into global carbon sequestration strategies.
A new digital elevation model (DEM) upscaling method based on high accuracy surface modeling (HASM) is proposed by combining the elevation information of DEM and the valley lines extracted from DEM with different flow accumulation thresholds. The proposed method has several advantages over traditional DEM upscaling methods. First, the HASM ensures the smoothness of the upscaled DEM. Secondly, several DEMs with different topographic details can be obtained using the same DEM grid size by incorporating the valley lines with different flow accumulation thresholds. The Jiuyuangou watershed in China’s Loess Plateau was used as a case study. A DEM with a grid size of 5 m obtained from the local surveying and mapping department was used to verify the proposed DEM upscaling method. We established the surface complexity index to describe the complexity of the topographic surface and quantified the differences in the topographic features obtained from different upscaling results. The results show that topography becomes more generalized as grid size and flow accumulation threshold increase. At a large DEM grid size, an increase in the flow accumulation threshold increases the difference in elevation values in different grids, increasing the surface complexity index. This study provides a new DEM upscaling method suitable for quantifying topography.
High-precision digital elevation models (DEMs) are the basic data for constructing digital cities. With the acceleration of urbanization, the topography of urban plots is constantly transformed by human activities, so that surface morphology shows the characteristics of diversification and discontinuity. Existing modelling methods focus on the expression of continuous terrain. Constructing high-precision DEM in urban plots is still challenging. A block-based modelling method that considers the morphological characteristics of urban plot elements was proposed. The Jinzhai County urban area was selected as the research area. The elements of urban plots were classified into six types, in which the boundaries and elevation information were extracted with real sense 3D models, Digital Orthophoto Maps (DOMs) and dense matching point cloud data. The DEMs of the 6 types of elements were generated separately with different methods, that are fused to complete the DEM of urban plots. The DEM obtained using the method in this manuscript was consistent with the reality in terms of topographic relief within each element and clarified the boundary of each element. The accuracy assessment showed that the RMSE results of roads, slopes, other terrains and natural terrains are approximately 0.05 m, which meets the elevation accuracy requirements of the 1:1000 large-scale mapping.
The automatic extraction of gullies from digital elevation models(DEMs)has great application value in GIS and hydrology.Many types of algorithms have been developed to address this problem,and the well-known D8(Deterministic eight-node)algorithm has been widely applied and implemented in some commercial GIS software such as ArcGIS.However,a key parameter called flow accumulation threshold(FAT)must be determined in this process.Numerous studies focus on how to determine an optimal value for this parameter but ignore that the optimal threshold varies for different gullies,so the universality of a different optimal threshold parameter determined by different methods is poor.To address this problem,this study designs a parameter called surface concavity index(SC-index)that can describe the shape of gullies from the perspective of surface morphology.Based on this index,the positions of different gullies'heads are identified,and then the flow accumulation matrix calculated by the D8 algorithm is used as auxiliary data to extract the gully network in the research area.In this study,six small watersheds in the Loess Plateau in northern Shaanxi,China,were used as test areas to verify the validity of the proposed method in areas with various landform types.Experimental results show that gully heads in different test areas can be effectively identified by setting different SC-index thresholds that are related to the types of terrain in the test areas.Then,the entire gully network can be extracted in watersheds with the help of a D8 algorithm.The accuracy of the gully network extracted by the new method is better than the contrast method in all test areas.In test areas with a large area of flat land(e.g.,Chunhua),the difference between the total length of gullies extracted by the new method and the reference value is-2.77 km,while the corresponding value of the contrast method is 14.50 km.In test areas with large numbers of short gullies(e.g.,Jiuyuangou),the difference between the total length of gullies extracted by the new method and the reference value is-2.61 km while the corresponding value of the contrast method is-27.9 km.It is pointed out that the new method can not only avoid the extraction of pseudo gullies,but also extract short gullies effectively.Further experimental analysis shows that the dependence of the new method on DEM resolution is significantly weaker than that of the contrast method.Taking Jiuyuangou test area as an example,when the DEM cell size increases from 5 m to 30 m,the total length of gullies extracted by the new method changes only about 1 km,while the corresponding value of the contrast method exceeds 20 km.
The topographic skeleton is the primary expression and intuitive understanding of topographic relief. This study integrated a topographic skeleton into deep learning for terrain reconstruction. Firstly, a topographic skeleton, such as valley, ridge, and gully lines, was extracted from a global digital elevation model (GDEM) and Google Earth Image (GEI). Then, the Conditional Generative Adversarial Network (CGAN) was used to learn the elevation sequence information between the topographic skeleton and high-precision 5 m DEMs. Thirdly, different combinations of topographic skeletons extracted from 5 m, 12.5 m, and 30 m DEMs and a 1 m GEI were compared for reconstructing 5 m DEMs. The results show the following: (1) from the perspective of the visual effect, the 5 m DEMs generated with the three combinations (5 m DEM + 1 m GEI, 12.5 m DEM + 1 m GEI, and 30 m DEM + 1 m GEI) were all similar to the original 5 m DEM (reference data), which provides a markedly increased level of terrain detail information when compared to the traditional interpolation methods; (2) from the perspective of elevation accuracy, the 5 m DEMs reconstructed by the three combinations have a high correlation (>0.9) with the reference data, while the vertical accuracy of the 12.5 m DEM + 1 m GEI combination is obviously higher than that of the 30 m DEM + 1 m GEI combination; and (3) from the perspective of topographic factors, the distribution trends of the reconstructed 5 m DEMs are all close to the reference data in terms of the extracted slope and aspect. This study enhances the quality of open-source DEMs and introduces innovative ideas for producing high-precision DEMs. Among the three combinations, we recommend the 12.5 m DEM + 1 m GEI combination for DEM reconstruction due to its relative high accuracy and open access. In regions where a field survey of high-precision DEMs is difficult, open-source DEMs combined with GEI can be used in high-precision DEM reconstruction.
Aiming at the problems of over-segmentation, under-segmentation and low accuracy of existing point cloud filtering methods in dense low vegetation areas, a filtering method based on the multi-scale elevation variation coefficient is proposed according to the different terrain features expressed by UAV image matching point cloud data at different scales.Firstly, digital surface models(DSMs) with various resolutions are built using hierarchical virtual grids.Diverse topography elements are captured by digital surface models at different scales.Secondly, the difference of the DSMs(DoD) is obtained by subtraction operation for multi-scale DSM.Thirdly, the elevation variation coefficient(EVC) of DoD is calculated, and the threshold segmentation is performed according to the feature that the elevation variation coefficient of the boundary area is much larger than that of the terrain area.Finally, the optimal neighborhood radius for calculating the EVC and the optimal segmentation threshold for EVC are analyzed.The results show that the proposed method can accurately remove vegetation points and retain ground points in dense low vegetation areas, and the type I error, type II error, and average total error are 9.20%,5.83%,and 7.68%,respectively.The result proves that the proposed method is superior to cloth simulated filtering(CSF),triangulated irregular network(TIN) and progressive morphological filtering algorithm.It can lay a foundation for the rapid construction of high-precision DTM in the later stage.
A peak is an important topographic feature crucial in quantitative geomorphic feature analysis,digital geomorphological mapping,and other fields.Most peak extraction methods are based on the maximum elevation in a local area but ignore the morphological characteristics of the peak area.This paper proposes three indices based on the morphological characteristics of peaks and their spatial relationship with ridge lines:convexity mean index(CM-index),convexity standard deviation(CSD-index),and convexity imbalance index(CIB-index).We develop computation methods to extract peaks from digital elevation model(DEM).Subsequently,the initial peaks extracted by neighborhood statistics are classified using the proposed indices.The method is evaluated in the Qinghai Tibet Plateau and the Loess Plateau in China.An ASTER Global DEM(ASTGTM2 DEM)with a grid size of 30 m is chosen to assess the suitability of the proposed mountain peak extraction and classification method in different geomorphic regions.DEM data with grid sizes of 30 m and 5 m are used for the Loess Plateau.The mountain peak extraction and classification results obtained from the different resolution DEM are compared.The experimental results show that:(1)The CM-index and the CSD-index accurately reflect the concave or convex morphology of the surface and can be used as supplements to existing surface morphological indices.(2)The three indices can identify pseudo mountain peaks and classify the remaining peaks into single ridge peak(SR-Peak)and multiple ridge intersection peak(MRI-Peak).The visual inspection results show that the classification accuracy in the different study areas exceeds 75%.(3)The number of peaks is significantly higher for the 5 m DEM than for the 30 m DEM because more peaks can be detected at a finer resolution.
无人机发展迅速,已经在地球科学领域得到了广泛应用.前人以中误差(root mean square error,RMSE)为精度评价指标对影响无人机摄影测量精度的各类因素进行了大量研究.但是,基于无人机摄影测量的地形建模误差往往空间上变化分布,中误差无法反映误差的空间分布特征.因此,本文从误差空间分布的视角出发,通过计算误差空间分布图、误差的莫兰指数、样区整体的平均误差和标准误差,分析了相机倾角、航高和控制点数量对地形建模高程误差的大小及空间分布的影响.在黄土高原两个小流域的实验结果表明:(1)在无控制测量的情况下,误差受相机倾角的影响较大,采用较大角度的倾斜摄影不仅可以降低整体误差,还能改善误差的空间分布,减少误差的空间自相关性.(2)航高方面,尽管航高(60~160 m)变高会增大误差,但是航高对误差的空间分布影响不大.(3)在有控制测量的情况下,控制点的使用不仅降低了整体误差也优化了误差空间分布.在整体误差方面,使用少量的控制点即能达到一个稳定的精度水平.但此时,误差的空间分布还可以继续优化,要使样区的误差空间分布达到稳定的水平,需要相对较多的控制点.本研究为使用消费级无人机进行地形建模提供了有益的参考,在实际应用中可根据本文的结论优化航线设计方案和控制点布设.
Extracting a channel network based on the Digital Elevation Model (DEM) is one of the key research topics in digital terrain analysis. However, when the channel area is wide and flat, it is easy to form parallel channels, which seriously affect the accuracy of channel network extraction. To solve this problem, this study proposes a method to identify and eliminate parallel channels extracted by classical methods. First, the channel level in the study area is marked based on the flow accumulation data, and the parallel channels are then identified using the positional relationship between the different channel levels. Finally, the modification point of the identified parallel channels is determined to eliminate the parallel channels, with the help of the change relationship between the parallel channel and its upper-level channel. In this study, two watersheds in southeast China are selected as examples for method verification and analysis. Experimental results show that the parallel channel identification method proposed in this paper can accurately identify all parallel channels and eliminate the identified parallel channels one by one. The location relationship of the modified channels is consistent with the actual situation, indicating that the proposed method has good application potential in DEM-based channel extraction networks.
无人机倾斜摄影三维模型的精度是衡量模型质量好坏的重要指标.常规的倾斜摄影三维建模需要先布设像控点,作业效率低且维护成本高.无像控建模不需要布设像控点,航测效率高,但精度较低.本文以南京信息工程大学东苑为实验区,研究了 一种像控后处理倾斜摄影三维建模方法.结果表明:1)基于像控后处理建立的三维模型与常规方法建立的三维模型精度基本相同,平面中误差、高程中误差均小于0.05 m,满足高效率、高精度、低成本的建模要求;2)像控后处理建模避免了制作和维护像控点的过程,同时基于已有高精度三维模型选择像控点并提取坐标,提升了像控点选择的科学性并降低了外业测点的工作量;3)该方法在城市、乡镇及其他道路丰富地区高精度三维实景模型定期更新上具有较好的普适性.
基于数字高程模型(Digital Elevation Model,DEM)的地形变化检测方法易受DEM空间分辨率效应的影响.基于两期DEM相减的地形变化检测研究,目前仍缺乏其对空间分辨率影响的讨论.本文利用两个典型地形变化的实验样区,以实测点云数据作为数据源,使用两类5种方式(点云重采样方式3种,DEM重采样方式2种)构建不同空间分辨率的DEM数据,并在不同空间分辨率下使用不同的操作顺序进行地形变化检测;通过平均误差、标准误差、莫兰指数等多个指标探索DEM空间分辨率对地形变化检测的影响.实验结果表明:(1)DEM空间分辨率对地形变化检测的影响与多空间分辨率DEM的生成方式有关,使用双线性插值法的平均误差、标准误差、莫兰指数均最小,其不仅能有效降低地形变化检测的误差,同时还能优化误差的空间分布.(2)不同的多空间分辨率DEM生成方式得到的分辨率效应的整体趋势基本一致,即空间分辨率变粗,地形变化检测结果的整体偏差和局部偏差均变大,误差的空间自相关性也越来越强,并且误差和空间分辨率之间存在一定的线性关系.(3)地形变化检测和升尺度操作的先后顺序并不影响检测结果,即先对DEM重采样后进行变化检测的结果和先进行地形变化检测再对地形变化进行重采样的结果一致.本研究可为地形变化检测时DEM的生成方式、空间分辨率的选择以及地形变化检测的操作顺序提供参考.
如何使用少量的地形特征复原地形地貌一直为地学领域的难题.本文使用开源数据集提取地形特征要素,使用地形特征要素作为约束条件构建了用于生成DEM的条件生成对抗网络(Conditional Generative Adversarial Networks,CGAN),设计了基于开源DEM、开源DEM与遥感影像组合、以及5m高精度DEM提取地形特征要素生成DEM的对比实验,并对结果进行视觉效果、相关性分析以及地形因子的对比与评价.结果表明:①在视觉效果上,3种不同方式生成的DEM在视觉效果上均十分逼近原始5 m DEM,都远好于传统插值方法生成DEM,基于开源12.5m DEM提取要素和1m遥感影像的重建效果最接近于原始5 m DEM;②在相关性上,三种不同方式生成的DEM与原始5m DEM相关性均能达到0.75以上,组合开源数据提取要素重建DEM与原始5 m DEM相关性可达到0.85以上;③在地形因子方面,基于开源12.5 m DEM和1 m遥感影像提取要素重建DEM的坡度和坡向的分布趋势与原始5 m DEM最为一致.本文为高精度DEM建模提供了新的思路,在高精度DEM难以获取的区域,可以利用开源数据集和条件生成对抗网络进行高精度地形建模,从而进行地学分析和地理模拟等.
针对消费级无人机相机单一、镜头畸变大,地形建模精度受航线设计和控制测量的影响等问题,设计了不同的数据采集方案和控制点蒙特卡罗检验,分析了相机倾角、航高和控制点数量对地形建模精度的影响.在黄土高原3 个典型小流域的实验结果表明:①在进行无人机摄影测量数据处理时,应先使用蒙特卡罗检验对控制点质量进行分析,排除控制点误差再进行数据处理.②相机倾角方面,在无地面控制点时,采用较大角度的倾斜摄影不仅有利于提高样区整体精度,还优化了误差的空间分布;这与相机畸变模型的优化有关.在有地面控制点时,相机倾角对高程精度的影响不大,但是影响控制点饱和数量;相对于垂直摄影,倾斜摄影需要略多的控制点才能达到最优精度.③航高方面,在有地面控制点时,使用倾斜摄影有利于降低高程精度对航高变化的敏感性.在有地面控制点时,航高在60~160 m范围内对高程精度的影响不明显,且航高变化不影响控制点饱和数量.
Land use and land cover (LULC) change is a pattern of alteration of the Earth’s land surface cover by human society and have a significant impact on the terrestrial carbon cycle. Optimizing the distribution of LULC is critical for the redistribution of land resources, the management of carbon storage in terrestrial ecosystems, and global climate change. We integrated the patch-generating land use simulation (PLUS) model and integrated valuation of ecosystem services and trade-offs (InVEST) model to simulate and assess future LULC and ecosystem carbon storage in the Nanjing metropolitan circle in 2030 under four scenarios: natural development (ND), economic development (ED), ecological protection (EP), and collaborative development (CD). The results showed that (1) LULC and carbon storage distribution were spatially heterogenous in the Nanjing metropolitan circle for the different scenarios, with elevation, nighttime lights, and population being the main driving factors of LULC changes; (2) the Nanjing metropolitan circle will experience a carbon increase of 0.50 Tg by 2030 under the EP scenario and losses of 1.74, 3.56, and 0.48 Tg under the ND, ED, and CD scenarios, respectively; and (3) the CD scenario is the most suitable for the development of the Nanjing metropolitan circle because it balances ED and EP. Overall, this study reveals the effects of different development scenarios on LULC and ecosystem carbon storage, and can provide a reference for policymakers and stakeholders to determine the development patterns of metropolitan areas under a dual carbon target orientation.
黄土陷穴作为黄土高原地区一种特殊的地貌类型及地质灾害,其研究对指导黄土地区水土保持与工程建设工作具有重要意义.现阶段对陷穴的研究多基于传统野外调查,该方式成本高、效率低.为此,该研究开展面向对象与卷积神经网络(Convolutional Neural Networks,CNN)相结合的黄土陷穴自动化提取方法研究,并讨论融合地形特征对CNN模型提取精度的影响.研究选取黄土陷穴发育的典型区域,基于WorldView3遥感数据与ALOS高程数据,通过莫兰指数与灰度共生矩阵熵值确定影像的分割尺度,以面向对象的方式提取黄土陷穴的光谱、形状、纹理以及地形特征,制作融合地形特征与未融合地形特征的两类训练样本,进而训练两种CNN模型对同一区域内黄土陷穴进行提取,根据精确率、召回率以及F1分数评价模型的提取精度、分析对比两种CNN模型的提取结果,并建立支持向量机(Support Vector Machine,SVM)模型与CNN模型进行比较.研究结果表明,融合地形特征进行训练的CNN模型精确率达94.62%,召回率达86.27%、F1分数达90.26%,综合提取性能最好,相较于未融合地形特征训练的CNN模型,黄土陷穴的错分量大大减少,精确率提升18.10个百分点,F1分数提升9.15个百分点;两种CNN模型F1分数均达80%以上,比SVM模型分别高出6.94个百分点,16.09个百分点,提取结果均优于SVM模型;综上,融合地形特征的CNN模型可快速、精确地提取黄土陷穴,从而为黄土地区陷穴防治工作提供支持.
为支撑我国地理信息产业迅速扩张和顺应新技术发展趋势,解决满足行业需求的地理信息科学人才紧缺的问题,本文针对当前应用型人才培养模式存在的主要问题,结合"双万计划"专业建设要求和滁州学院地理信息科学专业的办学实际,从课程体系改革、实践教学体系创新、质量标准体系建设等方面入手,探索构建产教协同地理信息科学一流应用型专业人才培养模式,并从与企业深入交流、校企合作人才培养、产教协同实践教学平台建设等方面开展实践,阐述了近5年人才培养实践效果,为我国GIS专业一流应用型人才培养提供了有效参考.
当前数字高程模型(DEM)无法有效表达突变地形真实地表形态,严重制约了突变地形DEM在这些区域的应用.本文选取南京市某一区域为研究区,对特征线分别采用建模可用高程点加密法和平行特征线法,在特征线处理参与的情况下,建立分辨率为1 m规则格网DEM进行对比分析,验证不同方法在突变地形处DEM构建效果.实验结果表明,本研究两种思路构建的DEM与传统DEM相比,无论是高程精度还是形态精度都具有明显的优势.在突变地形两侧高程信息突变不明显的情况下,传统构建法和建模可用高程点加密法平均误差相接近,平行特征线法平均误差仅0.42 m;地形复杂的区域,传统构建法和建模可用高程点加密法平均误差均超过1 m,平行特征线法平均误差仅0.94 m,高程精度验证结果理想.研究表明,无论是地形相对简单的区域还是地形复杂的区域,平行特征线法构建突变地形效果更优.
 Ling Jiang合作论文数31
 Guoan Tang (汤国安)合作论文数School of Geography, Nanjing Normal University30
 Mingwei Zhao合作论文数22
 Wen Dai合作论文数Sch Geog Sci, Nanjing Univ Informat Sci Technol17WeiTao Li (李伟涛)合作论文数12LiuWan Gu (顾留碗)合作论文数12Cancan Yang合作论文数10Tai-Sheng Chen合作论文数9
 Xin Yang (杨昕)合作论文数School of Geography, Nanjing Normal University;Key Laboratory of Virtual Geographic Environment, Ministry of Education, Nanjing Normal University8Yan Xu合作论文数7Yan XU (徐燕)合作论文数6JingLu Sun (孙京禄)合作论文数6Ting Zhang (张婷)合作论文数6
 Fayuan Li (李发源)合作论文数School of Geography, Nanjing Normal University6Shibao Dai (戴仕宝)合作论文数5Jing Wang (王靖)合作论文数5Xiaoxiao Ju (居肖肖)合作论文数4Xiaoli Huang (黄骁力)合作论文数4LI Min (李敏)合作论文数4Liang-chao WU (吴良超)合作论文数4Ni Wang (王妮)合作论文数4
 Aili Liu (刘爱利)合作论文数Nanjing University of Information Science & Technology4
 Xuejun Liu (刘学军)合作论文数School of Geography, Nanjing Normal University4Peng Li (李鹏)合作论文数4Jiaxin Fan (范佳鑫)合作论文数3WU Fuzhu (吴复柱)合作论文数3ZHAO Yuanyuan (赵元元)合作论文数3
 Min Li合作论文数3
 Hong Wei (位宏)合作论文数3Peng LI (李鹏)合作论文数3HongLi Song (宋宏利)合作论文数3WeiBo Ceng (曾微波)合作论文数3MinShi Liu (刘民士)合作论文数3
 Yi Zhou (周毅)合作论文数School of Geography and Tourism, Shaanxi Normal University3
 Xingying Zhang (张兴赢)合作论文数National Satellite Meteorological Center, China Meteorological Administration;University of Chinese Academy of Sciences3Zheng Wang (王峥)合作论文数School of Information Science&Technology, Northwest University3Yini Jia (贾旖旎)合作论文数3
 Zhanbin Li (李占斌)合作论文数School of Water Resources and Hydro-electric Engineering, Xi’an University of Technology;Institute of Soil and Water Conservation, Chinese Academy of Sciences & Ministry of Water Resources3
 Yi Long (龙毅)合作论文数School of Geography, Nanjing Normal University3
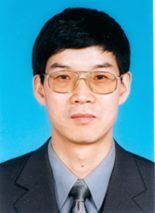 Tianxiang Yue (岳天祥)合作论文数Institute of Geographic Sciences and Natural Resources Research, Chinese Academy of Sciences;University of Chinese Academy of Sciences3
 Lingzhou Cui (崔灵周)合作论文数College of Life and Environmental Science, Wenzhou University3Jinglu Sun合作论文数2Yu Tao合作论文数2ZHAO Xin (赵昕)合作论文数2WANG Haoxiang (王浩翔)合作论文数2Wang Dong (王栋)合作论文数2
 Guanghui Hu合作论文数2
 Lei Shaohua合作论文数Department of Geography, Nanjing Normal University, Nanjing, China2
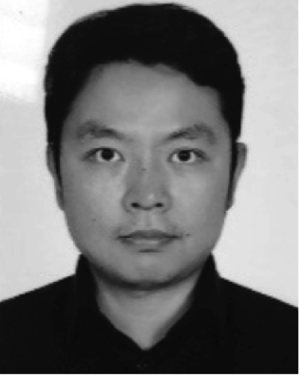 Chenchao Xiao合作论文数2




