Accurate mapping of grass species in biodiverse ecosystems, such as wetlands, is critical for ecological protection. Rapid advancements in remote sensing have established satellite data as a critical tool for wetland grass species mapping; however, its relatively coarse spatial resolution and susceptibility to cloud contamination limit the distinction of co-occurring species at fine scales. While Unmanned Aerial Vehicle (UAV) remote sensing offers high resolution and operational flexibility, relying on single-source features is often insufficient for fine-scale wetland species mapping due to the spectral similarity of co-occurring species. On the other hand, the fusion of multi-source remote sensing features (i.e., spectral, textural, and geometric features) likely provides a promising solution for achieving accurate, fine-scale grass species mapping in biodiverse ecosystems. In this study, we developed a wetland grass species mapping framework integrating spectral, textural, and geometric features derived from UAV RGB and multispectral imagery. Using a dataset of 95,880 image objects representing 24 wetland grass species classes collected in two years in Dajiu Lake National Wetland Park of China, we evaluated three machine learning algorithms—Support Vector Machine (SVM), Random Forest (RF), and eXtreme Gradient Boosting (XGBoost)—across various feature combinations. We found that while spectral features (i.e., red edge, normalized green–red difference index [NGRDI], and normalized difference vegetation index [NDVI]) (related to leaf pigment concentrations and cellular structures) exhibited the highest importance in wetland grass species mapping, textural (i.e., contrast) and geometric features (i.e., aspect ratio) significantly enhanced classification performance as complementary information, yielding improvements of up to 10.5% in overall accuracy (OA) and 0.103 in Macro-F1 scores. Specifically, the fusion of spectral, textural, and geometric features achieved optimal performance with an OA of 81.9% and a Macro-F1 of 0.807. Furthermore, the XGBoost model outperformed SVM and RF, improving OA by 9.4% and 2.8%, and Macro-F1 by 0.08 and 0.035, respectively. By identifying the optimal feature combination and machine learning algorithm, this study establishes an accurate method for wetland grass species mapping, offering new opportunities for ecological assessment and precision conservation in biodiverse landscapes.
Chinese milk vetch (CMV), as a typical green manure in southern China, plays an important role in improving soil quality and partially substituting nitrogen chemical fertilizers for rice production. Accurately estimating the aboveground biomass (AGB) of CMV is crucial for quantifying the biological nitrogen fixation amount (BNFA) and assessing its viability as a nitrogen fertilizer alternative. However, the traditional estimation methods have low efficiency in field-scale evaluations. Recently, unmanned aerial vehicle (UAV) remote sensing technology has been widely adopted for AGB estimation. This study utilized UAV-based multispectral and RGB imagery to extract spectral (Sp), textural (Tex), and structural features (Str), comparing various feature combinations in AGB estimation for CMV. The results indicated that the fusion of spectral, textural, and structural features indicated optimal estimation performance across all feature combinations, resulting in R2 values of 0.89 and 0.83 for model cross-validation and spatial transferability validation, respectively. The inclusion of textural and spectral features notably improved AGB estimation, indicated an increase of 0.15 and 0.14 in R2 values for model cross-validation and spatial transferability validation, respectively, compared with relying on spectral features only. Estimation based exclusively on structural features resulted in R2 values of 0.65 and 0.52 for model cross-validation and spatial transferability validation, respectively. The present study establishes a rapid and extensive approach to evaluate the BNFA of CMV at the full blooming stage utilizing the optimal AGB estimation model, which will provide an effective calculation method for chemical fertilizer reduction.
Abstract. South America is a global hotspot for land use and land cover (LULC) change, marked by dramatic agricultural land expansion and deforestation. Developing high-resolution, long-term crop-specific data is essential for gaining a deeper understanding of natural-human interactions and addressing the impacts of human activities on regional biogeochemical, hydrological cycles, and climate. In this study, we integrated multi-source data, including high-resolution remote sensing data, model-based data, and historical agricultural census data, to reconstruct the historical dynamics of four major commodity crops (i.e., soybean, maize, wheat, and rice) in South America at annual time scale and 1 km×1 km spatial resolution from 1950 to 2020. The results showed that cropland in South America has expanded rapidly through encroachment into other vegetation over the past 70 years. Specifically, soybean is one of the most dramatically expanded crops, increasing from essentially zero in 1950 to 48.8 Mha in 2020, resulting in a total loss of 23.92 Mha of other vegetation (i.e., forest, pasture/rangeland, and unmanaged grass/shrubland). In addition, the area of maize increased by a factor of 2.1 from 12.7 Mha in 1950 to 26.9 Mha in 2020, while rice and wheat areas remained relatively stable. The newly developed crop type data provide important insights for assessing the impacts of agricultural land expansion on crop production, greenhouse gas emissions, and carbon and nitrogen cycles in South America. Moreover, these data are instrumental for developing national policies, sustainable trade, investment, and development strategies aimed at securing food supply and other human and environmental objectives in South America and other regions. The datasets are available at https://doi.org/10.5281/zenodo.14002960 (Xu et al., 2024).
Rice, as the main food crop for half of the world's population, could directly threaten food supply chain stability if precise yield prediction methods are lacking. However, existing deep learning (DL) models exhibit strong scale dependency: when the input data resolution changes, the scale of spatial features extracted by the model no longer aligns with the actual size of target objects, leading to performance degradation due to mismatched receptive fields. To address the challenge posed by spatial resolution variation on the generalization ability of remote sensing DL models, this study proposes a DL model, U-shaped spatial-temporal attention network (USTAnet), by designing the multiscale convolution (MSC) block and multidimensional feature integrator blocks. These designs contribute to USTAnet's enhanced resolution generalization (the model's adaptability to remote sensing data with different spatial resolutions) and spatiotemporal generalization capabilities. USTAnet outperforms existing models in accuracy and generalization ability, including U-Net, CNN-GRU, LSTM-CNN, SSTNN, and DDCN, with an R-2 of 0.817 at a 4 km x 4 km resolution. In 1 km x 1 km resolution generalization tests, USTAnet consistently shows the best performance across all years (2011-2015), with an average R-2 of 0.758, which is 15% higher on average than other models. In spatial-temporal generalization tests, USTAnet exhibits the highest performance in 2015, with R(2)values of 0.817. This study proved that USTAnet is a promising kilometer-level yield prediction model with great potential for cross-resolution rice yield prediction applications, which can help promote the application of remote sensing technology in agricultural production.
Mapping forest landscape fragmentation (FLF) after fires is essential for maintaining ecosystem balance, reducing fire-related losses, and minimizing environmental damage. However, the “salt-and-pepper” phenomenon complicates accurate FLF mapping at fine resolutions (≤ 10 m) in mountainous regions. To relieve the phenomenon, this study used the multi-vegetation index (MVI) to represent FLF and applied the Simple Non-Iterative Clustering (SNIC) algorithm to convert pixels into objects before classification, and then SNIC-MVI RF was introduced to map FLF using Sentinel-2 imagery and land use data. In combination with topographical and meteorological data, the Geodetector was employed to analyze the influencing factors on FLF patterns across different fire severity ranges. The results indicate that: (1) The proposed SNIC-MVI RF can accurately retrieve FLF across a range of fire severity using 10-m Sentinel-2 imagery while mitigating the “salt-and-pepper” phenomenon, with an average precision of 96.2 % and an average F1-score of 97.4 %. (2) The FLF spatial patterns exhibit significant differences across fire severity. Low fire severity (LFS) leads to an increase in the number of small patches, moderate fire severity (MFS) results in more complex patch edges, and high fire severity (HFS) promotes greater patch aggregation. (3) Pre-fire meteorological conditions and vegetation cover are major influences on the spatial patterns of FLF under different fire severities. This study will provide a new method for exploring the impact of different fire severities on FLF in central Yunnan. As an important indicator for assessing ecological disturbance and habitat degradation, analyzing the response of fragmentation to different fire severities can help administrators evaluate the impacts of fire on FLF more scientifically and develop more targeted and sustainable forest management and ecological restoration strategies.
This study evaluates the effectiveness of the Green School Program (GSP) as a tool for Education for Sustainable Development (ESD) in achieving the Sustainable Development Goals (SDGs). Focusing on 98 primary and secondary schools in Beijing’s Xicheng District, it employs a multiple, descriptive case study approach supported by statistical analysis. The research assesses various aspects of ESD for 2030, such as policy implementation, learning environments, educator roles, youth engagement, and local initiatives. An innovative aspect of the study is the use of remote sensing technology to assess educational quality. The findings highlight effective methods for measuring ESD and provide China’s experiences and recommendations to contribute to global school-based sustainable development efforts, suggesting the importance of stakeholder collaboration in advancing SDGs. The study offers significant insights into the operational assessment of ESD in schools and contributes to global sustainable development initiatives.
Southern corn rust (SCR) is a significant foliar disease, which can result in substantial corn yield losses. Unmanned aerial vehicle (UAV)-based optical remote sensing presents a promising method for efficiently monitoring SCR in field conditions. Nevertheless, its performance can be challenged by SCR's bottom-up pathogenesis and canopy occlusion in field conditions. In contrast, multi-view imaging spectral measurements (MISM) can mitigate the effects of canopy occlusion by collecting complementary information from different corn layers. However, a method to optimize the fusion of MISM for precise and efficient monitoring of SCR remains absent. In this study, an attention-based deep learning method was introduced for the automated extraction of critical spectral and spatial information from MISM to monitor SCR. First, the optimal spectral features for SCR were explored and identified. Second, the improvements in SCR monitoring were evaluated by comparing MISM with the sole use of nadir-view. Finally, the performances of two attention-based deep learning algorithms (i.e., attention-based Fully Connected Network (FCN) and attention-based Convolutional Neural Network (CNN)) were assessed against the baseline Random Forest (RF) algorithm. These results indicated that: (1) spectral indices based on green-red-red edge bands were most effective for SCR monitoring across various views; (2) MISM significantly improved the accuracy of SCR monitoring compared to that of nadir-view imaging spectral measurement (-10 % improvements in both OA and Macro F1); (3) the integration of an attention mechanism with FCN or CNN, which considers the varied importance of multi-view spectral features, further improved the accuracy of SCR monitoring. The highest accuracy in SCR monitoring (OA: 82.1 %, Macro F1: 0.82) was achieved by the attention-based FCN, with a -7 % improvement in both OA and Macro F1 relative to the RF. Overall, this study provides a promising method for efficiently monitoring SCR in field conditions, which could assist in making smart agriculture decisions and reducing pesticide inputs.
ObjectiveIn recent years, there has been a significant increase in the severity of leaf diseases in maize, with a noticeable trend of mixed occurrence. This poses a serious threat to the yield and quality of maize. However, there is a lack of studies that combine the identification of different types of leaf diseases and their severity classification, which cannot meet the needs of disease prevention and control under the mixed occurrence of different diseases and different severities in actual maize fields.MethodsA method was proposed for identifying the types of typical leaf diseases in maize and classifying their severity using hyperspectral technology. Hyperspectral data of three leaf diseases of maize: northern corn leaf blight (NCLB), southern corn leaf blight (SCLB) and southern corn rust (SCR), were obtained through greenhouse pathogen inoculation and natural inoculation. The spectral data were preprocessed by spectral standardization, SG filtering, sensitive band extraction and vegetation index calculation, to explore the spectral characteristics of the three leaf diseases of maize. Then, the inverse frequency weighting method was utilized to balance the number of samples to reduce the overfitting phenomenon caused by sample imbalance. Relief-F and variable selection using random forests (VSURF) method were employed to optimize the sensitive spectral features, including band features and vegetation index features, to construct models for disease type identification based on the full stages of disease development (including all disease severities) and for individual disease severities using several representative machine learning approaches, demonstrating the effectiveness of the research method. Furthermore, the study individual occurrence severity classification models were also constructed for each single maize leaf disease, including the NCLB, SCLB and SCR severity classification models, respectively, aiming to achieve full-process recognition and disease severity classification for different leaf diseases. Overall accuracy (OA) and Macro F1 were used to evaluate the model accuracy in this study.Results and DiscussionThe research results showed significant spectrum changes of three kinds of maize leaf diseases primarily focusing on the visible (550-680 nm), red edge (740-760 nm), near-infrared (760-1 000 nm) and shortwave infrared (1 300-1 800 nm) bands. Disease-specific spectral features, optimized based on disease spectral response rules, effectively identified disease species and classify their severity. Moreover, vegetation index features were more effective in identifying disease-specific information than sensitive band features. This was primarily due to the noise and information redundancy present in the selected hyperspectral sensitive bands, whereas vegetation index could reduce the influence of background and atmospheric noise to a certain extent by integrating relevant spectral signals through band calculation, so as to achieve higher precision in the model. Among several machine learning algorithms, the support vector machine (SVM) method exhibited better robustness than random forest (RF) and decision tree (DT). In the full stage of disease development, the optimal overall accuracy (OA) of the disease classification model constructed by SVM based on vegetation index reached 77.51%, with a Macro F1 of 0.77, representing a 28.75% increase in OA and 0.30 higher of Macro F1 compared to the model based on sensitive bands. Additionally, the accuracy of the disease classification model with a single severity of the disease increased with the severity of the disease. The accuracy of disease classification during the early stage of disease development (OA=70.31%) closely approached that of the full disease development stage (OA=77.51%). Subsequently, in the moderate disease severity stage, the optimal accuracy of disease classification (OA=80.00%) surpassed the optimal accuracy of disease classification in the full disease development stage. Furthermore, the optimal accuracy of disease classification under severe severity reached 95.06%, with a Macro F1 of 0.94. This heightened accuracy during the severity stage can be attributed to significant changes in pigment content, water content and cell structure of the diseased leaves, intensifying the spectral response of each disease and enhancing the differentiation between different diseases. In disease severity classification model, the optimal accuracy of the three models for maize leaf disease severity all exceeded 70%. Among the three kinds of disease severity classification results, the NCLB severity classification model exhibited the best performance. The NCLB severity classification model, utilizing SVM based on the optimal vegetation index features, achieved an OA of 86.25%, with a Macro F1 of 0.85. In comparison, the accuracy of the SCLB severity classification model (OA=70.35%, Macro F1=0.70) and SCR severity classification model (OA=71.39%, Macro F1=0.69) were lower than that of NCLB.ConclusionsThe aforementioned results demonstrate the potential to effectively identify and classify the types and severity of common leaf diseases in maize using hyperspectral data. This lays the groundwork for research and provides a theoretical basis for large-scale crop disease monitoring, contributing to precision prevention and control as well as promoting green agriculture.
Temperate mixed forest ecosystems are composed of various tree functional types (TFTs) that differ in canopy structure, phenology, and physiological response to climate change. An accurate characterization of the composition of these TFTs is important for quantifying land surface carbon, energy, and water cycling, as well as process-based simulation of forest dynamics. However, because the pixel size of satellite imagery is usually larger than temperate tree crowns, it is challenging to untangle the significant pixel-wise signal mixture of TFT across mixed forest regions. Spectral Mixture Analysis (SMA) has been widely used to derive the sub-pixel fractional composition of TFT from satellite imagery, but accounting for the broad spectral variability within TFTs across space and time remains a challenge. Synthetic aperture radar (SAR) can indicate biomass mixture information, but it has not been fully exploited for deriving subpixel TFT composition. To improve TFT composition mapping in mixed forest regions, we developed a Fisher-transformation-based Spectral and Radar Time-series Mixture Analysis (F-SRTMA) framework on Google Earth Engine. The F-SRTMA framework aims to address the spacetime TFT variability of satellite signatures based on two modified modules: (1) the use of spectral and radar data with spatial and temporal information, and (2) feature optimization based on Fisher Discriminant Analysis (FDA). We tested the F-SRTMA at three representative temperate mixed landscapes located in the northeastern United States, where time-series Sentinel-1 and -2 data were used to calibrate our F-SRTMA approach. Airborne hyperspectral and LiDAR-derived canopy height data were used to generate ground reference TFT fraction maps for validation. The results demonstrate that (1) compared to the spectral time-series model, the synergy of spectral and radar time-series features yielded higher accuracy at the local sites (r2 = 0.649 vs. 0.680); (2) optimized feature based on FDA significantly minimized the within-TFT variability while maximizing the between-TFT variability, which further improved model generalizability across different landscapes, yielding the highest accuracy with cross-site r2 increasing from 0.634 to 0.715 and RMSE decreasing from 0.207 to 0.164. Collectively, these results suggest that F-SRTMA can be an accurate and generalizable approach for sub-pixel fraction mapping across temperate mixed landscapes, with the potential to be applied to other mixed forest ecosystems.
The early and accurate mapping of winter canola is essential in predicting crop yield, assessing agricultural disasters, and responding to food price fluctuations. Although some methods have been proposed to map the winter canola at the flowering or later stages, mapping winter canola planting areas at the early stage is still challenging, due to the insufficient understanding of the multi-source remote sensing features sensitive for winter canola mapping. The objective of this study was to evaluate the potential of using the combination of optical and synthetic aperture radar (SAR) data for mapping winter canola at the early stage. We assessed the contributions of spectral features, backscatter coefficients, and textural features, derived from Sentinel-2 and Sentinel-1 SAR images, for mapping winter canola at early stages. Random forest (RF) and support vector machine (SVM) classification models were built to map winter canola based on early-stage images and field samples in 2017 and then the best model was applied to corresponding satellite data in 2018–2022. The following results were obtained: (1) The red edge and near-infrared-related spectral features were most important for the mapping of early-stage winter canola, followed by VV (vertical transmission, vertical reception), DVI (Difference vegetation index), and GOSAVI (Green Optimized Soil Adjusted Vegetation Index); (2) based on Sentinel-1 and Sentinel-2 data, winter canola could be mapped as early as 130 days prior to ripening (i.e., early overwinter stage), with the F-score over 0.85 and the OA (Overall Accuracy) over 81%; (3) adding Sentinel-1 could improve the OA by about 2–4% and the F-score by about 1–2%; and (4) based on the classifier transfer approach, the F-scores of winter canola mapping in 2018–2022 varied between 0.75 and 0.97, and the OAs ranged from 79% to 86%. This study demonstrates the potential of early-stage winter canola mapping using the combination of Sentinel-2 and Sentinel-1 images, which could enable the large-scale early mapping of canola and provide valuable information for stakeholders and decision makers.
BACKGROUNDSpatial-explicit weed information is critical for controlling weed infestation and reducing corn yield losses. The development of unmanned aerial vehicle (UAV)-based remote sensing presents an unprecedented opportunity for efficient, timely weed mapping. Spectral, textural, and structural measurements have been used for weed mapping, whereas thermal measurements-for example, canopy temperature (CT)-were seldom considered and used. In this study, we quantified the optimal combination of spectral, textural, structural, and CT measurements based on different machine-learning algorithms for weed mapping. RESULTSCT improved weed-mapping accuracies as complementary information for spectral, textural, and structural features (up to 5% and 0.051 improvements in overall accuracy [OA] and Marco-F1, respectively). The fusion of textural, structural, and thermal features achieved the best performance in weed mapping (OA = 96.4%, Marco-F1 = 0.964), followed by the fusion of structural and thermal features (OA = 93.6%, Marco-F1 = 0.936). The Support Vector Machine-based model achieved the best performance in weed mapping, with 3.5% and 7.1% improvements in OA and 0.036 and 0.071 in Marco-F1 respectively, compared with the best models of Random Forest and Naive Bayes Classifier. CONCLUSIONThermal measurement can complement other types of remote-sensing measurements and improve the weed-mapping accuracy within the data-fusion framework. Importantly, integrating textural, structural, and thermal features achieved the best performance for weed mapping. Our study provides a novel method for weed mapping using UAV-based multisource remote sensing measurements, which is critical for ensuring crop production in precision agriculture. (c) 2023 The Authors. Pest Management Science published by John Wiley & Sons Ltd on behalf of Society of Chemical Industry.
Southern corn leaf blight (SCLB) seriously threatens corn production. The timely and accurate monitoring of SCLB conditions (e.g., detection during the asymptomatic stage and severity classification during the symptomatic stage) is valuable for precision agriculture, because the application of pesticides depends on disease conditions. Compared with time-consuming and laborious field surveys, spectroscopy is a promising tool for plant disease monitoring. The unique advantages of combining multiple spectral enhancement features for monitoring rice and wheat diseases have been recognized. However, physiological and biochemical differences between maize leaves and rice and wheat leaves, along with the specific spectral response of SCLB, are likely to affect the performance of combining multiple spectral enhancement features. In addition, similar previous studies have not combined spectral slope features, i.e., first-order spectral derivatives (FSDs), with spectral bands (SBs) and spectral indices (SIs) and wavelet features (WFs) to improve plant disease detection. Thus, the performance of a method that combines FSDs, WFs, SBs, and SIs for SCLB asymptomatic detection, symptomatic detection, and symptomatic severity classification should be evaluated further. Here, the utility of combining SBs, SIs, WFs, and FSDs was quantified and evaluated in the asymptomatic detection, symptomatic detection, and symptomatic severity classification of SCLB. Various forms of spectral enhancement features that were sensitive to SCLB infection from the asymptomatic stage to the severe stage were first identified and combined using the RELIEF-F and sequential floating forward selection algorithms on the basis of two independent inoculation experiments. Finally, SCLB asymptomatic detection, symptomatic detection, and symptomatic severity classification models were developed and evaluated using the support vector machine algorithm. Results showed that combining FSDs with SBs, SIs, and WFs achieved the best performance in SCLB spectroscopic monitoring. (1) SCLB asymptomatic detection and symptomatic detection were moderately improved, i.e., overall accuracy (OA) and macro F1 (MF1) improved by ~ 1% to 2%. The OA of SCLB asymptomatic detection was 87.1% with an MF1 of 0.87, and that of symptomatic detection was 93.1% with an MF1 of 0.93. (2) SCLB symptomatic severity classification was significantly improved, i.e., OA and MF1 improved by ~ 7%. The OA of severity classification was 81.8% with am MF1 of 0.82. This study demonstrated that the complementary relationships among SBs, SIs, WFs, and FSDs could effectively improve SCLB spectroscopic monitoring. The proposed method provides a novel tool for large-scale SCLB spectroscopic monitoring. It has broad implications for assisting management decisions (i.e., when and where to apply pesticides and how much to apply) in precision agriculture.
å¯æ¸©å¸¦æ£®ææ¯éå°ä¸åå¸é¢ç§¯æ广ç森æçæç³»ç»ï¼å ·æéè¦ççæå社ä¼ç»æµä»·å¼ãå®éå»ç»é¿æ¶åºå¯æ¸©å¸¦æ£®æç±»ååæ ç§è¦çä¿¡æ¯å¯¹äºéåå ¶çæç³»ç»æå¡åè½ä»¥åå¶å®æ£®æ管çæ¿çå ·æéè¦æä¹ãç¶èåå®æµè¦ç度æ°æ®ç¼ºä¹åå¤å 谱影åå 谱信æ¯æéçéå¶ï¼ç°æç 究è¾å°æ¢è®¨ä¸å辨çå¤å è°±æè½½æ°æ®ï¼å¦Landsatå«æï¼å¯¹ä¸å½å¯æ¸©å¸¦æ£®æç±»åè¦ç度åæ ç§è¦ç度è¿è¡é¿æ¶åºåæ¼çå¯è¡æ§ï¼å¹¶ä¸å¯¹äºé¥æå½±åè·åæ¶é´é¢çï¼åæ¶ç¸ãå¤æ¶ç¸ï¼å¯¹åæ¼ç²¾åº¦çå½±åä»ç¼ºä¹å®éè¯ä¼°ã为æ¤ï¼æ¬æå©ç¨äººå·¥åææ ·æ¬åéæºæ£®æåå½æ¨¡å对é»é¾æ±çå家å²æåºç森æç±»ååæ ç§è¦ç度åå«è¿è¡äºåæ¼ã并å°æ¨¡ååºç¨è³1986-2020å¹´çLandsatå½±åï¼å¾å°å家å²æåºéå¶æåéå¶æ35å¹´çè¦ç度ç»æãç»æ表æï¼ï¼1ï¼å¯¹äºæ£®æç±»åè¦ç度åæ¼ï¼åºäºçé¿å£Landsat波段åæ¤è¢«ææ°ï¼å½ä¸åèä½ææ°ä»¥å缨帽åæ¢ç³»æ°ï¼çä¸å¼ç¹å¾ä¼°ç®ç精度æé«ï¼éå¶æè¦ç度估ç®R¯2= 0.76ï¼éå¶æè¦ç度估ç®R¯2= 0.71ï¼ï¼2ï¼å¯¹äºæ ç§è¦ç度åæ¼ï¼åºäºå¤æ¶ç¸Landsat波段åæ¤è¢«ææ°ç精度æé«ï¼è½å¶æ¾è¦ç度估ç®R¯2= 0.40ï¼çº¢æ¾è¦ç度估ç®R¯2= 0.23ï¼æ¨åæ¾è¦ç度估ç®R¯2= 0.61ï¼ï¼3ï¼å¢å å½±åè·åæ¶é´å¯åº¦å¯¹äºæ£®æç±»åè¦ç度åæ¼ç²¾åº¦çæé«æ²¡ææ¾èè´¡ç®ï¼éå¶æâR¯2= 0.01ï¼éå¶æâR¯2= -0.03ï¼ï¼ä½å¯¹æé«æ ç§è¦ç度çåæ¼ç²¾åº¦å¸®å©è¾å¤§ï¼è½å¶æ¾âR¯2= 0.04ï¼çº¢æ¾âR¯2= 0.07ï¼æ¨åæ¾âR¯2= 0.27ï¼ãæ¬æç»å人工åææ ·æ¬åéæºæ£®æåå½æ¨¡åçä¼å¿ï¼å®éè¯ä¼°äºä¸åæ¶é´é¢ççæ¶åºå è°±ç¹å¾å¯¹æ£®æç±»ååæ ç§è¦ç度åæ¼ç精度ï¼ä¸ºä¸å½åæ¹æ£®æ以åå ¨çå¯æ¸©å¸¦æ£®æç±»ååæ ç§è¦ç度ç大尺度é¿æ¶åºä¼°ç®æä¾äºæè·¯ã
Pre-harvest yield prediction of ratoon rice is critical for guiding crop interventions in precision agriculture. However, the unique agronomic practice (i.e., varied stubble height treatment) in rice ratooning could lead to inconsistent rice phenology, which had a significant impact on yield prediction of ratoon rice. Multi-temporal unmanned aerial vehicle (UAV)-based remote sensing can likely monitor ratoon rice productivity and reflect maximum yield potential across growing seasons for improving the yield prediction compared with previous methods. Thus, in this study, we explored the performance of combination of agronomic practice information (API) and single-phase, multi-spectral features [vegetation indices (VIs) and texture (Tex) features] in predicting ratoon rice yield, and developed a new UAV-based method to retrieve yield formation process by using multi-temporal features which were effective in improving yield forecasting accuracy of ratoon rice. The results showed that the integrated use of VIs, Tex and API (VIs & Tex + API) improved the accuracy of yield prediction than single-phase UAV imagery-based feature, with the panicle initiation stage being the best period for yield prediction (R2 as 0.732, RMSE as 0.406, RRMSE as 0.101). More importantly, compared with previous multi-temporal UAV-based methods, our proposed multi- temporal method (multi-temporal model VIs & Tex: R2 as 0.795, RMSE as 0.298, RRMSE as 0.072) can increase R2 by 0.020–0.111 and decrease RMSE by 0.020–0.080 in crop yield forecasting. This study provides an effective method for accurate pre-harvest yield prediction of ratoon rice in precision agriculture, which is of great significance to take timely means for ensuring ratoon rice production and food security.
Plantation forests provide critical ecosystem services and have experienced worldwide expansion during the past few decades. Accurate mapping of tree species through remote sensing is critical for managing plantation forests. The typical temporal behaviors and traits of tree species in satellite image time series (SITS) generate temporal and spectral features in multiple phenological stages that are critical to improve tree species mapping. However, the diverse input features, sequential relations and complex structures in SITS drastically increase the dimension and difficulty of spectral-temporal feature extraction, which challenges the capacity of many general classifiers not explicitly adapted for spectral-temporal learning. As a result, there is still a lack of a method that could automatically extract spectral-temporal features with high separability and regional adaptability from highdimensional SITS for tree species mapping of plantation forests. Moreover, the effects of varying temporal resolution and feature combination on the plantation tree species mapping are under-explored. Here, we developed a multi-head attention-based method for automatically extracting spectral-temporal features with high separability based on a modified Transformer network (Transformer4SITS) for improved plantation tree species mapping. The end-to-end network model consists of a feature extraction module to learn deep spectral-temporal features from SITS and a fusion module to combine multiple features for improving mapping accuracy. We applied this method to two representative plantation forests in southern and northern China for tree species mapping. The results show that: (1) Transformer4SITS method could self-adaptively extract typical spectraltemporal features of key phenological stages (e.g., greenness rising and falling) from SITS, and achieved significantly improved accuracies by at most 15% in comparison with all four baseline methods (i.e., long shortterm memory, harmonic analysis, time-weighted dynamic time warping, linear discriminant analysis); (2) time series with higher temporal resolution tended to produce more accurate species maps consistently across two sites, with their overall accuracies (OA) respectively increasing from 91.05% and 84.33% (60-day) to 94.88% and 88.72% (5-day), but the effect of high temporal resolution respectively leveled off around 90-day and 50-day resolution across two sites; (3) the mapping results using all available bands and two-band spectral indices outperformed the results using a subset of them, but with only modest increase in the accuracy (i.e., OA increased from 93.63% and 86.01% to 94.88% and 88.72%. This study thus provides a state-of-the-art deep learning-based method for improved tree species mapping, which is critical for sustainable management and biodiversity monitoring of plantation forests across large scales.
Tropical deforestation frontiers continue to expand at alarming rates, but their fine-scale temporal patterns (e.g., start timing, patch forming speed, temporal clustering within a year) remain unresolved. Previous deforestation monitoring focus on the annual dynamics or the timely identification of deforestation activities; however, improved methods are needed for accurate mapping of deforestation patches at higher temporal resolution (i.e., sub-monthly) to better reveal their fine-scale temporal dynamics. We propose an optimization method inte-grating the spatial and temporal context information to improve the sub-monthly deforestation mapping from Sentinel-1 (S1) SAR data: (1) a deep learning-based spatial optimization to suppress speckle noises; (2) a Bayesian-based temporal optimization to meaningfully combine deforestations detected in the S1 data streams. The proposed method was comprehensively assessed in three deforestation hotspots in Brazil -Acre, Rondonia and Par ' a, for the whole year of 2019. Results showed: (1) the spatial optimization alone can improve the ac-curacies of deforestation mapping from single-date S1 images for up to 7.3%; (2) the Bayesian-based temporal optimization improved the deforestation mapping accuracies for about 5.9% after three post-deforestation S1 observations (about 18 +/- 3 days after deforestation); (3) combining the spatial and temporal optimizations achieved the highest classification accuracies (overall accuracy of 91.0%, IoU of 89.1%), surpassing the baseline monthly composite method (overall accuracy of 89.3%, IoU of 87.3%) within fewer observation days. Further frontier analysis based on these sub-monthly results showed varying distributions of patch size and forming speed in these three study sites during the wet and dry seasons. The temporal clustering of deforestation also differed among sites during 2019: deforestations in Rondonia were most concentrated during the dry season (CV = 1.1), followed by Par ' a (CV = 0.75), while Acre showed more even temporal distribution in deforestation year-round (CV = 0.57). The proposed method thus can be used for revealing unprecedented temporal details regarding tropical deforestation frontiers, which is critical for evaluating the ecological consequences and formulating scientific conservation strategies.
The recent northward expansion of Southern Pine Beetle (SPB) outbreaks associated with warming winters has caused extensive tree mortality in temperate pine forests, significantly affecting forest dynamics, structure, and functioning. Spatially-explicit early warning and detection of SPB-induced tree mortality is critical for timely and sustainable forest management practices. The unique contributions of remote sensing technologies to mapping the location, extent, and severity of beetle outbreaks, as well as assisting in analyzing the potential drivers for outbreak predictions, have been well recognized. However, little is known about the performance of moderate resolution satellite multispectral imagery for early warning and detection of SPB-induced tree mortality. Thus, we conducted this study, as the first attempt, to capture the spatial-temporal patterns of SPB infestation severity at the regional scale and to understand the underlying environmental drivers in a spatially-explicit manner. First, we explored the spectral signatures of SPB-killed trees based on 30-m plot measurements and Landsat-8 imagery. Then, to improve detection accuracy for areas with low-moderate SPB infestation severity, we added spectraltemporal anomaly information in the form of a linear trend of the spectral index trajectory to a previously developed approach. The best overall accuracy increased from 84.7% to 90.1% and the best Macro F1 value increased from 0.832 to 0.900. Next, we compared the performances of spectral indices in mapping SPB infestation severity (i.e., % red stage within the 30-m grid cell). The results showed that the combination of Normalized Difference Moisture Index and Tasseled Cap Greenness had the best performance for mapping SPB infestation severity (2016: R2 = 0.754; RSME = 15.7; 2017: R2 = 0.787; RSME = 12.4). Finally, we found that climatic and landscape variables can explain the detected patterns of SPB infestation from 2014 to 2017 in our study area (R2 = 0.751; RSME = 9.67), providing valuable insights on possible predictors for early warning of SPB infestation. Specifically, in our study area, winter dew point temperature was found to be one of the most important predictors, followed by SPB infestation locations in the previous year, canopy cover of host species, elevation, and slope. In the context of continued global warming, our study not only provides a novel framework for efficient, spatially-explicit, and quantitative measurements of forest damage induced by SPB infestation over large scales, but also uncovers opportunities to predict future SPB outbreaks and take precautions against it.
 Shawn Serbin合作论文数Environmental Sciences Department, Brookhaven National Laboratory19
 Binyuan Xu合作论文数12Zhengang Lv合作论文数12
 Philip Dennison合作论文数Department of Geography, University of Utah12
 Feng Zhao (赵峰)合作论文数School of Instrumentation and Optoelectronic Engineering, Beihang University11
 Jin Wu合作论文数School of Biological Sciences, Faculty of Science, The University of Hong Kong9
 Rui Sun (孙睿)合作论文数State Key Laboratory of Remote Sensing and Digital Earth, Faculty of Geographical Science, Beijing Normal University9Longfei Zhou合作论文数8
 Linglin Ceng (曾玲琳)合作论文数College of Resources & Environment of Huazhong Agricultural University7
 Chengquan Huang合作论文数Department of Geographical Sciences, University of Maryland7
 Zehua Huang合作论文数6
 Alistair Rogers合作论文数Climate and Ecosystem Sciences Division, Lawrence Berkeley National Laboratory6Gengshen Chen合作论文数5Andrew McMahon合作论文数5
 Dedi Yang合作论文数5
 Bruce Cook合作论文数Goddard Space Flight Centre, NASA5Kathy L. Schwager合作论文数4Kristen Brewster合作论文数4
 Ryan P. Hanavan合作论文数4Kim S. Ely合作论文数4Yutao Zhao合作论文数3Guozhang Peng合作论文数3
 Zhiqiang Gao (高志强)合作论文数中国科学院大学烟台海岸带研究所3
 Alfredo Huete合作论文数School of Life Science, University of Technology Sydney3
 Wouter Hantson合作论文数Avia-GIS3
 Le Yu (俞乐)合作论文数Department of Earth System Science, Tsinghua University3Liheng Zhong合作论文数3
 Scott Saleska合作论文数College of Science, University of Arizona3Liao Yigui合作论文数2Renjie Gao合作论文数2
 Loren P. Albert合作论文数2Mengyu Wang合作论文数2
 Xing Yu合作论文数2Jin Wu合作论文数2Weixiong Wu合作论文数2
 Shun Hu合作论文数2
 Le Xu (徐乐)合作论文数College of Agriculture, Yangtze University2
 Wen Jia合作论文数2Rui Wang合作论文数2
 E. Natasha Stavros合作论文数Cooperative Institute for Research in Environmental Sciences, University of Colorado Boulder2
 Scott C Stark合作论文数Laboratory of Forest - Atmosphere Interactions, Department of Forestry, College of Agriculture & Natural Resources, Michigan State University2
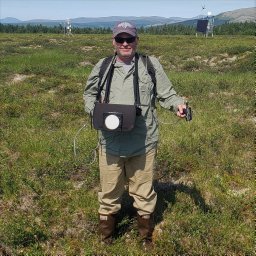 Daniel J. Hayes合作论文数Director, Wheatland Geospatial Laboratory2
 Xiangtao Xu合作论文数Ecology and Evolutionary Biology, College of Arts and Sciences, Cornell University2
 Guoqing Zhou (周国清)合作论文数College of Earth Sciences, Guilin University of Technology2
 Breen Amy L合作论文数2
 Shaobing Peng合作论文数Department of Agronomy, College of Plant Science and Technology, Huazhong Agricultural University2
 Carla D'Antonio合作论文数Department of Ecology, Evolution and Marine Biology, University of California2
 Jianguo Man (满建国)合作论文数College of Plant Science & Technology, Huazhong Agricultural University2




