China aims to reduce its carbon emissions to achieve carbon peaking and neutrality. Measuring the carbon emission efficiency of three urban agglomerations in China, exploring their spatiotemporal characteristics, and investigating the main influencing factors are crucial for achieving regional sustainable development and dual carbon goals. Using the super-slack-based measurement (super-SBM) model, we calculated the carbon emission efficiency of the Beijing–Tianjin–Hebei (BTH), Yangtze River Delta (YRD), and Pearl River Delta (PRD) urban agglomerations from 2011 to 2021 and explored the spatiotemporal non-equilibrium characteristics of carbon emission efficiency and its influencing factors. The results indicated that: (1) Overall, the carbon emission efficiency showed an N-type trend, with the PRD having the highest average efficiency. Regional differences between the YRD and BTH regions gradually increased. (2) The efficiency hotspots shifted from the PRD to the YRD, whereas the cold spots were mainly concentrated in the BTH region. The variation in the standard deviation ellipse radius of carbon emission efficiency in the urban agglomerations was clear, and the spatial disequilibrium was significant. (3) Economic level and opening up had positive impacts on carbon emission efficiency, whereas energy intensity and industrial structure had negative impacts. The effects of population size, government intervention, and technological level varied among the regions.
Vegetation plays a crucial role in maintaining the balance between nature, water and soil resources. However, understanding its impact mechanisms in arid and semi-arid areas remains limited. This study aims to analyze the spatial–temporal characteristics of the vegetation leaf area index (LAI) and climate elements in typical regions of northwest China and the correlations between LAI and climate elements; it also aims to explore the influence of regional vegetation growth on climate change. The results reveal significant correlations between LAI and various climate elements. Specifically, within the same region, surface temperature, precipitation, vegetation transpiration, and total evaporation show positive correlations with the LAI, whereas surface albedo shows a negative correlation. Vegetation may affect climate through both heat and water exchange between the land and atmosphere. Increased vegetation leads to the enhanced absorption of solar radiation by the land surface, elevating surface temperature. Increased levels of vegetation also increase vegetation transpiration and total evaporation, increasing the water vapor content in the atmosphere and thus leading to increased surface precipitation. Therefore, vegetation distribution plays a role in climate change, and ecological restoration projects in the northwest region hold significant potential for addressing ecological challenges in its arid and semi-arid areas.
Based on the daily data of temperature and precipitation from 7 meteorological stations in Maowusu Sandy Land from 2000 to 2020, linear regression analysis was used to clarify the characteristics of temperature and precipitation changes in the study area. The results show that the temperature in the Mu Us sandy land showed an overall upward trend from 2000 to 2020, with a growth rate of 0.09 ℃/(10a) and an average temperature of 9.26 ℃; The precipitation shows a fluctuating upward trend, with a growth rate of 4.06mm/a and an average precipitation of 373.75mm. Since the 21st century, there has been a discrepancy between the trend of temperature changes in the research area and global warming. The possible reason for this is the implementation of ecological engineering, which has improved the local climate characteristics of the research area and further affirmed the effectiveness of national ecological policies.
Urban construction land (UCL) change is a significant cause of changes in urban carbon emissions. However, as the extent of this effect is currently unclear, cities cannot easily formulate reasonable carbon reduction policies in terms of land use. Taking the city of Wuhan, China, as an example, this paper combines data on land use and carbon emissions from 1995 to 2019 and uses spatial analysis, curve estimation, and correlation evaluation to explore the direct and indirect effects of the UCL changes on carbon emissions. The results show that: (1) Between 1995 and 2019, the UCL area in Wuhan increased by 193.44%, and carbon emissions increased by 78.63%; moreover, both changes showed a gradually increasing spatial correlation, and the quantitative relationship could be better fitted with a composite function model; (2) The UCL change had mainly an indirect impact on carbon emissions via factors such as population and energy use intensity per unit of carbon emissions; (3) The maximum value of carbon emissions inside a unit area decreased during the study period, with an average annual decrease of about 2.02%. Therefore, the city of Wuhan can promote the achievement of its carbon emissions reduction targets by improving the existing land use policies, for example, by dividing the city into multiple functional zones.
In China, county-level regions play a pivotal role in achieving dual carbon goals. In this study, we analyzed the spatiotemporal characteristics of carbon balance coefficients for counties in Jiangsu Province from 2000 to 2021. The logarithmic mean Divisia index decomposition method explored the factors influencing county-level carbon balance. The findings indicated that CO2 emissions in Jiangsu Province increased from 192 million tons in 2001 to 637 million tons in 2011 and exhibited a small fluctuation from 2012 to 2021. A “higher in the south, lower in the north” distribution pattern emerged, with high CO2 emission areas concentrated in the economically developed south. Vegetative carbon sequestration increased from 142 million tons in 2000 to 171 million tons in 2021 with a “higher boundary and lower at the center” distribution pattern. High carbon sequestration areas were mainly in regions with abundant natural resources and vegetation. The number of counties experiencing carbon imbalance rose from 63 in 2000 to 95 in 2021, with a spatial distribution similar to high carbon emissions. Economic development and urbanization accelerated carbon imbalance, whereas technological advancement and reduced regional carbon fixation pressure effectively alleviated it. Pursuing of dual carbon goals can be supported by reducing emissions and increasing carbon sinks.
限制开发的重点生态功能县域承担着生态保护与经济发展双重使命,如何实现生态与发展互促共进及生态产品价值化是当前面临的极大难点,生态资产损益核算为量化区域资源有偿使用、生态保护修复、生态文明绩效评价等提供了有效途径.以浙江省嵊州市作为长三角地区重点生态功能区的典型县域,基于栅格尺度评估了近20年生态资产存量与流量时空动态变化,并利用地理探测器结合人类活动类型监测分析了生态资产损益的驱动因素.结果表明:2000-2018年,由于森林生态资产质量降低及面积减少,嵊州市近60%区域的生态资产存量呈减少趋势,而生态资产流量总价值与单位面积价值均增益10%以上.相对于自然因素,社会经济因素对嵊州市生态资产损益平均贡献度更大,为17%.县域城镇化导致粮食供给轻微减损,70%以上乡镇生态资产增益,特别是石璜镇生态保护成效较突出.
Rapid and accurate monitoring of the dynamic change of construction land is of great significance for strictly controlling the arbitrary growth of urban construction land and protecting agricultural and forestry land. In order to master the situation of land use change and conduct more efficient research on urban land use classification, this paper takes Weinan as the research object and uses Landsat8 data under the same classification conditions to analyze the image features of various land use types respectively by using minimum distance, maximum likelihood and random forest method, and carries out land use classification research. The research shows that for the selected research area, the maximum likelihood classification method has higher classification accuracy and time efficiency, while the minimum distance and random forest can not reflect its superior classification performance, and the overall accuracy is lower than the maximum likelihood classification method, and the maximum likelihood classification method has obvious advantages. Therefore, in the classification of remote sensing image, the maximum likelihood classification method is suitable when the data dimension is low.
Soil water erosion is considered to be a major threat to ecosystems and an important environmental problem. Aggravation of soil and water loss in the Three-River Headwaters Region (TRHR) is a prominent problem in China. In this research, the Revised Universal Soil Loss Equation (RUSLE) was applied to evaluate annual soil loss caused by water erosion in the TRHR from 2000 to 2020. Spatiotemporal patterns of soil water erosion were analyzed and the main driving factors of rainfall erodibility and vegetation coverage were investigated using ArcGIS spatial analysis. The results revealed that during the study period, soil erosion in the TRHR averaged 10.84 t/hm2/a, and values less than 25 t/hm2/a were characterized as micro and mild erosion. The soil erosion modulus observed a slightly increasing trend over the past decade. The changing trends in the Yangtze, Huanghe, and Lancang river source regions (YRSR, HRSR, and LRSR) were 0.03, 0.07, and 0.03 t/hm2/a, respectively. Both rainfall erodibility and vegetation coverage observed a growing trend, with slopes of 6.78 MJ·mm/(t·hm2·a) and 0.12%/a, respectively. In general, variation of rainfall erodibility showed a relatively higher contribution to soil erosion than vegetation coverage. Findings of this study could provide information for sustainable vegetation restoration, soil conservation, and water management at a regional scale.
Replacing fossil fuels with bioenergy is crucial to achieving sustainable development and carbon neutrality. To determine the priorities and developing trends of bioenergy technology, related publications from 2000 to 2020 were analyzed using bibliometric method. Results demonstrated that the number of publications on bioenergy increased rapidly since 2005, and the average growth rate from 2005 to 2011 reached a maximum of 20% per year. In terms of publication quantity, impact, and international collaboration, the USA had been leading the research of bioenergy technology, followed by China and European countries. Co-occurrence analysis using author keywords identified six clusters about this topic, which are “biodiesel and transesterification”, “biogas and anaerobic digestion”, “bioethanol and fermentation”, “bio-oil and pyrolysis”, “microalgae and lipid”, and “biohydrogen and gasification or dark fermentation”. Among the six clusters, three of them relate to liquid biofuel, attributing that the liquid products of biomass are exceptional alternatives to fossil fuels for heavy transportation and aviation. Lignocellulose and microalgae were identified as the most promising raw materials, and pretreating technologies and efficient catalysts have received special attention. The sharp increase of “pyrolysis” and “gasification” from 2011 to 2020 suggested that those technologies about thermochemical conversion have been well studied in recent years. Some new research trends, such as applying nanoparticles in transesterification, and hydrothermal liquefaction in producing bio-oil from microalgae, will get a breakthrough in the coming years.
A clear understanding of the impacts of urban land expansion on ecosystem services is crucial for sustainable urban planning. Although various studies have shown that urban land expansion caused a degradation of ecosystem services, the relationship between the spatial variation of urban land expansion and ecosystem services still remains unclear. This study quantified the ecosystem services and urban land expansion indicators of Wuhan for 1990–2015 and analyzed the spatial and temporal variation characteristics of ecosystem service values (ESVs) and urban land expansion indicators. Using spatial autocorrelation analysis and linear regression, the quantitative and qualitative correlations between ecosystem services and urban land expansion indicators were explored. The total ESV of Wuhan decreased by 16.47%, representing a loss of 1636.19 million yuan. Areas with extremely low ESVs continuously expanded outward from the urban center. During 2010–2015, the urban land expansion area, intensity, damage weight, and distance peaked, which caused an enormous decrease of the total ESV. Negative correlations were found between urban land expansion and all ecosystem services; the correlation with food production was most significant, indicating that urban land expansion had the strongest impact on food production. The expansion area is the main factor causing the decline of each ecosystem service among urban land expansion indicators. This study presents the impact characteristics of urban land expansion on ecosystem services, and the results provide a reference for reasonable decision making in urban planning.
A clear insight into the response mechanism of Ecosystem Services (ESs) to urban land expansion can provide references for balancing the relationship between urbanization and ecosystem. Some qualitative studies have looked at the relationship between ESs and urban land expansion, but they can hardly reveal the response mechanism. Thus, we adopted the dynamic equivalent factor method to quantitatively assess each of the Ecosystem Service Values (ESVs) and the total ESVs, then explored the response mechanism through the correlation analysis in Wuhan. The results showed that: (1) During 1990-2015, various ESVs in Wuhan decreased continuously, with the largest decline in the food production, the smallest in hydrology regulation; the ESVs of the whole region showed a downward trend, particularly, in the central region where construction land was concentrated, the ESVs dropped sharply. (2) The demand pressure of ESs brought by population growth was much larger than the direct damage of urban land expansion to ESs. (3) The urban land expansion had the greatest damage to raw material production. This research could deepen the understanding of the relationship between urban land expansion and the decrease of ESVs, but also provide theoretical references for the reasonable expansion of urban land in Wuhan.
From the four dimensions of technology, economy, society, and ecology, this paper adopts the policy literature review method, combining the two categories of "policy orientation" and "document reference" to conduct qualitative screening of evaluation indicators for the coordination level of technology-economy-society-ecological coupling in the Beijing-Tianjin-Hebei region.On this basis, it uses the principal component-correlation analysis method to quantitatively screen the evaluation indicators of the coordination level of technology-economy-society-ecology coupling in the Beijing-Tianjin-Hebei region.At the same time, it combines the weighted comprehensive index method with the coupling coordination model to construct a technology-economy-society-ecology coupling coordination evaluation model to measure the technology-economy-society-ecology development index of the Beijing-Tianjin-Hebei region and dynamically evaluate the coordination level of technology-economy-societyecology coupling in the Beijing-Tianjin-Hebei region.
China accounts for 25% of the global greening. There are temporal and spatial differences of China’s greening and intrinsic driving forces. Thus, it is crucial to determinize the contributions of human activities and climate change on greening at region scale. The Beijing–Tianjin–Hebei Region (BTHR) is one of the most active areas with human activities in China. It is necessary to explore negative or positive impacts of human activities on the regional greening or browning under climate change. A time series of annual vegetation coverage from satellite data was selected to quantify regional greening in the BTHR from 2000 to 2019 and their responses to climate change and human activities. Results showed generally widespread greening over the last 20 years at an average increased rate of 0.036 decade −1 in vegetation coverage ( P < 0.01). Overall warmer and wetter climate across the BTHR were positively correlated with regional greening. The positive effects of human activities on greening accounted for 48.4% of the BTHR, especially the benefits of ecological restoration projects and the agricultural activities. Increases in vegetation coverage had resulted from the combined effects of climate change and human activities. Climate change had a stronger influence on vegetation coverage than human activities. Contributions of climate change to greening and browning was about 74.1% and < 20%, respectively. The decrease in vegetation coverage was mainly the results of the inhibition of human activities. More detailed socioeconomic and anthropogenic datasets are required for further analysis. Further research consideration would focus on the nonlinear responses of vegetation to climate change.
在高度城市化地区,土地二次开发面临的困境是农村集体利用集体土地的模糊产权性质进行不合法建设带来现实利益分享和现有政策法律不认可之间的矛盾.文章通过对土地增值收益的来源及分配的理论分析,从土地增值收益分配视角对深圳的土地整备制度进行解析,提出通过改变政府对集体土地增值收益的垄断,实现政府和相关权益人的利益共享;利用农村集体的自治优势,搭建二层次的利益博弈平台,降低交易成本;同时,也认识到该政策竞争可能导致农村集体获利过多,影响城市公共利益,忽视外来者的利益.
Long-term (1982–2013) datasets of climate variables and Normalized Difference Vegetation Index (NDVI) were collected from Climate Research Union (CRU) and GIMMS NDVI3g. By setting the NDVI values below the threshold of 0.2 as 0, NDVI_0.2 was created to eliminate the noise caused by changes of surface albedo during non-growing period. TimeSat was employed to estimate the growing season length (GSL) from the seasonal variation of NDVI. Statistical analyses were conducted to reveal the mechanisms of climate-vegetation interactions in the cold and semi-arid Upper Amur River Basin of Northeast Asia. The results showed that the regional climate change can be summarized as warming and drying. Annual mean air temperature (T) increased at a rate of 0.13 °C per decade. Annual precipitation (P) declined at a rate of 18.22 mm per decade. NDVI had an insignificantly negative trend, whereas, NDVI_0.2 displayed a significantly positive trend (MK test, p < 0.05) over the past three decades. GSL had a significantly positive rate of approximately 2.9 days per decade. Correlation analysis revealed that, NDVI was significantly correlated with amount of P, whereas, GSL was highly correlated with warmth index (WMI), accumulation of monthly T above the threshold of 5°C. Principal regression analysis revealed that the inter-annual variations of NDVI, NDVI_0.2 and GSL were mostly contributed by WMI. Spatially, NDVI in grassland was more sensitive to P, whereas, T was more important in areas of high elevation. GSL in most of the areas displayed high sensitivity to T. This study examined the different roles of climate variables in controlling the vegetation activities. Further studies are needed to reveal the impact of extended GSL on the regional water balance and the water level of regional lakes, providing the habitats for the migratory birds and endangered species.
Land-use and land cover changes may have important local, regional, and global climatic impacts by modifying the underlying land surface conditions, which in turn influence the exchange of energy and moisture between the land surface and atmosphere. Many studies have shown that urbanization has contributed to climate warming, and the amount of warming has varied. As the capital of China and one of the world’s megacities, Beijing has experienced rapid urbanization over the past 30 years. In this study, we quantitatively investigated the impacts of urbanization on regional temperatures based on observations from meteorological stations and National Centers for Environmental Prediction (NCEP) reanalysis data and overestimating of the impacts were found. Comparing the temperature trends of land-use types, forest showed stronger inhibitory effects on temperature increase (−0.085°C/10a). Cropland also had a negative effect on climate warming yearly and seasonally, especially in winter (−1.133°C/10a) and spring (−0.299°C/10a). Conversely, the urban area showed strong warming effects (0.438°C/10a). The conversion of cropland to urban land appeared to show the highest warming trend (0.548°C/10a). However, the cooling effect of forest and grassland with high vegetation coverage inhibited climatic warming attributed to rapid urbanization. In addition, planting trees or grass along roadsides and increasing green parks and green roofs can also suppress surface warming. Therefore, the actual warming effects of urbanization on temperatures were overestimated in megacities or urban agglomeration regions. The results showed that the green space and landscape configuration should be considered in urban planning to increase green space and reduce the influence of urban heat island effect.
为研究银川市城市建成区扩展对热环境的影响,基于1989、1999、2010年和2017年Landsat系列遥感数据,采用建筑用地指数(IBI)提取4个年份的城市建成区信息,获取了城市形态演化指标,利用热红外波段反演不同年份的地表温度;在此基础上,分析了城市扩展和热环境变化的时空演变特征,探讨了城市扩展和热环境之间的响应关系.结果表明:(1)1989—2017年银川市城市建成区扩展面积达506.13 km2,各时期的扩展速度和扩展强度差异明显,城市扩展具有"缓慢—快速—稳步"的阶段性特征,城市空间形态趋于紧凑化,向着稳定状态发展,城市整体向东部和北部扩展,重心整体向东北方向迁移约5.54 km.(2)热岛范围随着城市扩展不断扩大,较高温区域所占热岛比例呈先减小后增加的趋势,高温和特高温占比表现出先增加后减小的特征,热岛强度逐渐向较高温区转移,城市热岛效应得到缓解;热岛空间分布显示,热岛逐渐由兴庆区老城区蔓延至贺兰县和西夏区,且兴庆区热岛逐渐演化为相互独立的小次级热岛,强度有所降低;28 a间银川市城市热岛比例指数(URI)表现出先上升后下降的特征,整体呈上升趋势.(3)热岛区域在空间分布和扩展方向上与城市扩展具有较高的一致性,城镇用地、公交建设用地和裸地能促进地表温度升高,而草地和水体能够降低地表温度,公园绿地和水体能有效缓解银川市城市热岛效应且后者对降低城市地表温度的效果要好于前者.
以国家重点生态功能区县域环境监测质量评价为目标,综合应用德尔菲法、层次分析法和模糊综合评价法,构建了国家重点生态功能区县域环境监测质量评价方法,并确定了评价因子、权重系数、计算方法.该方法评价指标共分为三层:第一层为目标层,即国家重点生态功能区县域环境监测质量;第二层为准则层,包括人员及资质、现场监测、实验室管理、报告编制及数据上报;第三层为方案层,包括人员操作、持证上岗、资质认定、人员培训、水质布点采样流转情况、空气自动站运维情况、现场质控实施情况、实验室环境条件、样品试剂的保存与管理、仪器检定与校准、实验室质量控制实施情况、数据填报软件运行情况、监测报告规范性等13个评价要素.经矩阵一致性检验确定了各评价要素的权重,将该权重与各要素得分运算后得到县域环境监测质量评价结果.在此基础上,选取广东、山西、陕西、四川和青海等5个省份的15个国家重点生态功能区县域作为典型区开展了实地调研,并应用评价体系对其进行了监测质量等级评价.结果表明,15个典型县域中,环境监测质量等级为优的县域占13. 3%,一般、较差的县域分别占66. 7%、20%.县域环境监测承担单位在资质、报告编制及数据上报方面表现较好,在现场监测、人员操作方面问题突出,在实验室管理方面有待提升.
The establishment of the Sanjiangyuan National Park (SNP) favours implementation of strictest ecological protection on the Tibetan Plateau, thus firmly ensuring national ecological security. To understand ecological background in the SNP, spatial and temporal variations of ecosystem, and its services during the period 2000–2015 and significance identification were analysed by using the methods of remote sensing, GIS and model simulation. The results showed that: (1) Area with extremely important ecosystem services accounted for approximately 51.4% of the SNP’s total area, of which extreme importance water regulation, soil conservation and sand fixation regions contributed 15.3%, 13.7% and 22.4%, respectively. (2) The SNP had formed a spatial pattern of ecosystem services with water regulation as core in the eastern part, soil conservation as core in the central part and sand fixation as core in the western part. (3) For the period 2000–2015, water regulation service generally improved in the SNP. Soil conservation service also improved overall; and sand fixation service exhibited a decreasing trend due to reduction in wind speed and vegetation coverage. (4) Climate warming and humidification, combined with the implementation of ecological protection project in the SNP were the primary reasons for ecosystem services improvement. However, grassland degradation had not yet been fundamentally suppressed, and vegetation coverage was still declining in regional areas. For strict protection and sustainable use of the SNP and its natural resources, overall planning and scientific layout should be paid more attention, and classification and subarea protection should be implemented based on natural ecosystem laws.
 Wei Cao (曹巍)合作论文数8
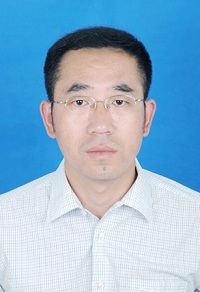 Changxin Zou (邹长新)合作论文数生态环境部南京环境科学研究所6
 Lin Huang (黄麟)合作论文数Institute of Geographic Sciences and Natural Resources Research, Chinese Academy of Sciences;University of Chinese Academy of Sciences6
 Quanqin Shao (邵全琴)合作论文数Institute of Geographic Sciences and Natural Resources Research, Chinese Academy of Sciences;University of Chinese Academy of Sciences6
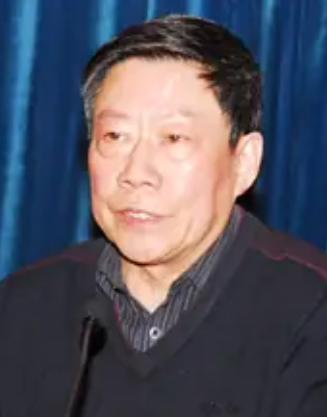 Jiyuan Liu (刘纪远)合作论文数Institute of Geographic Sciences and Natural Resources Research, Chinese Academy of Sciences5GuoLi Gong (巩国丽)合作论文数4Taoli Huhe合作论文数3Yan Wang合作论文数3YanZhong Liu (刘艳中)合作论文数3
 Jixi Gao (高吉喜)合作论文数Satellite Application Center for Ecology and Environment, Ministry of Ecology and Environment of the People's Republic of China3Naifeng Lin (林乃峰)合作论文数3Shawn McKenzie合作论文数2
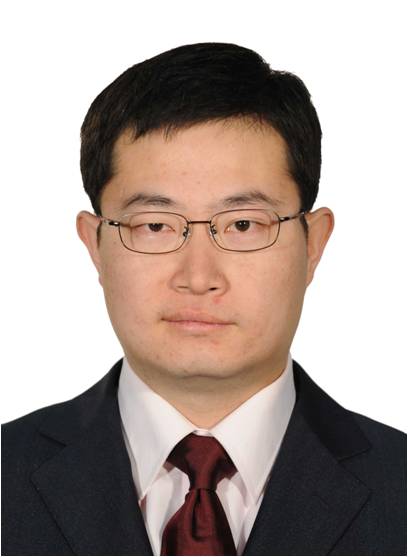 Duanyang Xu (许端阳)合作论文数University of Chinese Academy of Sciences;Institute of Geographic Sciences and Natural Resources Research, Chinese Academy of Sciences2
 Shusen Wang合作论文数2delin xu合作论文数2Lulu Liu合作论文数2MengJia Xu (徐梦佳)合作论文数2Dong Liu (刘冬)合作论文数2
 Zuo Zhang (张祚)合作论文数School of Public Administration, Central China Normal University2
 Jun Zhai (翟俊)合作论文数College of Environment and Ecology, Chongqing University2
 Guangyong You合作论文数2
 Jiangwen Fan (樊江文)合作论文数中国科学院地理科学与资源研究所2
 Muhammad Altaf Arain合作论文数School of Earth, Environment & Society, Faculty of Science, McMaster University;Department of Civil Engineering, Faculty of Engineering, McMaster University2GE Jin-song (葛劲松)合作论文数1Fan Yang (杨帆)合作论文数1Yuchuan Tan合作论文数1Yufei Han合作论文数1Xin-Yue Bao合作论文数1Xiru Jia合作论文数1Suizi Wang合作论文数1Jiahui Li合作论文数1Yaxian Zhang合作论文数1Gang Cao合作论文数1Hongyi Chen合作论文数1YUAN Ruling (袁汝玲)合作论文数1Liangyan Yang合作论文数1
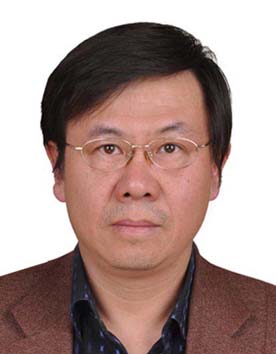 Qingbai Wu (吴青柏)合作论文数Cold and Arid Regions Environmental and Engineering Research Institute, Chinese Academy of Sciences;University of Chinese Academy of Sciences1
 Yong Chen (陈永)合作论文数Department of Soil Resources, College of Land Science and Technology, China Agricultural University1Hua JIANG (江华)合作论文数1
 Bicheng Huang合作论文数1Tong Xiao合作论文数1Lixia Wang合作论文数1Xiaohua Zhang合作论文数1Bing Xu合作论文数1




