The U.S. Department of Energy's Wave Energy Prize Competition encouraged the development of innovative deep-water wave energy conversion technologies that at least doubled device performance above the 2014 state of the art. Because levelized cost of energy (LCOE) metrics are challenging to apply equitably to new technologies where significant uncertainty exists in design and operation, the prize technical team developed a reduced metric as proxy for LCOE, which provides an equitable comparison of low technology readiness level wave energy converter (WEC) concepts. The metric is called 'ACE' which is short for the ratio of the average climate capture width to the characteristic capital expenditure. The methodology and application of the ACE metric used to evaluate the performance of the technologies that competed in the Wave Energy Prize are explained in this report.
This paper presents results of the Reference Model Project (RMP), which began five years ago to facilitate Marine Energy Conversion (MEC)
An array of boreholes, drilled through a regionally continuous hydrologically confining layer of sediments into extrusive igneous basement rocks of the Juan de Fuca Ridge eastern flank, has been instrumented with CORK hydrologic observatories for long‐term monitoring and fluid sampling. Omission of seals between nested casing strings reaching into basement at one site created a low‐resistance connection between basement and the overlying water column, and despite the natural superhydrostatic state of basement water at that location, a “runaway” condition of cold seawater downhole flow into the crust was established, which persisted for more than 4 years. The existence of this condition, along with perturbations generated by it and by initial drilling operations observed at a properly sealed hole 2.4 km away, have been used with analytic and finite element model solutions to constrain formation permeability. The minimum threshold permeability allowing stable downhole flow is roughly 4 × 10⁻¹³ m2. A value of permeability similar to this (3–4 × 10⁻¹³ m2) is estimated on the basis of the elapsed time for initial perturbations to propagate between the sites (∼2.5 days). The amplitude of the long‐term flow perturbation observed at the sealed site (roughly 1.7 kPa) is smaller than that predicted by modeling (5–10 kPa). Models for flow in an anisotropically permeable layer show that this could be the consequence of low vertical permeability (e.g., arising from massive volcanic or sediment interlayering) or high permeability in the direction of the tectonic fabric generated at the ridge axis. Disagreement between the permeabilities estimated here with previous large‐scale estimates appropriate for the cross‐strike direction (the primary direction between the borehole sites) (10−10–10−9 m2) is difficult to reconcile; it is possible that the holes are poorly connected to zones of high permeability that facilitate the large lateral fluid and heat fluxes previously inferred at this young crustal site.
We investigate transient fluid flux through the seafloor recorded near the Costa Rica trench during the 2000 Costa Rica Seismogenic Zone Experiment using a 2‐D fully coupled poroelastic finite element model. We demonstrate that the observed hydrologic anomalies are consistent with a model of propagating slow slip at the subduction interface between the frontal prism and downgoing plate. There are two sources of volumetric strain that drive fluid flux at the seafloor in response to fault slip at depth: (1) compression and dilation in the vicinity of the tips of a slipping patch and (2) extension and compression due to flexure of the seafloor. The superposition of these two effects results in distinctive spatial and temporal patterns of fluid flow through the seafloor. In a forward modeling approach, time series from shear ruptures with a range of fault length‐to‐depth ratios in a heterogeneous crust are generated and compared with flow rate observations. Assuming a constant propagation rate and an elliptical profile for the distribution of slip along the decollement, the set of model predictions enables us to infer the probable rupture location, extent, propagation velocity, and duration from a single flow rate time series. The best fit model suggests that the slow slip event initiated within the toe at a depth of less than 4 km and propagated bilaterally at an average rate of 0.5 km d−1. This interpretation implies that stress in the shallow subduction zone is relieved episodically. Furthermore, the Costa Rica data suggest that episodic slow slip events may initiate in the prism toe without being triggered by a seismic event further downdip.
To enable testing of the hypothesis that fluid flow from cold seeps responds to episodic tectonic events, we have developed a flow meter with a temporal resolution on the order of minutes. The Optical Tracer Injection System (OTIS) measures flow rates through the sediment‐water interface (SWI) of 0.1 to >500 m/yr ± 10%, samples fluid for postrecovery chemical analysis, and is adaptable for use as a long‐term real‐time monitoring station. Laboratory and in situ testing demonstrate that the instrument meets temporal accuracy and resolution requirements necessary to detect transient flow events. In a deployment at an active seep site in Monterey Bay, the OTIS measured flow rates with tidal period variability. Time series analysis indicates flow rate and tide height records are in phase. This flow rate response to tides, together with seep fluid temperatures measured at the SWI of greater than 9°C, suggests the seep is connected via a highly permeable fracture or other conduit to an overpressured aquifer at a depth of at least 110 m. We infer the hydrogeology of this well‐like system is further complicated by additional fluid sources since 3He/4He ratios are elevated, and there is a lack of correlation between flow rate and temperature records at frequencies lower than tidal frequencies. This short‐duration deployment demonstrates the OTIS's potential to capture flow and chemistry transients associated with earthquakes and creep in the offshore environment.
Detecting seafloor deformation events in the offshore convergent margin environment is of particular importance considering the significant seismic hazard at subduction zones. Efforts to gain insight into the earthquake cycle have been made at the Cascadia and Costa Rica subduction margins through recent expansions of onshore GPS and seismic networks. While these studies have given scientists the ability to quantify and locate slip events in the seismogenic zone, there is little technology available for adequately measuring offshore aseismic slip. This dissertation introduces an improved flow meter for detecting seismic and aseismic deformation in submarine environments. The value of such hydrologic measurements for quantifying the geodetics at offshore margins is verified through a finite element modeling (FEM) study in which the character of deformation in the shallow subduction zone is determined from previously recorded hydrologic events at the Costa Rica Pacific margin. Accurately sensing aseismic events is one key to determining the stress state in subduction zones as these slow-slip events act to load or unload the seismogenic zone during the interseismic period. One method for detecting seismic and aseismic strain events is to monitor the hydrogeologic response to strain events using fluid flow meters. Previous instrumentation, the Chemical Aqueous Transport (CAT) meter which measures flow rates through the sediment-water interface, can detect transient events at very low flow-rates, down to 0.0001 m/yr. The CAT meter performs well in low flow rate environments and can capture gradual changes in flow rate, as might be expected during ultra slow slip events. However, it cannot accurately quantify high flow rates through fractures and conduits, nor does it have the temporal resolution and accuracy required for detecting transient flow events associated with rapid deformation. The Optical Tracer Injection System (OTIS) developed for this purpose is an electronic flow meter that can measure flow rates of 0.1 to >500 m/yr at a temporal resolution of 30 minutes to 0.5 minutes, respectively. Test deployments of the OTIS at cold seeps in the transpressional Monterey Bay demonstrated the OTIS functionality over this range of flow environments. Although no deformation events were detected during these test deployments, the OTIS's temporally accurate measurements at the vigorously flowing Monterey Bay cold seep rendered valuable insight into the plumbing of the seep system. In addition to the capability to detect transient flow events, a primary functional requirement of the OTIS was the ability to communicate and transfer data for long-term real-time monitoring deployments. Real-time data transfer from the OTIS to the desktop was successful during a test deployment of the Nootka Observatory, an acoustically-linked moored-buoy system. A small array of CAT meters was also deployed at the Nootka transform-Cascadia subduction zone triple junction. Four anomalous flow rate events were observed across all four meters during the yearlong deployment. Although the records have low temporal accuracy, a preliminary explanation for the regional changes in flow rate is made through comparison between flow rate records and seismic records. The flow events are thought to be a result of a tectonic deformation event, possibly with an aseismic component. Further constraints are not feasible given the unknown structure of faulting near the triple junction. In a final proof of concept study, I find that use these hydrologic instruments, which capture unique aseismic flow rate patterns, is a valuable method for extracting information about deformation events on the decollement in the offshore subduction zone margin. Transient flow events observed inthe frontal prism during a 1999-2000 deployment of CAT meters on the Costa Rica Pacific margin suggest episodic slow-slip deformation events may be occurring in the shallow subduction zone. The FEM study to infer the character of the hypothetical deformation event driving flow transients verify that indeed, a shallow slow-slip event can reproduce the unique flow rate patterns observed. Along (trench) strike variability in the rupture initiation location, and bidirectional propagation, is one way to explain the opposite sign of flow rate transients observed at different along-strike distances. The larger question stimulated by this dissertation project, is: What are the controls on fault mechanics in offshore subduction zone environments? It appears the shallow subduction zone plate interface doesn't behave solely in response to frictional properties of the sediment lining the decollement. Shallow episodic slip at the Costa Rica Pacific margin and further north off Nicaragua, where a slow earthquake broke through the shallow 'stable-sliding' zone and resulted in a tsunami, are potentially conceived through the normally faulted incoming basement topography. Scientists should seek to map out the controls of faulting mechanics, whatever they may be, at all temporal and spatial scales in order to understand these dynamic subduction zone systems. The quest to understanding these controls, in part, requires the characterization of aseismic and seismic strain occurring over time and space. The techniques presented in this dissertation advance scientists' capability for quantifying such strains. With the new instrumentation presented here, long-term real- time observatory networks on the seafloor, and modeling for characterization of deformation events, the pieces of the subduction zone earthquake cycle puzzle may start to come together
A team from Woods Hole Oceanographic Institution (WHOI; Woods Hole, Mass.) recently developed and successfully deployed a buoy‐based ocean observatory that uses acoustic communication to retrieve data from sensors in the water column and on the seafloor out to ranges of about three kilometers from the buoy (Figure 1).Each buoy is equipped with an Iridium satellite link that can transmit more than one megabyte of data per day to shore. The near‐real‐time data provided by this system, and two‐way communication that enables control of sensors from shore, affords new opportunities for observing episodic events—such as earthquakes, volcanic eruptions, and phytoplankton blooms—and changing ocean conditions over seasons and years, or during times of the year when measurements from shipboard platforms are simply not possible.
 Michael D. Tryon合作论文数Scripps Institution of Oceanography, University of California5
 David R. Hilton合作论文数Scripps Institution of Oceanography, University of California, San Diego4
 e fueri合作论文数3kenneth m brown合作论文数3Robert S. Detrick合作论文数3
 Lee Freitag合作论文数Acoustic Communications Group, Woods Hole Oceanographic Institution3C. Geoffrey Wheat合作论文数Global Undersea Research Unit;University of Alaska Fairbanks;Global Undersea Research Unit, University of Alaska Fairbanks3Earl Davis合作论文数Pacific Geoscience Centre, Geological Survey of Canada3
 Yuri Fialko合作论文数Scripps Institution of Oceanography, University of California, San Diego3R. Meldrum合作论文数2
 Sean Toczko合作论文数2Ulrike Schacht合作论文数2
 Demian M Saffer合作论文数Department of Geological Sciences, Jackson School of Geosciences, University of Texas at Austin2
 Achim Kopf合作论文数MARUM - Center for Marine Environmental Sciences, Research Faculty University of Bremen2
 Roberta Hansman合作论文数2
 Gary McMurtry合作论文数2
 Warner Bruckmann合作论文数Research Center Ocean Margins, University of Bremen2e furi合作论文数1Jonathan Ware合作论文数1Dan Frye合作论文数1Dale Jenne合作论文数1Kevin M. Brown合作论文数1Ann Dallman合作论文数1
 Helge Niemann合作论文数1
 Michael Lawson合作论文数1Jochem Weber合作论文数National Renewable Energy Laboratory1
 Rachel Lauer合作论文数Department of Geoscience, University of Calgary1
 Sebastian Hammerschmidt合作论文数1
 Vincent S. Neary合作论文数Water Power Technologies, Sandia National Laboratories1
 r w thresher合作论文数Natl Renewable Energy Lab1
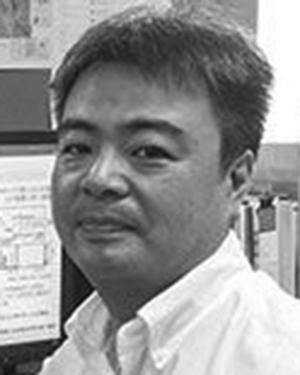 Eiichiro Araki合作论文数1
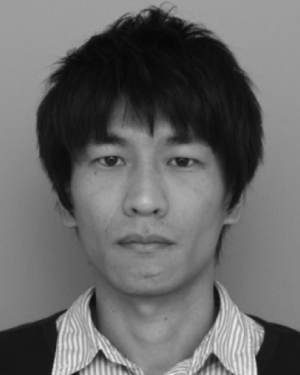 Kazuya Kitada合作论文数1
 Kelley Ruehl合作论文数Water Power Technol., Sandia Nat. Labs.;c;Water Power Technol., Sandia Nat. Labs.1
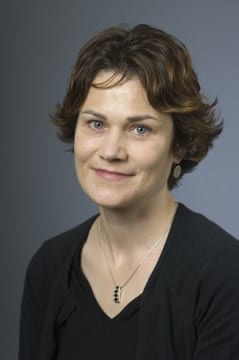 Katrina Edwards合作论文数University of Southern California1
 Budi Gunawan合作论文数Oak Ridge National Laboratory, Oak Ridge National Laboratory1Haddad Amanda G合作论文数1
 Andrew T. Fisher合作论文数Department of Earth & Planetary Sciences, University of California, Santa Cruz;Physical & Biological Sciences Division, Institute of Marine Sciences, University of California, Santa Cruz1
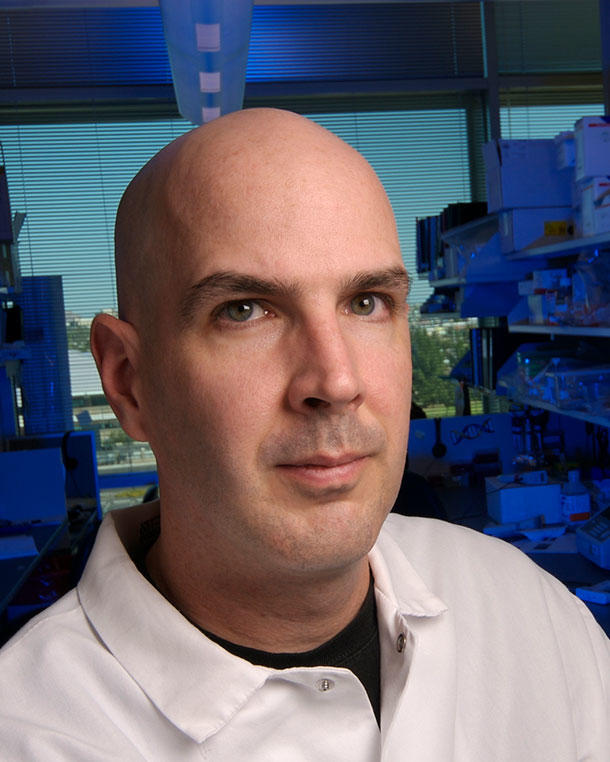 Kevin Brown合作论文数Laboratory of Translational Genomics, National Cancer Institute, National Institutes of Health;Division of Cancer Epidemiology & Genetics, National Cancer Institute, National Institutes of Health1John A. Collins合作论文数Department of Obstetrics and Gynecology, McMaster University1
 Matthew Grund合作论文数Oceanographic Institution;Massachusetts Institute of Technology;Oceanographic Institution, Massachusetts Institute of Technology1Yukari Kido合作论文数1
 Jennifer Delaney合作论文数Department of Education Policy, Organization & Leadership, College of Education, University of Illinois at Urbana-Champaign1
 Scott J. Beatty合作论文数1John R. Delaney合作论文数1Keir Becker合作论文数1
 Mirko Previsic合作论文数1
 William S. D. Wilcock (William Wilcock)合作论文数School of Oceanography, College of the Environment, University of Washington1Jiangheng He合作论文数1




