Permeability in the Ieistareykir geothermal system of Iceland is structurally controlled. Natural fracture networks are abundant in Ieistareykir and contribute significantly to fluid flow. Understanding which features enhance permeability and hydraulic conductivity, and how their properties interact with lithology and reservoir structure, is key to predicting reservoir behaviour. To address this, we utilise a range of borehole data to characterise natural fractures in terms of their occurrence, orientation, relative distribution, their relationship with the major lithological units and permeable flow zones in the subsurface. Results show systematic variations in fracture density, thickness, and distribution pattern across different lithologies and depths, with orientations ranging from NNW-SSE, N-S, NNE-SSW to NE-SW. Fractures exhibit the highest intensity in the deeper acidic intrusive units or coarser grained basalt with a predominant N-S-trend and bimodal dip distribution. However, permeability is controlled by a complex interplay of fracture geometry, openness and connectivity rather than simply high fracture abundance or a preferential set of fractures. Permeable feed zones show diverse structural expressions, ranging from high-density fracture clusters and large-aperture fractures to intensely fractured damage zones and multiple intersecting fracture sets. These findings demonstrate that the structural character of the potential fluid-flow channels is highly variable in Ieistareykir. The results of this study can be incorporated into fracture and flow models to enhance our understanding of the permeability distribution and fluid pathways in the Ieistareykir geothermal system.
Mapping of fracture networks is critical to the exploration and responsible exploitation of geothermal resources. Fractures provide the permeable pathways required for efficient heat extraction and knowledge of their subsurface distribution is necessary for optimal well placement and reservoir modelling. Additionally, fractures play a significant role in induced seismic hazards both by decreasing rock strength and by providing hydraulic connections between fluid injection/extraction sites and surrounding fault networks that may slip in response to pore pressure perturbations. However, constraining fracture distributions in 3D can be challenging. Geologic mapping provides limited information regarding how these systems evolve with depth and exploratory drilling is expensive and only provides point-wise constraints that may not reflect larger-scale trends. Seismic imaging utilising local earthquakes provides a cost-effective means to overcome these issues and map fractures at the reservoir scale. In this contribution, we constrain the anisotropic P-wave velocity structure of the Hengill Geothermal Field (Iceland) using arrival times from natural and induced seismicity. A Bayesian Monte Carlo sampling approach is used to construct likely velocity models and posterior parameter distributions from which we evaluate hypotheses for fracture properties. The imaged slow P-wave propagation directions constrain the average 3D fracture plane orientations while the degree of alignment and extent of fracturing is inferred from the strength of velocity anisotropy. Our models reveal significant spatial heterogeneity in these fracture properties throughout the Hengill geothermal system. We explore possible mechanisms behind this heterogeneity (e.g. deformation related to topographic loading, tectonic and magmatic stresses, and geothermal energy production) and its relationship to local seismicity patterns.
In this work, we examine three models for representing fractures with non-uniform stiffness due to stress. The first is an effective medium model that maps fracture properties onto a Transversely Isotropic medium. The second represents each fracture explicitly, modeling the two surfaces and the displacement discontinuity boundary conditions. The third is a localized effective medium (LEM), which models a thin zone around each fracture as an effective medium while leaving the rest of the material unchanged. We apply all three models to simulate a laboratory experiment where waves propagated through multiple parallel fractures under controlled conditions. To evaluate the models, we first conduct numerical experiments using the Bandis et al. (1983) stress-dependent stiffness approach, comparing the resulting waveforms. We find that the explicit and LEM models generally agree well. Next, we compare the waveforms for waves propagating parallel and perpendicular to the fractures with the experimental data. Both the explicit fracture model and the LEM reproduce many observed effects on wave propagation, including waveform changes due to fracture orientation and stiffness variation. These results demonstrate that both explicit and localized effective medium models reliably capture the impact of fractures on seismic waves. This validates their use in forward modeling of wave propagation in fractured media and supports their application in inversion workflows to estimate fracture properties from waveform data.
Properties of the mantle are difficult to constrain and critical for controlling mantle evolution and dynamics. We attempt to constrain these properties by comparing the outputs from mantle circulation models (MCMs) to 9 disparate observations. Over 250 MCMs driven at the surface by 1 Ga of plate motion history are considered. A metric is developed to quantify the fit/misfit between each observation and MCM prediction. The observations include, global seismic tomography, SOLA seismic inference of the Pacific upper mantle, global surface wave phase velocity data set, gradients of seismic velocity in the deep mantle, dynamic topography, geoid, geomagnetic reversals, temperature difference between MORB and OIB source regions, and the difference in amount of recycled oceanic crust in MORB versus OIB source regions. The comparisons are done with (i) heatmaps of each metric for each MCM, (ii) correlation between the metrics and input parameters, (iii) analyses of sub-sets where only a single MCM parameter is changed, (iv) random forest analysis where the importance and partial dependence plot of MCM parameters are produced for each metric. From this analysis we find that parameters can be constrained, including for example the temperature at the core mantle boundary, the preferred equation of state, the preferred plate motion history model, the presence of a basal layer, the buoyancy number of the recycled basalt, viscosity profile. For example the MCMs prefer a cooler core-mantle boundary, a mantle reference frame-based plate motion history, a Murnaghan EoS and a basalt buoyancy number in the lower mantle of around 0.4-0.5. Methods, analyses and further results will be presented.
Scientific exploration of the UK and Ireland's subsurface has made important contributions to scholarship and prosperity for people and the planet, including economic growth, sustainable use of natural resources, storage of greenhouse gases, and inspiring curiosity about the Earth beneath our feet. This article outlines a vision for an array of seismological instruments spanning the UK and Ireland, UKI Array, augmented by other types of geophysical sensors, to maximise the value offered by existing equipment pools. The mission is to research natural phenomena and structure in the deep and shallow Earth, to solve problems concerning hazards and resources, to connect scientists to schools and the broader public, and thus to inspire a new generation to learn about geophysics. The vision was created through a community driven process of engagement and participation. This paper describes the concept and design of the UKI-Array; a companion paper discusses related opportunities and potential applications.
Abstract The United Kingdom's shallow aquifers offer significant but underdeveloped geothermal energy resource. Seismic methods can help address this by improving the understanding of aquifer heterogeneity and potentially allowing long‐term monitoring of thermal plumes. Here, we consider the derivation of seismic velocity and attenuation models from borehole distributed acoustic sensing (DAS) data, recorded on the University of Leeds Geothermal Campus. We record active‐source seismic shots in a 250 m‐long vertical cable that samples two fractured sandstone aquifers (Elland Flags and Rough Rock). Compressional wave velocities ( v P ) are obtained to 160 m depth and are typically 3100 ± 50 m s −1 through the Elland Flags. To predict the value of v P for thermal monitoring, we simulate groundwater warming in a Hashin–Shtrikman petrophysical framework, which suggests that ±50 m s −1 precision is sufficient to detect heating >26°C (>14°C above ambient temperature). Although this is at the upper range of likely temperature change in a shallow geothermal system under typical usage, UK environmental legislation restricts heating to <25°C; therefore, our approach could be used to support the monitoring of operational compliance. Refining both the DAS acquisition and measurement of seismic quantities ( v P and quality factor) should improve precision and thus facilitate monitoring of more subtle heating expressions.
Soil structure degradation, particularly due to compaction and unstable watering regimes, poses significant challenges to sustainable agriculture. This problem is often exacerbated by inefficient irrigation management, irregular rainfall distribution, tillage processes and the cumulative effects of regular field traffic from agricultural machinery. These variables cumulatively diminish the soil’s structural stability, decreasing its ability to support plant development and increasing vulnerability to erosion and productivity loss. This study aims to understand how agricultural soils respond to wetting-drying cycles under various watering regimes, with a particular emphasis on changes in soil compaction. Furthermore, it assesses the ability of seismic surveys to continually and accurately detect volumetric changes and compaction dynamics caused by these regimes. To achieve this, seismic surveys, potentially expanded to fibre-optic distributed acoustic sensing, offer significant potential for high-resolution monitoring of subsurface soil dynamics, including indicators of soil compaction and soil densification. This method may offer new opportunities and a scalable approach for real-time monitoring of soil structure and compaction changes. To improve the reliability of survey data interpretation, additional validation will be conducted through in-situ measurements at the research site and geotechnical laboratory analyses. The results of this study are expected to provide new insights into the use of seismic survey techniques for real-time monitoring of soil compaction in precision agriculture. By enabling early detection and management of compaction-related issues, these findings can support the development of more effective and sustainable soil management strategies.
Seismic signals generated by near-surface explosions, with sources including industrial accidents and terrorism, are often analysed to assist post-detonation forensic characterization efforts such as estimating explosive yield. Explosively generated seismic displacements are a function of, amongst other factors: the source-to-receiver distance, the explosive yield, the height-of-burst or depth-of-burial of the source and the geological material at the detonation site. Recent experiments in the United States, focusing on ground motion recordings at distances of $< 15\,$ km from explosive trials, have resulted in empirical models for predicting P-wave displacements generated by explosions in and above hard rock (granite, limestone), dry alluvium, and water. To extend these models to include sources within and above saturated sediments we conducted eight explosions at Foulness, Essex, UK, where $\sim 150\,$ m thicknesses of alluvium and clay overlie chalk. These shots, named the Foulness Seismoacoustic Coupling Trials (FSCT), had charge masses of 10 and 100 kg TNT equivalent and were emplaced between 2.3 m below and 1.4 m above the ground surface. Initial P-wave displacements, recorded between 150 and 7000 m from the explosions, exhibit amplitude variations as a function of distance that depart from a single power-law decay relationship. The layered geology at Foulness causes the propagation path that generates the initial P-wave to change as the distance from the source increases, with each path exhibiting different amplitude decay rates as a function of distance. At distances up to 300 m from the source the first arrival is associated with direct propagation through the upper sediments, while beyond 1000 m the initial P-waves are refracted returns from deeper structure. At intermediate distances constructive interference occurs between P-waves propagating through the upper sediments and those returning from velocity-depth gradients at depths between 100 and 300 m. This generates an increase in displacement amplitude, with a maximum at $\sim 800\,$ m from the source. Numerical waveform modelling indicates that observations of the amplitude variations is in part the consequence of high P- to S-wave velocity ratios within the upper 150 m of saturated sediment, resulting in temporal separation of the P and S arrivals. We extend a recently developed empirical model formulation to allow for such distance-dependent amplitude variations. Changes in explosive height-of-burst within and above the saturated sediments at Foulness result in large P-wave amplitude variations. FSCT surface explosions exhibit P-wave displacement amplitudes that are a factor of 22 smaller than coupled explosions at depth, compared to factors of 2.3 and 7.6 reported for dry alluvium and granite, respectively.
Distributed acoustic sensing (DAS), a technology that exhibits great potential for subsurface monitoring and imaging, has been regarded as a preeminent instrument for vibration measurements. In light of the tremendous amount of seismic data, numerous channels, and elevated noise levels, it becomes imperative to suggest an appropriate denoise procedure that is compatible with DAS data. In this regard, unsupervised deep learning with data clustering generally exhibits superior performance in facilitating the efficient analysis of sizable unlabeled data sets devoid of human bias. In addition, the clustering method is capable of detecting seismic waves, microseismic turbulence, and even unidentified new types of negligible seismic events, in contrast to a number of conventional denoising techniques. While current approaches reliant on f-k analysis remain valuable, they fail to fully exploit the information present in the wavefield due to their inability to identify the characteristic moveout observed in seismic data. In order to denoise DAS data more effectively, we investigate the capacity of the curvelet transform to extend existing deep scattering network methodologies. In this paper, we propose a novel clustering approach for the denoise processing of DAS data that utilises the Gaussian Mixture Model (GMM), curvelet transform, and unsupervised deep learning. The DAS data are initially subjected to the curvelet transform in order to derive the curvelet coefficients at various scales and orientations, which can be regarded as the first layer of extracted features. Following this, a deeper layer of features is obtained by applying the curvelet transform to the coefficients in the first layer. The aforementioned process continues in this manner until the depth of the layer satisfies the algorithm-determined expectation. By concatenating the curvelet coefficients from each layer, the original DAS data's features are generated. Afterwards, the signal is reduced to two dimensions using principal component analysis (PCA), which simplifies its interpretation by projecting the high-dimensional features onto two principal components, which facilitates the clustering of the features by GMM for achieving the final clustered results.This methodology operates without the need for labels of DAS data and is highly appropriate for managing the substantial quantity and numerous channels of DAS. We used a variety of approaches, such as Bayesian information criteria and silhouette analysis, to determine the optimal number of clusters in GMM and evaluate the algorithm's clustering performance. We demonstrate the method on downhole data acquired during stimulation of the Utah FORGE enhanced geothermal system, and the results appear quite satisfactory, indicating that it can be utilised effectively to denoise DAS signals.
Mantle circulation in the Earth acts to remove heat from its interior and is thus a critical driver of our planet’s internal and surface evolution. Numerical mantle circulation models (MCMs) driven by plate motion history allow us to model relevant physical and chemical processes and help answer questions related to mantle properties and circulation. Predictions from MCMs can be tested using a variety of observations. Here, we illustrate how the combination of many disparate observations leads to constraints on mantle circulation across space and time. We present this approach by first describing the set-up of the example test MCM, including the parameterization of melting, and the methodology used to obtain elastic Earth models. We subsequently describe different constraints, that either provide information about present-day mantle (e.g. seismic velocity structure and surface deflection) or its temporal evolution (e.g. geomagnetic reversal frequency, geochemical isotope ratios and temperature of upper mantle sampled by lavas). We illustrate the information that each observation provides by applying it to a single MCM. In future work, we shall apply these observational constraints to a large number of MCMs, which will allow us to address questions related to Earth-like mantle circulation.
Urban geothermal solutions to heating and cooling have developed slowly in the UK, partly due to limited understanding of subsurface heat flow regimes and how stored heat might be sustainably governed within heterogeneous aquifers. Understanding heat flow through various aquifers is the goal of the SmartRes project, in which heat flow trials will be conducted in a number of sites. To provide context for heat flow experiments in a fractured chalk aquifer, geophysical surveys were acquired at Trumplett’s Farm, a groundwater abstraction and monitoring site near Reading (Berkshire, UK). Here, groundwater flow is primarily within a fracture network, likely in an active zone within the upper 10 m of the saturated chalk. Seismic surveys recorded energy generated with an impact source at surface geophones (24 cabled GEODE, and 20 nodal Smart-Solo, geophones) and hydrophone strings, deployed to 100 m depth in boreholes drilled at the site. Smart-Solo nodes were deployed in a ~10 x 5 m grid at the site, with cabled geophones occupying lines between adjacent boreholes, with geophone intervals of up to 2 m. Nodal geophones recorded passively throughout the 3-day deployment and will be analysed using ambient noise correlation to evaluate anisotropy. The remaining data has been used for preliminary analysis with MASW (Multichannel Analysis of Surface Waves), P-wave refraction velocities, and vertical seismic profiles (VSPs). MASW analyses suggest shear wave velocity (Vs) ranges from 250-600 m/s in the uppermost 1.5 m, but estimates are challenging given poor dispersion imaging of the fundamental mode. Different source-receiver offsets were tested to eliminate mode superposition, but the best dispersion curves are observed for zero-offset shots. Data were processed in a commercially available software with relatively limited freedom to adjust inversion parameters, hence further analysis will use the MuLTI code to undertake a constrained Monte Carlo inversion approach. The deeper structure of the chalk was characterised in VSPs, indicating reflective P-wave horizons at 52 and 69 m depth, separating material with interval velocities of ~2100 m/s, ~2500 m/s and 3000 m/s. Observing these reflections required aggressive frequency-wavenumber filtering to suppress direct waves in the water column. Electrical resistivity tomography (ERT) surveys were conducted using the BGS PRIME ERT system to optimise array configuration for long-term monitoring. The reconnaissance survey included in-hole, borehole-to-surface, and surface ERT at 1 m intervals, employing C1P1-C2P2 bipole-bipole and dipole-dipole arrays around the site. Preliminary ERT inversion revealed low resistivity zones within the top 1.5 – 2 m across the site and mapped a potential south-dipping high resistivity structure. A longer ERT survey spread is planned to better reveal hydrodynamic interactions at deeper depths. This initial insight will be refined with a fibre-optic distributed acoustic sensing deployment at the Trumplett’s site and an optimised repeat of the BGS PRIME ERT array. These will be synchronous with a thermal response test at the Trumplett’s site monitored with distributed temperature sensing. Keywords: Seismic analysis, ERT, geothermal investigation, fractured aquifer, aquifer thermal energy storage
Rift volcanoes worldwide present significant hazards to people from eruptions but also provide resources such as geothermal energy. Aluto volcano in the Ethiopian rift is a hotspot for geothermal power exploitations, despite significant periods of deformation in the last 15 years. Various geophysical imaging methods have been applied to Aluto to obtain a detailed 3D image of the hydrothermal reservoir and the location, geometry, and size of possible magma bodies. However, the models give a single or narrow range of answers without the possibility for the exploration of uncertainties arising from the data and assumptions. Here we address this current limitation for the seismic data by performing a fully nonlinearized joint inversion of local seismic P- and S-wave travel times, and surface wave dispersion data between 0.5 Hz and 2 Hz from empirical Green's functions, for the location of earthquakes and the velocity of the subsurface. The combination of data types helps reduce the range of permitted models. We use a reversible-jump Markov chain Monte Carlo approach to incorporate prior information and, from our data, retrieve the posterior probability of earthquake parameters and seismic velocity in a Bayesian sense. This provides rigorous distributions of the covariance of the earthquake and velocity parameters. Our 3D seismic models display areas of elevated Vp/Vs ratio at 2-6 km depth under the caldera, interpreted as areas of partial melt. The hydrothermal reservoir shows in our results as lower Vp/Vs. This is in good agreement with the previous resistivity models from the magnetotelluric study of Samrock et al. 2020. However, while Samrock et al. observed two zones of partial melt, our model suggests that the lower and upper melt zones are connected. To go one step further, we developed a workflow to link seismic velocities to melt fraction estimates by combining the posterior distributions of seismic velocity and thermodynamic modeling. We conclude that the melt fraction under Aluto is between 3 and 7 % at 5 km depths, and the melt volume is approximately 0.37 km3.
The rate of ice loss from marine terminating glaciers is governed by both surface runoff and ice dynamics. Although ice loss due to runoff can be relatively easily studied using in-situ and remote sensing methods, ice dynamics are more difficult to constrain and are the largest contributor to uncertainty in ice loss estimates. By recording and locating the source of seismic signals released during (e.g.) crevasse opening and stick-slip events, we can obtain a spatial and temporal distribution of icequakes. This will allow for estimates of stress and strain within Sermeq Kujalleq (Store Glacier), West Greenland. The emerging technology of distributed acoustic sensing (DAS) offers the ability to perform seismic surveys at higher spatial sampling resolutions than is feasible with conventional geophone deployments. This is especially true when instruments are required to be deployed in a logistically challenging environment such as Store Glacier. Here, we present an icequake source location method that exploits the dense spatial sampling of DAS alongside the directionality and increased signal to noise ratio of 3-component geophones. Both instruments were deployed in closely drilled boreholes on Store Glacier in July 2019, as part of the RESPONDER project. The DAS fiber optic cable was deployed in a 1043 m deep borehole. The three geophones are at depths of 100 m, 250 m and 400 m. The data set includes controlled-source vertical seismic profiles (VSPs) and a 3-day passive record of cryoseismicity recorded by both instrument types. Previous work on the passive DAS dataset created a convolutional neural network-based method that performs efficient signal detection in the frequency-wavenumber domain and provided a catalogue of detections at a mean rate of 4074 per hour. The next step is to locate the catalogued seismic sources in targeted time periods containing arrivals. Our borehole DAS deployment only records the vertical component of a seismic signal because of the fiber optic cable’s sensitivity only to strain along its longitudinal axis. This renders it impossible to determine the backazimuth of arrivals solely using the DAS data. To overcome this limitation, we analyse the particle motion recorded by the 3-component geophones. The 3D source location can be derived using well-resolved estimates of source depth and distance from the DAS data, plus the backazimuth gained from geophones. Our initial results include an estimated location of the source of one large icequake at ~800 m offset from the borehole and ~300 m depth. The backazimuth of these arrivals is yet to be determined, but the depth of this event suggests it may originate from an englacial shear zone related to a temperature anomaly that we have inferred in Store Glacier from distributed temperature sensing. Once efficiently automated, we aim to combine the seismic observations to build a catalogue of seismicity, including event time and origin location. Additional work aims to estimate moment tensors of these detected and located events to improve our understanding of Store Glacier’s dynamics.
It is widely believed that seismic anisotropy in the lowermost mantle is caused by the flow-induced alignment of anisotropic crystals such as post-perovskite. What is unclear, however, is whether the anisotropy observations in the lowermost mantle hold information about past mantle flow, or if they only inform us about the present-day flow field. To investigate this, we compare the general and seismic anisotropy calculated using Earth-like mantle convection models where one has a time-varying flow, and another where the present-day flow is constant throughout time. To do this, we track a post-perovskite polycrystal through the flow fields and calculate texture development using the sampled strain rate and the visco-plastic self-consistent approach. We assume dominant slip on (001) and test the effect of the relative importance of this glide plane over others by using three different plasticity models with different efficiencies at developing texture. We compare the radial anisotropy parameters and the anisotropic components of the elastic tensors produced by the flow field test cases at the same location. We find, under all ease-of-texturing cases, the radial anisotropy is very similar (difference <2%) in the majority of locations and in some regions, the difference can be very large (>10%). The same is true when comparing the elastic tensors directly. Varying the ease-of-texture development in the crystal aggregate suggests that easier-to-texture material may hold a stronger signal from past flow than harder-to-texture material. Our results imply that broad-scale observations of seismic anisotropy such as those from seismic tomography, 1-D estimates and normal mode observations, will be mainly sensitive to present-day flow. Shear-wave splitting measurements, however, could hold information about past mantle flow. In general, mantle memory expressed in anisotropy may be dependent on path length in the post-perovskite stability field. Our work implies that, as knowledge of the exact causative mechanism of lowermost mantle anisotropy develops, we may be able to constrain both present-day and past mantle convection.
During February 2023, a total of 32 individual distributed acoustic sensing (DAS) systems acted jointly as a global seismic monitoring network. The aim of this Global DAS Month campaign was to coordinate a diverse network of organizations, instruments, and file formats to gain knowledge and move toward the next generation of earthquake monitoring networks. During this campaign, 156 earthquakes of magnitude 5 or larger were reported by the U.S. Geological Survey and contributors shared data for 60 min after each event’s origin time. Participating systems represent a variety of manufacturers, a range of recording parameters, and varying cable emplacement settings (e.g., shallow burial, borehole, subaqueous, and dark fiber). Monitored cable lengths vary between 152 and 120,129 m, with channel spacing between 1 and 49 m. The data has a total size of 6.8 TB, and are available for free download. Organizing and executing the Global DAS Month has produced a unique dataset for further exploration and highlighted areas of further development for the seismological community to address.
<p>As part of a global distributed acoustic sensing (DAS) campaign, multiple DAS interrogators (from academia and industry) recorded simultaneously from 1<sup>st</sup> till 28<sup>th</sup> February 2023 in different regions of the globe. The objective is to define if and how a global monitoring system based on DAS could perform for teleseismic event record and analysis. Each participant uploaded triggered data window from earthquakes with magnitude larger than 5, as defined by global seismological networks, to a central storage location. Data was pre-processed following common filtering parameters (spatial and temporal sampling). Bottle-necks in data format, storage, and legal issues are identified and reviewed to pose the basis for a common DAS data archive strategy.</p><p>In this study, we present a selection of DAS records of the Turkey earthquake sequence, from borehole, surface, on-land, submarine telecommunication or dedicated cables all over the globe. They comprise a few kilometers long railroad track (Switzerland), an 0.8 km long deployed cable in the Limmat river, near Z&#252;rich (Switzerland), a 1 km deployed cable at Mt. Zugspitze in the Alps (Germany/Austria), a 21 km telecom cable in the forest around Potsdam (Germany), a 17 km telecom cable surface geothermal field (north Iceland), a 0.2 km borehole at Etna volcano (Italy), a telecom cable in the city of Istanbul (Turkey), a 25 km telecom cable in Melbourne (Australia), in the inner city line in Graz (Austria), in the city of Seattle, WA (USA), a submarine cable in the North Sea, a submarine cable connecting Ny &#197;lesund and Longyearbyen at Svalbard (Norway), a 0.8 km dedicated fibre in a quick clay area in Norway, amongst many others.</p><p>We show that signals from the two destructive earthquakes in Turkey were recorded all over the globe. We discuss the signal quality and their potential use to study teleseism signals. We analyze recorded strain amplitudes according to the different array geometries and the differing sensitivities to wave types (body, surface waves, possibly others) and deployment conditions. When available, comparison with other sensors located in the same place is performed. Finally, we analyze the influence of local geological conditions due to the passing large amplitudes waves.</p><p>With the increasing availability, reduced cost and improved simplicity of DAS systems and the wide spread existing fibre optic networks, we believe fibre-optic sensing will play an ever-increasing role in the global seismic monitoring.</p>
Seismic surveys are widely used to characterise the properties of glaciers, their basal material and conditions, and ice dynamics. The emerging technology of Distributed Acoustic Sensing (DAS) uses fibre optic cables as seismic sensors, allowing observations to be made at higher spatial resolution than possible using traditional geophone deployments. Passive DAS surveys generate large data volumes from which the rate of occurrence and failure mechanism of ice quakes can be constrained, but such large datasets are computationally expensive and time consuming to analyse. Machine learning tools can provide an effective means of automatically identifying seismic events within the data set, avoiding a bottleneck in the data analysis process.Here, we present a novel approach to machine learning for a borehole-deployed DAS system on Store Glacier, West Greenland. Data were acquired in July 2019, as part of the RESPONDER project, using a Silixa iDAS interrogator and a BRUsens fibre optic cable installed in a 1043 m-deep borehole. The data set includes controlled-source vertical seismic profiles (VSPs) and a 3-day passive record of cryoseismicity. To identify seismic events in this record, we used a convolutional neural network (CNN). A CNN is a deep learning algorithm and a powerful classification tool, widely applied to the analysis of images and time series data, i.e. to recognise seismic phases for long-range earthquake detection.For the Store Glacier data set, a CNN was trained on hand-labelled, uniformly-sized time-windows of data, focusing initially on the high-signal-to-noise-ratio seismic arrivals in the VSPs. The trained CNN achieved an accuracy of 90% in recognising seismic energy in new windows. However, the computational time taken for training proved impractical. Training a CNN instead to identify events in the frequency-wavenumber (f-k) domain both reduced the size of each data sample by a factor of 340, yet still provided accurate classification. This decrease in input data volume yields a dramatic decrease in the time required for detection. The CNN required only 1.2 s, with an additional 5.6 s to implement the f-k transform, to process 30 s of data, compared with 129 s to process the same data in the time domain. This suggests that f-k approaches have potential for real-time DAS applications.Continuing analysis will assess the temporal distribution of passively recorded seismicity over the 3 days of data. Beyond this current phase of work, estimated source locations and focal mechanisms of detected events could be used to provide information on basal conditions, internal deformation and crevasse formation. These new seismic observations will help further constrain the ice dynamics and hydrological properties of Store Glacier that have been observed in previous studies of the area.The efficiency of training a CNN for event identification in the f-k domain allows detailed insight to be made into the origins and style of glacier seismicity, facilitating further development to passive DAS instrumentation and its applications.
<div> <p><span data-contrast="none">Seismic anisotropy in the lowermost mantle is thought to be caused by the non-random alignment of anisotropic crystals from texturing from the mantle flowfield. Therefore, seismic anisotropy observations are commonly interpreted in the context of mantle flow. It is unclear, however, how much of an influence the history of mantle convection has on lowermost mantle seismic anisotropy and whether the present-day flowfield is sufficient for interpretation. </span><span data-ccp-props="{">&#160;</span></p> </div> <div> <p><span data-contrast="none">We investigate this by comparing the predicted anisotropy from an Earth-like mantle convection model, which includes plate motion histories from 600 Ma and a Rayleigh number of approximately 108. Therefore, these models should contain structures on similar length scales and in similar locations to the Earth. We create maps of anisotropy 50 km above the CMB using the present-day flowfield in one case and allowing the flowfield to change with time in another. For each point, we model the texture development of 500 post-perovskite crystals on their journey through the mantle to the location of interest. We then use single-crystal elastic constants to compute the full elastic tensor from the texture. To investigate what influences material properties have on the memory of mantle texture, we use three different deformation systems where we vary how easily texture can develop.</span><span data-ccp-props="{">&#160;</span></p> </div> <div> <p><span data-contrast="none">We compare the two maps by taking the difference between radial anisotropy parameters &#958; = VSH2/VSV2 and &#966; = VPV/VPH as this is what is often analysed from seismic tomography. We also present the difference in the final elastic tensors at each location because observations such as from shear wave splitting will be sensitive to more of the full elastic tensor. We find that no matter the deformation model, some regions show very different radial anisotropy strength (>10 % difference). Outside of these regions, there is little effect of a time-varying flowfield (<1 % difference) when assuming post-perovskite is easy to texture. If post-perovskite is hard to texture, the influence of mantle flowfield history has a greater effect on the final texture and therefore the anisotropy (>1 % difference). We find a similar pattern when comparing the full elastic tensors, though most regions do show some small differences. Comparing the most complex paths and quantifying the memory of the mantle shows varying results depending on the deformation models of post-perovskite and the flowfield sampled. Assuming an easy-to-deform material, the memory of the mantle was approximately 10 Ma along some paths. However, along other paths, the final texture is sensitive to flow it sampled at 125 Ma. These results show that, while a time-varying flowfield makes a significant difference along complex paths with difficult-to-texture minerals, a time-varying flowfield produces similar results to those when assuming the present-day flowfield. This work represents progress toward an understanding of the relationship between lower mantle seismic anisotropy and mantle convection. </span><span data-ccp-props="{">&#160;</span></p> </div>
 James Wookey合作论文数School of Earth Sciences, University of Leeds45
 Sebastian Rost合作论文数School of Earth and Environment, University of Leeds17
 Andrew M N Walker合作论文数15
 J-Michael Kendall合作论文数Department of Earth Sciences, University of Oxford14
 Sjoerd Antonius Leonardus de Ridder合作论文数11J. Walpole合作论文数School of Earth Sciences, University of Bristol10
 Andrew Curtis合作论文数Earth and Planetary Science, School of GeoSciences, The University of Edinburgh8
 Peidong Shi合作论文数ISTerre, University of Grenoble Alpes8
 Atalay Ayele合作论文数Seismological Department;Uppsala University;Seismological Department, Uppsala University8Matthew Wilks合作论文数7Brian Baptie合作论文数7
 Doug Angus合作论文数University of Leeds7
 Adam D. Booth合作论文数7
 Emma C. Smith合作论文数Alfred Wegener Inst, Geosci6
 Juliet Biggs合作论文数School of Earth Sciences, University of Bristol6Andrew Pretorius合作论文数5James Panton合作论文数School of Earth and Environmental Sciences, Cardiff University5Neil D. Selby合作论文数Department of Earth Sciences, University of Oxford5
 Alessandro Marco Forte合作论文数Département des sciences de la Terre et de l'atmosphère, Université du Québec à Montréal;Department of Geological Sciences, University of Florida5
 C. Roy合作论文数Sch Earth & Environm, Univ Leeds4
 J. Huw Davies合作论文数School of Earth and Environmental Sciences, Cardiff University4
 Sanyi Yuan (袁三一)合作论文数College of Geophysics, China University of Petroleum-Beijing4
 Bryn Hubbard合作论文数Institute of Geography and Earth Sciences, Aberystwyth University4
 Poul Christoffersen合作论文数Institute for Marine & Antarctic Studies, University of Tasmania4
 Bradley Lipovsky合作论文数3
 Itahisa Gonzalez Alvarez合作论文数3
 Paula Koelemeijer合作论文数1Bullard Laboratories, Department of Earth Sciences, University of Cambridge, Cambridge CB3 0EZ, United Kingdom. E-mail: pjkoelemeijer@cantab.net3Xin Zhang合作论文数Earth and Planetary Science, School of GeoSciences, The University of Edinburgh3
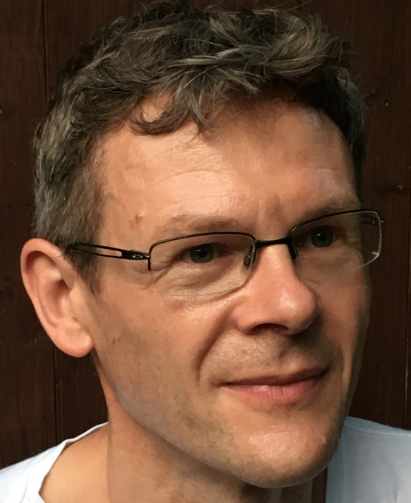 Tim Elliott合作论文数School of Earth Sciences,University of Bristol3
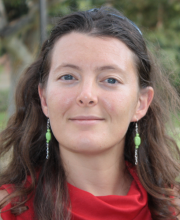 Marine Denolle合作论文数Department of Earth and Planetary Sciences, Harvard University3
 Andreas Wuestefeld合作论文数2
 Tulu Besha Bedada合作论文数2
 Emmanouil Parastatidis合作论文数2
 Emma K. Bramham合作论文数2Sacha Lapins合作论文数Sch Earth Sci, Univ Bristol2
 Voon Hui Lai合作论文数CALTECH, Seismol Lab, Pasadena, CA 91125 USA2
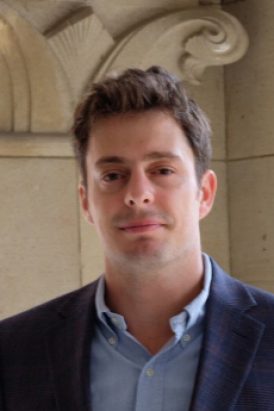 Zack Spica合作论文数Department of Earth and Environmental Sciences, College of Literature, Science, and the Arts, University of Michigan-Ann Arbor2
 Ana Ferreira合作论文数Earth Sciences, Faculty of Mathematical & Physical Sciences, University College London2
 Conor O'Malley合作论文数Department of Earth Science and Engineering, Faculty of Engineering, Imperial College London2Ian Bastow合作论文数Department of Earth Science and Engineering, Faculty of Engineering, Imperial College London2
 Werner Lienhart合作论文数2
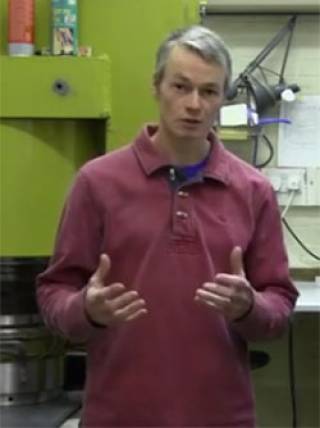 David Dobson合作论文数Earth Sciences, Faculty of Mathematical & Physical Sciences, University College London2
 Pascal Edme合作论文数2
 Martin Schoenball合作论文数Institut fur Astrophysik2
 Roger A. Clark合作论文数2Michael S. Thorne合作论文数Department of Geological Sciences;Arizona State University;Department of Geological Sciences, Arizona State University2
 Alan Baird合作论文数2
 Nick Rawlinson合作论文数Department of Earth Sciences, University of Cambridge;Downing College, University of Cambridge2M. W. Hildyard合作论文数2




