Abstract. Parties to the 2015 Paris Agreement agreed to limit the long-term increase in global average temperature to well below 2 °C and pursue efforts to keep temperatures below 1.5 °C relative to pre-industrial levels. As the world is fast approaching the 1.5 °C warming level on a sustained basis, and with 2024 likely the first year that was over 1.5 °C warmer than 1850-1900, there is ever increasing interest in how we will know whether and when 1.5 °C warming since pre-industrial has been reached or exceeded with respect to a long-term average. This paper represents a comprehensive community methodological overview, building on the IPCC 6th assessment. It explains why there is no straightforward answer and proposes clear and reasoned ways forward. Existing challenges are as follows. Firstly, the Paris Agreement text contains definitional ambiguities around 'pre-industrial', 'global average temperature', whether the assessment should be on realised or long-term human-induced warming, and over what time frame the long-term temperature goal applies. Then, there are intrinsic limitations of observational records which get more uncertain further back in time due to data sparsity and measurement heterogeneity. Finally, in a non-stationary climate, multidecadal mean indicators of global temperature change will either lag behind the change or must rely on expected future temperature changes (based on extrapolation, initialized predictions, or scenario-based and constrained projections). Our analysis shows that knowing 'whether we are there yet' is a multifaceted and inherently probabilistic problem that includes information on the definition of a specific level of global warming, temperature changes over multiple timescales, and also potentially includes unpacking the attribution of human-caused changes from observed variations. Given the policy relevance of understanding where the world stands relative to 1.5 °C, or any other level of global warming since pre-industrial, there are a number of practical steps which could be taken to increase specificity in answering this critical question in a timely manner, and inform future monitoring and assessment activities. This paper reviews a broad range of approaches, identifies the most pragmatic, robust and transparent, and clarifies requirements for use in real time including how to handle and represent remaining uncertainties. We show that it is possible by combining lines of evidence and several methodologies to estimate the present long-term warming level without delay in a manner that is robust both in retrospective validation of crossing past warming levels and, critically, to divergent warming futures including potential wildcard impacts of large volcanoes which can mask underlying warming for several years. Results are benchmarked against historical exceedances of 0.5 °C and 1 °C warming. Long-term warming as assessed using the approaches developed herein and data up to and including 2024 stands at 1.40 [1.23–1.58] °C, and underlying human-caused warming stands at 1.34 [1.18–1.50] °C. In IPCC quantified likelihood language this means that it was unlikely that long-term realised warming had exceeded 1.5 °C by the end of 2024 and very unlikely that human-induced warming had exceeded 1.5 °C.
As global warming approaches 1.5 °C, the term ‘overshoot’ is becoming increasingly prominent in climate science, policy, and public communication, but the use of this term remains inconsistent and often ambiguous. This article traces the history of the term in ordinary language and science-policy contexts, showing how specialized uses such as ‘temperature overshoot’ or ‘overshoot pathway’ have diverged from the common meaning of exceeding a target or limit. We provide practical guidance for clearer communication, recommending that authors respect the ordinary meaning of overshoot and specify where insights refer to exceedance, peak warming, decline, or return below a given warming level, while avoiding short-hand terminology where it risks misunderstanding.
Stabilizing and then drawing down global temperature requires achieving net-negative CO2 emissions globally. Carbon removal is needed to offset “hard-to-abate” sectors that remain sources of emissions at net zero and beyond. We argue that the use of scarce carbon removal resources should be guided by the principles enshrined in the Paris Agreement.
Limited progress with mitigation makes it almost inevitable that global warming of 1.5°C will be exceeded. This realization confronts Parties to the United Nations Framework Convention on Climate Change (UNFCCC) with a choice either to stabilize warming above but as close as possible to 1.5°C or to reverse global warming back to this level. We review core concepts and current knowledge relating to overshoot: an exceedance and subsequent decline back below a specified global warming level. We clarify the concept and origins of overshoot in science and climate policy, discuss the key drivers of climate-related risks and how they might evolve under overshoot trajectories to foster more systematic research into those risks, and consider the role of adaptation. We then consider the feasibility of overshoot in terms of mitigation across the six feasibility dimensions introduced by the Intergovernmental Panel on Climate Change (IPCC) in its sixth Assessment Report. We conclude by discussing critical barriers, challenges, and knowledge gaps related to overshoot.
The Intergovernmental Panel on Climate Change (IPCC) exists to provide policy-relevant assessments of the science related to climate change. As such, the IPCC has long grappled with characterizing and communicating uncertainty in its assessments. Decision Making under Deep Uncertainty (DMDU) is a set of concepts, methods, and tools to inform decisions when there exist substantial and significant limitations on what is and can be known about policy-relevant questions. Over the last twenty-five years, the IPCC has drawn increasingly on DMDU concepts to more effectively include policy-relevant, but lower-confidence scientific information in its assessments. This paper traces the history of the IPCC’s use of DMDU and explains the intersection with key IPCC concepts such as risk, scenarios, treatment of uncertainty, storylines and high-impact, low-likelihood outcomes, and both adaptation and climate resilient development pathways. The paper suggests how the IPCC might benefit from enhanced use of DMDU in its current (7th) assessment cycle.
Achieving the long-term temperature goal of the Paris Agreement relies on every actor maximising their effort to reduce emissions. Generic targets claiming a basis in science have been used to justify inequitable efforts that insufficiently stretch the ambition of the best-resourced countries and companies.
Citation: Reisinger A. Why addressing methane emissions is a non-negotiable part of effective climate policy. Front Sci (2024) 2:1451011. doi: 10.3389/fsci.2024.1451011
The world looks almost certain to reach and then exceed global warming of 1.5°C during the 2030s, given recent trends and limited near-term action. The next-best option still within reach is to ensure this exceedance is both limited and temporary, by bringing global warming levels back down below 1.5°C as soon as possible and by 2100 at the latest. In this primer, we set out the key elements that would make such a “temporary overshoot” trajectory a relevant and feasible prospect. We elaborate on the origins of temporary overshoot as a concept in the scientific literature as well as its emerging role in international climate policy, the need for a typology of risks that a future decline in temperature would reduce or avoid, and the emission pathways that could achieve a return of global warming levels to below 1.5°C, along with their feasibility and implications for climate policy.
This annex on Definitions, Units and Conventions provides background information on material used in the Working Group III contribution to the Intergovernmental Panel on Climate Change (IPCC) Sixth Assessment Report (AR6 WGIII).The material presented in this annex documents metrics and common datasets that are typically used across multiple chapters of the report.In a few instances there are no updates to what was adopted by WGIII during the production of the Fifth Assessment Report (AR5), in which case this annex refers to Annex II of AR5 (Krey et al. 2014).The annex comprises four parts: Part I introduces standards, metrics and common definitions adopted in the report; Part II presents methods to derive or calculate certain quantities and identities used in the report; Part III provides more detailed background information about common data sources; and Part IV presents integrative methodologies used in the assessment.While this structure may help readers to navigate through the annex, it is not possible in all cases to unambiguously assign a certain topic to one of these parts, naturally leading to some overlap between the parts. Part I: Definitions and Units A.II.1 Classification Schemes for Countries and AreasIn this report, two different levels of classification are used as a standard to present the results of analysis.The basis for the classification is the UN Statistics Division Standard Country or Area Codes for Statistical Use, also known as the M49 Standard (UNSD 1999).This covers geographical regions and, at the time of the literature cut-off date, identified developed regions, developing regions and least developed countries.The high-level classification has six categories (Table 1): one covering North America, Europe, and Australia, Japan and New Zealand, labelled 'developed countries', and five covering other countries, all classified as developing using the M49 standard at the cutoff date.The high-level classification is an expansion of the RC5 (Regional Categorisation 5) adopted in AR5 WGIII, with Africa and the Middle East now identified separately.The low-level classification (ten categories) divides developed countries into three geographical regions, and Asia and Pacific into three sub-regions.The high-and low-level classification schemes reflect schemes used in many global models and statistical sources.Where the report synthesises data, only these standard classification schemes have been used.On occasions, the underlying literature may deviate from the standard classification scheme and direct citations may unavoidably refer to alternative classifications.This is dealt with on a case-by-case basis and does not imply any endorsement of the scheme used in the underlying literature by the IPCC or the authors of this report.The detailed allocation of countries and areas to the low-level classification is shown in Section 1.1.Following AR5, the classification scheme deviates from the UN regional classification with the result that Annex I, Annex II and non-Annex I countries as defined under the UN Framework Convention on Climate Change (UNFCCC) are distinguished.Some Annex I countries in Western Asia and countries in Eastern Europe which are not members of the European Union are allocated to Eastern Europe and West-Central Asia (EEA).In AR5, these formed part of the Economies in Transition group.The remainder of Western Asia (non-Annex I) is allocated to the Middle East.Following the practice of the UN Statistics Division, we note that the designations employed and the presentation of material in this report do not imply the expression of any opinion by the United Nations, the IPCC or the authors of this report concerning the legal status of any country, territory, city or area or of its authorities, or concerning the delimitation of its frontiers or boundaries.The term 'country' as used in this material also refers, as appropriate, to territories or areas.
After the conclusion of the 27(th) Conference of the Parties to the UN Framework Convention on Climate Change (COP27) climate talks in Sharm el-Sheikh, some have described the goal of limiting warming to no more than 1.5 degrees C as dead, whereas others describe it as being on life support. Dr. Andy Reisinger, commissioner at He Pou a Rangi (the New Zealand Climate Change Commission) and vice chair of Working Group III at the Intergovernmental Panel on Climate Change (IPCC); and Dr. Oliver Geden, senior fellow at the German Institute for International and Security Affairs, lead author for IPCC Sixth Assessment Report (AR6) Working Group III, and member of the core writing team for the IPCC AR6 Synthesis Report, have recently spoken with One Earth about the prospects for limiting warming to 1.5 degrees C and windows of opportunity to accelerate climate action. The views expressed by Dr. Reisinger and Dr. Geden are their personal views only and not those of their associated institutions.
Comprehensive and reliable information on anthropogenic sources of greenhouse gas emissions is required to track progress towards keeping warming well below 2°C as agreed upon in the Paris Agreement. Here we provide a dataset on anthropogenic GHG emissions 1970-2019 with a broad country and sector coverage. We build the dataset from recent releases from the “Emissions Database for Global Atmospheric Research” (EDGAR) for CO2 emissions from fossil fuel combustion and industry (FFI), CH4 emissions, N2O emissions, and fluorinated gases and use a well-established fast-track method to extend this dataset from 2018 to 2019. We complement this with information on net CO2 emissions from land use, land-use change and forestry (LULUCF) from three available bookkeeping models.
While the Intergovernmental Panel on Climate Change (IPCC) physical science reports usually assess a handful of future scenarios, the Working Group III contribution on climate mitigation to the IPCC's Sixth Assessment Report (AR6 WGIII) assesses hundreds to thousands of future emissions scenarios. A key task in WGIII is to assess the global mean temperature outcomes of these scenarios in a consistent manner, given the challenge that the emissions scenarios from different integrated assessment models (IAMs) come with different sectoral and gas-to-gas coverage and cannot all be assessed consistently by complex Earth system models. In this work, we describe the “climate-assessment” workflow and its methods, including infilling of missing emissions and emissions harmonisation as applied to 1202 mitigation scenarios in AR6 WGIII. We evaluate the global mean temperature projections and effective radiative forcing (ERF) characteristics of climate emulators FaIRv1.6.2 and MAGICCv7.5.3 and use the CICERO simple climate model (CICERO-SCM) for sensitivity analysis. We discuss the implied overshoot severity of the mitigation pathways using overshoot degree years and look at emissions and temperature characteristics of scenarios compatible with one possible interpretation of the Paris Agreement. We find that the lowest class of emissions scenarios that limit global warming to “1.5 ∘C (with a probability of greater than 50 %) with no or limited overshoot” includes 97 scenarios for MAGICCv7.5.3 and 203 for FaIRv1.6.2. For the MAGICCv7.5.3 results, “limited overshoot” typically implies exceedance of median temperature projections of up to about 0.1 ∘C for up to a few decades before returning to below 1.5 ∘C by or before the year 2100. For more than half of the scenarios in this category that comply with three criteria for being “Paris-compatible”, including net-zero or net-negative greenhouse gas (GHG) emissions, median temperatures decline by about 0.3–0.4 ∘C after peaking at 1.5–1.6 ∘C in 2035–2055. We compare the methods applied in AR6 with the methods used for SR1.5 and discuss their implications. This article also introduces a “climate-assessment” Python package which allows for fully reproducing the IPCC AR6 WGIII temperature assessment. This work provides a community tool for assessing the temperature outcomes of emissions pathways and provides a basis for further work such as extending the workflow to include downscaling of climate characteristics to a regional level and calculating impacts.
Agriculture is the largest single source of global anthropogenic methane (CH 4 ) emissions, with ruminants the dominant contributor. Livestock CH 4 emissions are projected to grow another 30% by 2050 under current policies, yet few countries have set targets or are implementing policies to reduce emissions in absolute terms. The reason for this limited ambition may be linked not only to the underpinning role of livestock for nutrition and livelihoods in many countries but also diverging perspectives on the importance of mitigating these emissions, given the short atmospheric lifetime of CH 4 . Here, we show that in mitigation pathways that limit warming to 1.5°C, which include cost-effective reductions from all emission sources, the contribution of future livestock CH 4 emissions to global warming in 2050 is about one-third of that from future net carbon dioxide emissions. Future livestock CH 4 emissions, therefore, significantly constrain the remaining carbon budget and the ability to meet stringent temperature limits. We review options to address livestock CH 4 emissions through more efficient production, technological advances and demand-side changes, and their interactions with land-based carbon sequestration. We conclude that bringing livestock into mainstream mitigation policies, while recognizing their unique social, cultural and economic roles, would make an important contribution towards reaching the temperature goal of the Paris Agreement and is vital for a limit of 1.5°C. This article is part of a discussion meeting issue 'Rising methane: is warming feeding warming? (part 1)'.
To track progress towards keeping global warming well below 2 ∘C or even 1.5 ∘C, as agreed in the Paris Agreement, comprehensive up-to-date and reliable information on anthropogenic emissions and removals of greenhouse gas (GHG) emissions is required. Here we compile a new synthetic dataset on anthropogenic GHG emissions for 1970–2018 with a fast-track extension to 2019. Our dataset is global in coverage and includes CO2 emissions, CH4 emissions, N2O emissions, as well as those from fluorinated gases (F-gases: HFCs, PFCs, SF6, NF3) and provides country and sector details. We build this dataset from the version 6 release of the Emissions Database for Global Atmospheric Research (EDGAR v6) and three bookkeeping models for CO2 emissions from land use, land-use change, and forestry (LULUCF). We assess the uncertainties of global greenhouse gases at the 90 % confidence interval (5th–95th percentile range) by combining statistical analysis and comparisons of global emissions inventories and top-down atmospheric measurements with an expert judgement informed by the relevant scientific literature. We identify important data gaps for F-gas emissions. The agreement between our bottom-up inventory estimates and top-down atmospheric-based emissions estimates is relatively close for some F-gas species (∼ 10 % or less), but estimates can differ by an order of magnitude or more for others. Our aggregated F-gas estimate is about 10 % lower than top-down estimates in recent years. However, emissions from excluded F-gas species such as chlorofluorocarbons (CFCs) or hydrochlorofluorocarbons (HCFCs) are cumulatively larger than the sum of the reported species. Using global warming potential values with a 100-year time horizon from the Sixth Assessment Report by the Intergovernmental Panel on Climate Change (IPCC), global GHG emissions in 2018 amounted to 58 ± 6.1 GtCO2 eq. consisting of CO2 from fossil fuel combustion and industry (FFI) 38 ± 3.0 GtCO2, CO2-LULUCF 5.7 ± 4.0 GtCO2, CH4 10 ± 3.1 GtCO2 eq., N2O 2.6 ± 1.6 GtCO2 eq., and F-gases 1.3 ± 0.40 GtCO2 eq. Initial estimates suggest further growth of 1.3 GtCO2 eq. in GHG emissions to reach 59 ± 6.6 GtCO2 eq. by 2019. Our analysis of global trends in anthropogenic GHG emissions over the past 5 decades (1970–2018) highlights a pattern of varied but sustained emissions growth. There is high confidence that global anthropogenic GHG emissions have increased every decade, and emissions growth has been persistent across the different (groups of) gases. There is also high confidence that global anthropogenic GHG emissions levels were higher in 2009–2018 than in any previous decade and that GHG emissions levels grew throughout the most recent decade. While the average annual GHG emissions growth rate slowed between 2009 and 2018 (1.2 % yr−1) compared to 2000–2009 (2.4 % yr−1), the absolute increase in average annual GHG emissions by decade was never larger than between 2000–2009 and 2009–2018. Our analysis further reveals that there are no global sectors that show sustained reductions in GHG emissions. There are a number of countries that have reduced GHG emissions over the past decade, but these reductions are comparatively modest and outgrown by much larger emissions growth in some developing countries such as China, India, and Indonesia. There is a need to further develop independent, robust, and timely emissions estimates across all gases. As such, tracking progress in climate policy requires substantial investments in independent GHG emissions accounting and monitoring as well as in national and international statistical infrastructures. The data associated with this article (Minx et al., 2021) can be found at https://doi.org/10.5281/zenodo.5566761.
Comprehensive and reliable information on anthropogenic sources of greenhouse gas emissions is required to track progress towards keeping warming well below 2°C as agreed upon in the Paris Agreement. Here we provide a dataset on anthropogenic GHG emissions 1970-2019 with a broad country and sector coverage. We build the dataset from recent releases from the “Emissions Database for Global Atmospheric Research” (EDGAR) for CO2 emissions from fossil fuel combustion and industry (FFI), CH4 emissions, N2O emissions, and fluorinated gases and use a well-established fast-track method to extend this dataset from 2018 to 2019. We complement this with information on net CO2 emissions from land use, land-use change and forestry (LULUCF) from three available bookkeeping models.
Real-world experience underscores the complexity of interactions among multiple drivers of climate change risk and of how multiple risks compound or cascade. However, a holistic framework for assessing such complex climate change risks has not yet been achieved. Clarity is needed regarding the interactions that generate risk, including the role of adaptation and mitigation responses. In this perspective, we present a framework for three categories of increasingly complex climate change risk that focus on interactions among the multiple drivers of risk, as well as among multiple risks. A significant innovation is recognizing that risks can arise both from potential impacts due to climate change and from responses to climate change. This approach encourages thinking that traverses sectoral and regional boundaries and links physical and socio-economic drivers of risk. Advancing climate change risk assessment in these ways is essential for more informed decision making that reduces negative climate change impacts.
To limit warming, action plans from countries and companies must be fair, rigorous and transparent. To limit warming, action plans from countries and companies must be fair, rigorous and transparent.
With the adoption of the Paris Agreement in 2015 the world has decided that warming should be kept well below 2°C while pursuing a limit of 1.5°C above preindustrial levels. The Paris Agreement also sets a net emissions reduction goal: in the second half of the century, the balance of global anthropogenic greenhouse gas emissions and removals should become net zero. Since 2018, in response to the publication of the IPCC Special Report on Global Warming of 1.5°C, a flurry of net zero target announcements has ensued. Many countries, cities, regions, companies, or other organisations have come forward with targets to reach net zero, or become carbon or climate neutral. These labels describe a wide variety of targets, and rarely detailed. Lack of transparency renders it impossible to understand their ultimate contribution towards the global goal. Here we present a set of key criteria that high-quality net zero targets should address. These nine criteria cover emissions, removals, timing, fairness and a long-term vision. Unless net zero targets provide clarity on these nine criteria, we may not know until it is too late whether the collective promise of net zero targets is adequate to meet the global goal of the Paris Agreement.
 Keywan Riahi合作论文数International Institute for Applied Systems Analysis15
 Joeri Rogelj合作论文数Centre for Environmental Policy, Faculty of Natural Sciences, Imperial College London;Grantham Institute, Imperial College London;International Institute for Applied Systems Analysis15
 Wolfgang Cramer合作论文数Mediterranean Institute of Marine and Terrestrial Biodiversity and Ecology12
 Petra Tschakert合作论文数Department of Geography, University of Western Australia;Curtin University11
 Gary Wynn Yohe (Gary W. Yohe)合作论文数Department of Economics, College of Social Studies, Wesleyan University11
 Malte Meinshausen合作论文数School of Geography, Earth and Atmospheric Sciences, Faculty of Science, The University of Melbourne;Potsdam Institute for Climate Impact Research10
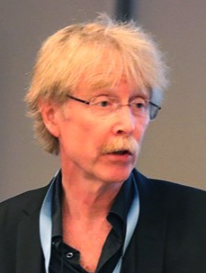 Jan S. Fuglestvedt合作论文数Center for International Climate and Environmental Research10
 Michael D. Mastrandrea合作论文数10Vicente R. Barros合作论文数10
 Katharine Mach合作论文数Department of Environmental Science and Policy, Rosenstiel School of Marine, Atmospheric, and Earth Science, University of Miami;Leonard and Jayne Abess Center for Ecosystem Science and Policy University of Miami10
 Daniela Schmidt合作论文数Department of Earth Sciences,University of Bristol10
 Chris Field合作论文数Department of Earth System Science, Doerr School of Sustainability, Stanford University;Freeman Spogli Institute for International Studies;Precourt Institute for Energy, Stanford University;Department of Biology, School of Humanities and Sciences, Stanford University;Woods Institute for the Environment, Stanford University9
 Ove Hoegh-Guldberg合作论文数School of Biological Sciences, The University of Queensland;ARC Centre for Excellence for Reef Studies;University of Copenhagen9
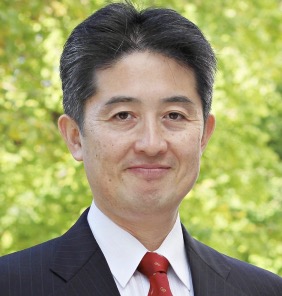 Taikan Oki (沖大幹)合作论文数Department of Civil Engineering, Graduate School of Engineering, The University of Tokyo;Human Geo-science Laboratory, The University of Tokyo9
 Aromar Revi合作论文数9
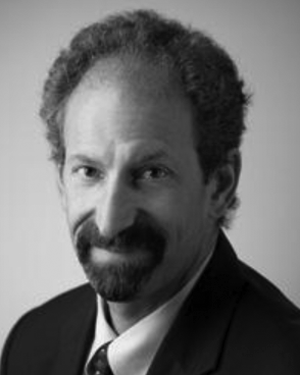 Douglas J. Arent合作论文数National Renewable Energy Laboratory (NREL), Energy Analysis Office, 1617 Cole Blvd., Golden, CO 80401, USA9
 Oliver Geden合作论文数9Leonard Nurse合作论文数8Patricia Romero-Lankao合作论文数8
 Yasuaki Hijioka合作论文数National Institute for Environmental Studies8Roger Mclean合作论文数8
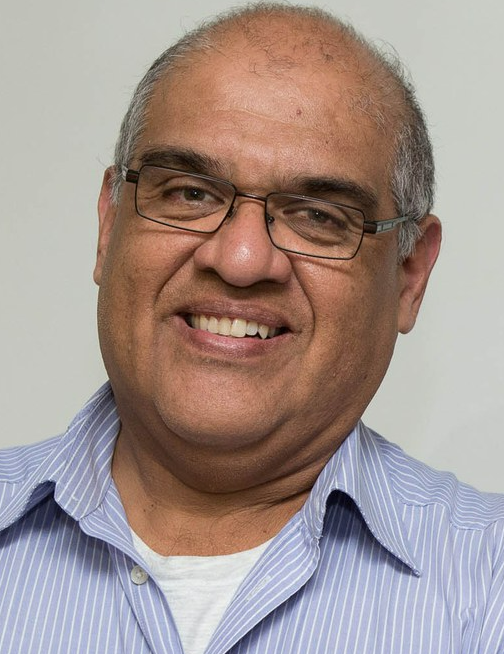 Jose Antonio Marengo Orsini合作论文数Centro Nacional de Monitoramento e Alertas de Desastres Naturais;Academia Brasileira de Ciências;Korea University;Universidade Estadual Paulista Júlio de Mesquita Filho8
 Hans-Otto Poertner合作论文数Department of Integrative Ecophysiology, Helmholtz-Zentrum für Polar- und Meeresforschung, Alfred-Wegener-Institut;University of Bremen8
 Sari Kovats合作论文数Centre on Climate Change & Planetary Health, London School of Hygiene & Tropical Medicine;Department of Public Health, Environments and Society, Faculty of Public Health and Policy, London School of Hygiene & Tropical Medicine8Rachel F. Warren合作论文数Imperial College Centre for Environmental Technology8
 Iñigo J. Losada合作论文数School of Civil Engineering, University of Cantabria;Instituto de Hidraulica Ambiental, Universidad de Cantabria8
 Piers Forster合作论文数School of Earth, Environment and Sustainability, University of Leeds;Priestley Centre for Climate Futures, University of Leeds8Avelino Suarez合作论文数7
 Alicia Villamizar合作论文数Ecology of Mangroves and Climate Change Laboratory (BoLab),, Simon Bolivar University Valle de Sartenejas7
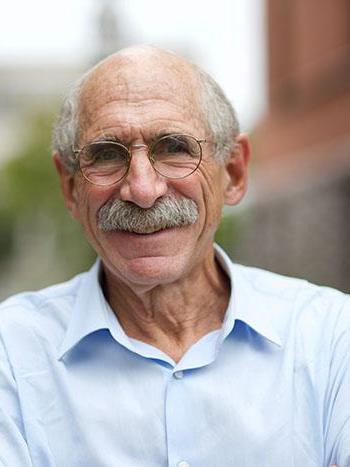 Michael Oppenheimer合作论文数High Meadows Environmental Institute, Princeton University;Center for Policy Research on Energy and the Environment, Princeton School of Public and International Affairs, Princeton University;Department of Geosciences, Princeton School of Public and International Affairs, Princeton University7
 Debra J. Davidson合作论文数Biography;Departments of Rural Economy;University of Alberta;Departments of Rural Economy, University of Alberta7
 Elvira Poloczanska合作论文数Alfred Wegener Institute, Helmholtz Centre for Polar and Marine Research7
 Matilde Rusticucci合作论文数Departamento de Ciencias de la Atmósfera y los Océanos, Facultad de Ciencias Exactas y Naturales, Universidad de Buenos Aires7
 Roger Neville Jones合作论文数CSIRO Atmospheric Research Aspendale7Monalisa Chatterjee合作论文数Department of Geography, Rutgers University7
 Neil Adger合作论文数Global Systems Institute, University of Exeter7
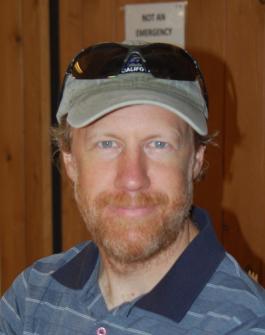 Dáithí Stone合作论文数National Institute for Water and Atmospheric Research7
 Karen O'Brien合作论文数Department of Sociology and Human Geography, Faculty of Social Sciences, University of Oslo6I Niang合作论文数6John Wilbanks合作论文数Sage Bionetworks6Judy Lawrence合作论文数6
 Maarten van Aalst合作论文数Red Cross/Red Crescent Climate Centre;International Research Institute for Climate and Society, Columbia University;International Research Institute for Climate and Society, Columbia University6
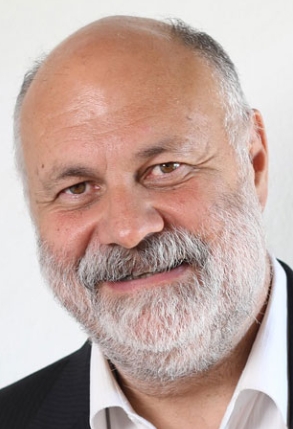 Riccardo Valentini合作论文数Department of Innovation in Biological Systems, Food and Forestry, University of Tuscia;Euro-Mediterranean Center on Climate Change;Russian State Agriculture University;RUDN University6
 N H Ravindranath合作论文数Centre for Sustainable Technologies, Indian Institute of Science6
 Youba Sokona合作论文数South Centre6
 Purnamita Dasgupta合作论文数Institute of Economic Growth6
 Jan C. Minx合作论文数School of Earth and Environment, Faculty of Environment, University of Leeds;Priestley International Centre for Climate, University of Leeds;Mercator Research Institute on Global Commons and Climate Change gGmbH;Evidence for Climate Solutions Working Group, Potsdam Institute for Climate Impact Research6
 Joan Nymand Larsen合作论文数6
 Martin Manning合作论文数5




