The increasing global population drives a growing demand for clean water, with agricultural irrigation being a significant consumer of freshwater resources. Efficient water management is essential for optimal crop yield. While several studies have focused on estimating daily crop water requirements for field crops, very few studies have been conducted on tea plantations. Tea plantations are unique as they consist of crops that have been established for over 50 years, making them highly resilient to adverse climate conditions. However, there is limited research on quantifying water requirements and soil moisture dynamics in tea estates, which is essential for improving irrigation management and ensuring sustainable production. The objective of this study was to evaluate crop water requirements in tea plantations using a standardized modeling framework. In this study, the FAO Penman-Monteith (FAO-PM) model was applied to two tea estates in Assam, India (hereafter referred to as Estate1 and Estate2), spanning 37 sections and covering a total area of 270.04 hectares, to estimate daily crop water requirements. Gravimetric soil moisture data were utilized to calibrate crop coefficient (Kc) and field capacity (FC) for each section using grid search method, highlighting section-wise differences in crop water use and soil moisture retention. Different sections of Estate1 and Estate2 achieved optimal crop coefficients (KcBest) of 0.9, 1.0, 1.1 and 1.15, and optimal field capacities (FcBest) of 0.37, 0.38, 0.39, 0.40 and 0.41, reflecting variations in water needs and soil moisture retention across sections. The model demonstrated moderate predictive accuracy in Estate1, with a Root Mean Squared Error (RMSE) of 2.57 and a Root Mean Squared Percentage Error (RMSPE) of 0.14. In Estate2, the model showed weaker correlations, with RMSE and RMSPE values of 3.22 and 0.20, respectively. The model performed well for tea gardens during the study period, revealing the importance of incorporating local crop and soil parameters to enhance irrigation efficiency. While the results are promising, further research is needed over a longer duration, effectively one year or more to assess its reliability for year-round irrigation management in tea gardens.
Cropping patterns, defined by the spatial and temporal arrangement of crops, can be classified into homogeneous and heterogeneous systems. Homogeneous cropping systems involve the cultivation of a single crop over large areas, offering advantages such as simplicity in management, efficient machinery use, and uniform harvesting. In contrast, heterogeneous cropping systems feature multiple crops on the same land, promoting biodiversity, reducing crop failure risks, and enhancing soil health. To conserve the environment, farmers are encouraged to adopt sustainable agricultural practices. To support this transition, various incentives are offered across different regions, motivating farmers to implement practices like Agroforestry and managed hedgerows, which can be effectively identified through the analysis of cropping patterns. This study focuses on assessing cropping patterns in the South Ostrobothnia region in western Finland. We propose a framework that uses Earth Observation (EO) imagery, Sentinel-2 NDVI time series data to understand the cropping pattern. Open source property boundary from the National Land Survey of Finland (NLS) and crop level information from the Finnish National Food Authority were used to create homogeneous or heterogeneous cropping pattern labels. A Random Forest algorithm was then applied to classify the property as either homogeneous or heterogeneous. A random sampling approach was employed to select properties for accuracy assessment, ensuring unbiased evaluation of the classification results. The model achieved an overall accuracy 77-80% for year 2020, 2021 and 2022. This study shows that satellite-based Earth observations effectively analyze cropping patterns, offering valuable insights for policymaking, scheme compliance monitoring, and environmental conservation. Future research could focus on mapping specific crops within cropping patterns to better understand agricultural intensity. Also, integrating multi-sensor data, linking cropping patterns with sustainability indicators, can help us to validate the Sustainable Agriculture Practices.
Soil salinity poses a significant threat to agricultural productivity, especially in regions with arid and semi-arid climates. This study presents a comparative machine learning-based approach to predict soil salinity types using satellite-derived data and categorical environmental attributes from two geographically and climatically distinct regions of Sudan and San Joaquin Valley, California (USA). Synthetic Aperture Radar (SAR) observations from Sentinel-1 VV and VH backscatter, multi-spectral Sentinel-2 satellite based vegetation indices like NDVI, NDSI and NDWI and Moderate Resolution Imaging Spectroradiometer(MODIS) based Land Surface Temperature and Evapotranspiration observations were used as input features with categorical variables such as climatic region(arid, semi-arid) and soil depth categories from 0-30cm, 30-60cm, 60-100 and 100-200cm. Salinity type is categorized as Non-Saline, Slight-Saline, Moderate-Saline and Highly-Saline that served as the target variable. Three supervised classification models such as XG Boost, Random Forest and Support Vector Machine were trained and tested. Model performance was assessed using accuracy and F1-score.The Random Forest model demonstrated high predictive performance, with accuracy of 77%, while the SVM classifier achieved accuracy of 75%, particularly with standardized inputs. We have also visualized soil salinity trends across different depths and Climatic Zones using Electric Conductivity(EC) data to understand vertical and regional variations in salt accumulation. Further, we provide an approach to integrate process-based salt accumulation model with satellite-based salinity estimation approach for prediction of salt accumulation.
Tillage is a fundamental agricultural practice that influences soil health, crop productivity, and the overall sustainability of farming systems. Tillage data is important to understand various factors related to soil such as evapotranspiration, surface run-off, infiltration, carbon sequestration and soil losses due to wind and water erosion.In this research we have studied various machine-learning based approaches namely, random forest (RF), support vector machine (SVM) and eXtreme Gradient Boosting (XGBoost) algorithms for the identification of tillage and no-tillage practices using Sentinel-1 SAR and Sentinel-2 Optical data. The objective of this research is to determine different types of tillage surfaces by analyzing the indices derived from Sentinel-2 and Sentinel-1 data and to study how the spectral signature of tillage changes with respect to time. We have studied the probabilistic model for three different time periods after the Tillage operation is carried out in the field from 0-10 days,10-20 days and 20-30 days. From the above models XGBoost gave the highest accuracy for all these time periods i.e 85% for 0-10 days, 82% for 10-20 days and 84% for 20-30 days after the tillage operation is carried out in the fields. This approach for Tillage identification can help us to understand when the Tillage was carried out in the fields. The information can further help in contributing to identifying regions where traditional tillage methods are practiced, providing an opportunity to introduce conservation tillage practices while considering carbon sequestration.
In this study, we mapped land subsidence in the Ahmedabad urban region using the SBAS InSAR technique between 2020 and 2023 (approximately 3.5 years). A distinct pattern of average line of sight (LOS) land subsidence was observed at two key locations within the city: the Southwest and Southeast regions of Ahmedabad. The average LOS velocity in these areas ranged from −1.5 cm/year to −3.0 cm/year in the Southwest and −2 cm/year to −3.5 cm/year in the Southeast. Negative LOS velocities represent areas experiencing subsidence. Data from the Central Ground Water Board (CGWB) revealed that groundwater levels in the Southwest region dropped significantly from around 11 meters in mid-2005 to less than 2 meters by 2019. Similarly, in the Southeast, groundwater levels fell from approximately 42 meters in 2005 to around 28 meters in 2019. The observed land subsidence was strongly correlated with localized groundwater depletion. Additionally, groundwater data from multiple wells across the Ahmedabad district were analyzed over several years. In contrast to localized depletion, a substantial number of wells at the district level showed an increase in groundwater levels from 2014 to 2022, compared to the decadal average, suggesting an overall positive trend in groundwater availability. This indicates that the subsidence is likely due to localized over-extraction of groundwater and hydrogeological factors specific to these areas, which differ from broader regional trends.
Above-ground biomass density (AGBD) quantification is crucial for understanding carbon dynamics, climate change, and sustainable forest management. This study integrates Global Ecosystem Dynamics Investigation (GEDI) satellite data with multi-spectral, Synthetic Aperture Radar (SAR) based earth observations and soil data for continuous estimation of forest AGBD. Study was focused on the Indian forest. GEDI’s AGBD data from 10,000 points serves as the dependent variable and independent variables are derived from Sentinel-1, Sentinel-2, Digital Elevation Model (DEM), SoilGrids, and Climate Hazards Group InfraRed Precipitation with Station data (CHIRPS). We evaluated Support Vector Regression, Random Forest Regression, and Light Gradient Boosting Machine algorithms for various feature-set scenarios. Hyperparameter tuning employed grid-search-based cross-validation. Results shows that, LightGBM performed well, being computationally efficient and delivering lower RMSE. For the selected LightGBM model, with Sentinel-1, Sentinel-2, DEM, and forest attributes, an RMSE of 68.02 Mg/ha and R 2 of 0.57 were achieved. Model-generated AGB maps were compared with openly available National Remote Sensing Centre AGBD data at 100m and existing forest AGBD work. Comparison between model predicted AGBD and literature based maps and studies shows that, our model was able to capture the AGBD variations across multiple forest sub-regions from India.
Monitoring changes in carbon stocks through forest biomass assessment is crucial for carbon cycle studies. However, challenges in obtaining timely and reliable ground measurements hinder creation of the spatially continuous maps of forest aboveground biomass density (AGBD). This study proposes an approach for generating spatially continuous maps of forest aboveground biomass density (AGBD) by combining Global Ecosystem Dynamics Investigation (GEDI) LiDAR-based data with open-access earth observation (EO) data. The key contribution of the study lies in the systematic evaluation of various model configurations to select the optimal model for AGBD generation. The evaluation considered various model configurations, including predictor sets, spatial resolution, beam selection, and sensitivity thresholds. We used a Random Forest model, trained through five-fold cross-validation on 80% of the total data, to estimate AGBD in the Indian forest region. Model performance was assessed using the 20% independent test dataset. Results, using Sentinel-1 and 2 predictors, yielded R2 values of 0.55 to 0.60 and RMSE of 48.5 to 56.3 Mg/ha. Incorporating forest and agroclimatic zone attributes improved performance (R2: 0.59 to 0.69, RMSE: 42.2 to 53.3 Mg/ha). The selection of the top 15 predictors, which favoured features from Sentinel-2, DEM, forest attributes, and agroclimatic zones, and GEDI data with sensitivity >0.98, yielded the optimal model with an R2 of 0.64 and RMSE of 46.59 Mg/ha. The results underscore the significance of incorporating attributes like forest and agro-climatic zones and the need for an optimal model selection considering predictor types and GEDI shot characteristics. The top-performing model is validated in Simdega, Jharkhand (R2: 0.74, RMSE: 39.3 Mg/ha), demonstrating the methodological potential of this approach. Overall, this study emphasizes the methodological prospects of integrating multi-source open-access EO data to produce spatially continuous aboveground biomass (AGB) maps through data fusion.
Mapping sugarcane areas is vital for applications like crop monitoring, yield estimation, environmental monitoring, and land use planning. Traditional supervised learning is hindered by the costly and time-intensive collection of ground truth data, whereas, unsupervised methods encounter performance challenges due to parameter initialization. In this study, we propose a hybrid approach that integrates unsupervised learning with domain knowledge of temporal sugarcane crop descriptors, creating reference data for subsequent supervised learning. The main objective of the study was to map sugarcane areas in the absence of ground reference data by combining unsupervised and supervised learning using Sentinel-1 and 2 observations. The study was carried out in two provinces in central Thailand during the sugarcane season of 2021-2022. X means clustering was applied to the raster stack of temporal NDVI and radar backscatter (in VH polarisation). Fifty polygons were then digitized from each cluster and categorized as sugarcane, cassava, field crops, and non-agriculture using the temporal descriptors for each polygon. Polygons not meeting the temporal descriptors based criteria were removed. Further, RF based supervised classification was carried out using bands of Sentinel-1 and 2, and NDVI as the features and labled polygons as the reference. The samples were divided into training (80% data) and testing (20% data). We tuned the RF classifier for a number of trees ranging from 50 to 500. The model with 350 trees performed better on testing data, with an overall accuracy of 87.75% and a Kappa of 0.873. Slight intermixing between sugarcane and cassava was observed mainly due to the planting/sowing window (March-May) and crop duration in the case of the Ratoon sugarcane crop. Further, we implemented the same model in an adjacent province to evaluate the performance of the proposed approach. The overall accuracy of 75.86% was obtained, and precision and recall for sugarcane were 0.79 and 0.76, respectively. This shows that strong temporal descriptors derived from an unsupervised approach can be combined with supervised learning for mapping sugarcane areas in the absence of ground labels.
Agriculture tillage is a fundamental practice in farming that involves preparing the soil for planting crops. It has been an essential technique used by farmers for centuries to improve soil conditions, increase crop yields, and enhance overall agricultural productivity. While tillage information can be acquired through manual field data collection, implementing this approach consistently and systematically over a wide area poses considerable challenges. Instead, remote sensing methods offer a viable option to comprehensively, promptly, and affordably investigate tillage activities. Hence, there is significant value in embracing a remote sensing approach to consistently and methodically monitor tillage practices across various fields. The objective of this research was to determine different types of tillage surfaces by analyzing the radar backscatter response received from the ground. The study used data from the Sentinel-1 satellite, specifically the Interferometric Wide-swath (IW) Ground Range Detected (GRD) dataset, which provided radar measurements in both VV and VH polarizations. To monitor tillage, we utilized supervised classification methods, namely decision tree (DT), random forest (RF), and support vector machine (SVM). Among these classifiers, the RF has the highest test accuracy of 0.86. The obtained results were validated using the ground observation data and found encouraging.
Remote sensing coupled with machine learning is useful for non-invasive monitoring and prediction of Soil Organic Carbon (SOC) and carbon stock. The use of Sentinel-1 and 2 datasets was attempted in this work for SOC, Bulk Density (BD), and carbon stock estimation. The key objective of this study is to estimate Soil Organic Carbon and Bulk Density for carbon stock assessment in croplands using multi-spectral and Synthetic Aperture Radar (SAR) satellite observations. The fields from Colorado and Nebraska states are selected, and assessment is performed after the harvest of the cropping season in 2020. Soil samples were collected during 10-30 Oct 2020. Regression models were developed using bands and indices derived from Sentinel-1 and 2 datasets as independent variables, however SOC or BD were used individually as dependent variables. Models were developed by considering data from individual states and then combining all the data using Random Forest Regression (RFR) and Support Vector Regression (SVR). Results for the SOC estimation showed that RFR performed better than SVR with individual state data. Lowest RMSE achieved using the RFR were 0.114 and 0.159 for fields from Nebraska and Colorado states. However, SVR outperformed over RFR in the case of BD estimation using the combined data from both states (RMSE = 0.24). Further comparison between estimated carbon stock and actual carbon stock at field level shows the good agreement over fields from Colorado compared to Nebraska.
The Normalised Difference Vegetation Index (NDVI) derived from optical satellite images plays a very important role in determining the state of plants' health. Also, it is an important parameter needed in various statistical/process-based models. However, the use of optical images is sometimes limited because of atmospheric conditions and cloud cover. On the other hand, synthetic aperture radar (SAR) remote sensing has been widely used for crop monitoring due to its high-resolution imaging and all-weather data acquisition capabilities. So, if the SAR backscatter response (σ0) and NDVI data could be correlated, it is possible to estimate NDVI (during complete or partial stages of crop development) under overcast situations. In this study, three different experiments have been performed to establish the relationship between NDVI-σ0VV, NDVI-σ0VH, and NDVI-σ0VV/σ0VH. Here, time-series σ0 (in VV and VH polarizations) and NDVI were extracted from Sentinel-1 and Senitnel-2, respectively. Based on the analysis, it is found that the NDVI is more closely correlated with the ratio σ0VV/σ0VH than it is with σ0VV and σ0VH when data points from the start of cropping season up to the start of the maturity stage of the crop, were considered (referred to as experiment 2 and experiment 3). This is opposed to experiment 1, which took into account all data points related to the crop's development i.e. start of cropping season up to the harvesting stage of the crop. The best results were obtained from experiment 3 in which higher-order polynomial regressions were developed between NDVI and σ0VV/σ0VH. A significant correlation ranging from R2 = 0.81 to 0.98 were observed for NDVI-σ0VV/σ0VH. The study was conducted on selected farms located in the same agro-climatic zone during the Rabi season of 2018–19.
Vegetation cover plays a crucial role in enriching the soil carbon content. The sequestered CO 2 gets released due to exposure of soil to the atmosphere by the process of volatilization. Therefore, there is a need to monitor sustainable farm management practises like cover cropping. Remote Sensing coupled with artificial intelligence helps in non-invasive monitoring of vegetation cover. The main objective of this study is to detect the presence of cover crop using the time-series of remote sensing observations. The study was carried out on selected fields from the Europe region. A total of 60 fields from four countries, namely, France, Germany, Poland, and Spain during 2019–2021 were selected. In this study we proposed a two-step approach for cover crop detection. The first step involves separating vegetation period from fallow/bare soil and snow cover. The second step has mainly focused on the vegetation period to initially separate main crop period and subsequent detection of cover crop for the remainder of the vegetation period. Combination of index based thresholding and phenology indicators was used for cover crop detection. The proposed approach was validated using the ground reference data on presence or absence of a cover crop. Results showed an overall accuracy of 91.7% with an F1 score of 91.2%. Moreover, cover crop detection rate was found to be 92.9%. One field was misclassified as cover crop, whereas it had a dense cover of weeds. This was mainly due to higher peak NDVI value of dense weeds than NDVI threshold.
In this study, we used time-series radar backscatter response in VV and VH polarizations (i.e. σ° VV and σ° VH ) and ground-based wheat height data to establish the multivariate regression models for wheat height estimate. For generating time-series σ° VV and σ° VH , the C-band Sentinel-1 satellite data were used. The ground height observation was obtained from the farm having Durum wheat variety HI 8759 (also known as Pusa Tejas). We experimented with five different multivariate regression models (MVRM) using combinations of independent variables i.e. σ° VV , σ° VH , σ° VV /σ° VH ratio, and days after sowing (DAS). Based on the combination of variables, the five models can be depicted as MVRM1 (σ° VV , σ° VH , and DAS), MVRM2 (σ° VH and DAS), MVRM3 (σ° VV and DAS), MVRM4 (σ° VV and σ° VH ) and MVRM5 (σ° VV /σ° VH ratio and DAS). Based on statistical observation, it is found that although the model R 2 for MVRM1 and MVRM2 was about 0.90, the condition number is very high in both cases, which causes multicollinearity. This leads to model overfitting. On the other hand, model R 2 obtained for MVRM3, MVRM4, and MVRM5 are 0.94, 0.65, and 0.93 respectively and all the models are free from multicollinearity as the condition number is low. Another observation shows that DAS is an important variable in the regression model along with the backscatter response. Overall, based on the statistical parameters, MVRM3 and MVRM5 were found suitable for wheat height estimation. This particular model was validated on an independent wheat farm and found encouraging results.
Abstract. The main objective of this study is the in-season forecasting of soybean crop yield using the integration of satellite remote sensing and weather observations. The study was carried out in the Paran´a state of Brazil. The soybean crop in the study region is sown during Oct.–Nov. month and harvested between Feb.–Mar. of the next year. Municipality-level soybean yield data for 15 municipalities was obtained from the AGROLINK portal of Brazil, from the 2005–06 season to the 2020–21 season. The crop yield data constituted yearly municipality-wise yield in kg/ha. Remote sensing-based indicators such as the Normalized Difference Vegetation Index (NDVI), Enhanced Vegetation Index (EVI) and Land Surface Temperature (LST), and Rainfall data from CHIRPS was considered in the study. Regression modelling was carried out between municipality-level yield as the dependent variable and features generated from remote sensing and weather observations as independent variables. Performance evaluation of tuned random forest regression (RFR) and tuned support vector regression (SVR) were performed against multiple linear regression (MLR). A comparison of results in terms of algorithms shows that RFR performed better than SVR and MLR. Further, a rootmean- square-error (RMSE) of 414 kg/ha and an R2 value of 0.748 were achieved by the best RFR model. Validation of developed RFR model was performed on the data from the new soybean season, i.e., 2020–21. We have achieved an R2 value of 0.693 with a RMSE of 585 kg/ha. Although the model performance on the data of 2020-21 season is slightly reduced, R2 and RMSE are in good agreement with test results. This study showed that, integration of remote sensing and weather observations would be useful for in-season yield forecasting of soybean at municipality level.
The optical satellite observations are affected by cloud cover. Vegetation Optical Depth (VOD) has the potential to provide insights into plant water and vegetation structure. The main objective of this study is to spatially downscale VOD using a Moderate Resolution Imaging Spectrometer (MODIS) and Shuttle Radar Topographic Mission (SRTM) observations. The study considered India geography and post-monsoon cropping season (locally called Rabi season). Data for three different Rabi crop seasons, i.e., 2017–18, 2018–19, and 2019–20, was used in the analysis. The VOD estimates at 25 km scale derived from the Advanced Microwave Scanning Radiometer for EOS (AMSR-E) and Advanced Microwave Scanning Radiometer 2 (AMSR2) were used for spatial down-scaling. Three day VOD composites were created to cover the study area. MODIS products such as Normalized Difference Vegetation Index (NDVI), Normalized Difference Water Index (NDWI), albedo (black and white sky), and Land Surface Temperature (LST) were similarly acquired at a 3-day interval by constructing a 3-day composite. In addition, SRTM digital elevation model with a spatial resolution of 90 m was used in this study. We carried out regression modeling where VOD was used as a dependent variable, with NDVI, NDWI, Albedo (black and white sky), LST, and elevation as independent variables. We compared three regression algorithms, viz., Linear Regression (LR), Random Forest Regression (RFR), and Support Vector Regression (SVR), using the R-square (R 2 ) as the assessment metric. A comparison between the various regression techniques showed that the SVR outperformed monthly and seasonal models. Further more, a comparison of monthly and seasonal models revealed that the model generated with January data performed best, with an R 2 of 0.85, followed by R 2 of 0.82, 0.80, and 0.78 for March, December, and February, respectively. The R 2 for the seasonal model was 0.83. Finally, for the wheat crop time series of down-scaled VOD and Sentinel 2 based NDVI was compared to gain insights on seasonal variations in VOD. We found that down-scaled VOD and NDVI have a significant agreement.
Remote sensing satellites allow users to acquire detailed information about the Earth's surface on a temporal basis. Widen timeseries analysis at a large geographical scale involves a huge amount ( in Terabytes) of satellite data downloading and processing operations. Such processes need good computational power, large storage, and sophisticated tools. Maintaining such infrastructure can cost heavily to the research/commercial enterprises. To overcome such issues, Amazon Web Service (AWS) offers a sophisticated cloud computing environment. We developed an in-house automated satellite data downloading and processing (ADDPro) pipeline on the AWS platform. The ADDPro pipeline employed Sentinel-2 satellite data to offer current and relative vegetation health information of the agriculture region on a temporal basis at the pan- India scale. Image compositing and multisensor data fusion technique have been incorporated into the ADDPro pipeline to produce cloud-free raster (GeoTIFF) outputs. ADDPro pipeline also facilitates lossless raster data compression, which reduces AWS data transfer costs between regions. Data compression also aids in reducing raster publishing time on GeoServer. Operationally, AWS allows users to download only the bands required to generate a certain index (e. g. NDVI) rather than the entire Sentinel-2 data package. The entire ADDPro pipeline is extremely cost-effective, efficient, and scalable.
The emergence of COVID-19 has brought the entire planet to a halt. Many countries, including India, were compelled to shut down most urban, industrial, social and other activities as a result of the pandemic. Due to a series of complete lockdowns imposed in India from March 24 to May 17, 2020, and state-wise local level restrictions afterward, have resulted in significant reduction of emissions of numerous atmospheric pollutants. The objective of this study is to analyse the change in concentration of various pollutants such as nitrogen oxide (NO2), carbon monoxide (CO) and aerosol optical depth (AOD) due to lockdown and also to quantify the contribution of crop stubble burning to air pollution. The Sentinel-5P based NO2 and CO observations for 2019 and 2020 and Moderate Resolution Imaging Spectroradiometer (MODIS)-based AOD observations for 2016–2020 were used for detecting the variations. The obtained results showed a significant decrease in NO2 levels during various stages of lockdown. Small decrease in CO levels was observed across most part of the India. With a few exceptions, such as coastal and desert regions, there was a moderate decrease in AOD levels. Furthermore, to study the contribution of NO2, CO and AOD from crop stubble burning, MODIS observations on active fire events were obtained from Visible Infrared Imaging Radiometer Suite (VIIRS). The burning of crop stubble increased NO2 emissions by 22 to 80%. CO levels, on the other hand, have risen by 7 to 25%. A considerable variation in AOD was reported, ranging from 1 to 426%.
Soil moisture is an important variable in the agriculture system. Likewise, accurate information on soil moisture is needed for the effective modeling of many hydrological and climatological processes. Synthetic Aperture Radar (SAR) operates with the competence to acquire data in any weather condition, has been proved to be sensitive to surface soil moisture. This study has attempted to establish simple experimental relationships to estimate volumetric bare surface soil moisture (smv) using the SAR satellite-based radar backscatter values (σ°). In this study, the in-situ smv measurements of two study sites in the United States were obtained from the SoilSCAPE project whereas σ° data for the same study sites were obtained from the C-band Sentinel-1 satellite. Initially, four experiments were designed based on various radar configurations i.e., combination of polarization and incidence angle(s) at an individual or combined node(s) of each study site. Following this, the statistical analysis in each experiment was carried out using the high volume data i.e., the long-term time-series σ° and in-situ smv that were clustered in these radar configurations. Subsequently, the relationships were established on the basis of outcome of each experiment. Based on the detailed analysis, it was found that out of four experiments, only one experiment outcome in terms of correlations statistics, for a particular radar configuration and study site, was found to be significant and accepted for model development. The derived model was applied and validated over the demo farm located in Pune, India. The comparison between the estimated and in-situ smv measurements shows good agreement, with a mapping accuracy of about 8% observed with the radar configuration- vertical-vertical (VV) polarization with a 43° incidence angle.
The present study focuses on using remote sensing techniques to estimate the Karakoram glacier velocity that emulates glacier’s reaction to climate warming. Proposed study is essential and critical due to the vast spatial and temporal variability of the Karakoram Glaciers, fieldwork difficulties, and the lack of in situ data in the Karakoram. It focuses on assessing the robustness in extracting the velocity products of the Rimo Glacier, Karakoram using DInSAR, Intensity tracking, and Normalized Cross-Correlation. The results indicate that the average velocity of the Rimo glacier estimated from DInSAR and correlation techniques are around 22.4 cm/day and 5.2 cm/day respectively which is similar to earlier studies. Intensity tracking based average velocity is found to be around 18 cm/day. Results obtained are also compared with field-based measurements for corroboration. Continuous monitoring of the velocity of Karakoram glaciers is necessary to understand the complex and evolving trends of surging in the future.
The Normalized Difference Vegetation Index (NDVI) is a useful index for vegetation monitoring. However, due to cloud cover the observations of NDVI are discrete and vary in the intensity. Therefore, there is a need to estimate the NDVI during cloud cover using alternative sources of satellite observations. The main objective of this study is to estimate NDVI during cloudy conditions using moderate resolution multi-spectral and synthetic aperture radar (SAR) observations. Two approaches were identified: 1) pixel replacement and 2) machine learning based regression analysis to estimate cloud free NDVI. Moderate Resolution Imaging Spectroradiometer (MODIS) 8-day NDVI composite, Sentinel-1 SAR and cloud masked Sentinel-2 multi-spectral observations were collected for entire cropping season. The satellite observations were selected only for agricultural areas by applying the agriculture, non-agriculture land use land cover mask. Machine learning algorithms such as Linear Regression (LR), Random Forest Regression (RFR), and Support Vector Regression (SVR) were used for NDVI estimation. Regression analysis was performed using Sentinel-2 NDVI as an independent variable and VV, VH, Cross Ratio (i.e., VV/VH), and MODIS NDVI as dependent variables. NDVI of the cloudy pixel was estimated using the trained regression models over the agriculture areas. A regression model was trained and applied to each Sentinel-2 tile that covers an area of 100 km × 100 km. The RFR and SVR showed the highest R2 of 0.73 and a RMSE of 0.12. A visual comparison of time series graphs showed good alignment between actual (Sentinel-2) and predicted NDVI and usual crop growth trend.
 Srinivasu Pappula合作论文数26
 Jayantrao Mohite合作论文数Tata Consultancy Serv, TCS Res & Innovat24Suryakant Sawant合作论文数19Ajit Sawant合作论文数11
 RAAJ Ramsankaran合作论文数Department of Civil Engineering, Birla Institute of Technology & Sciences11J. D. Mohite合作论文数5
 Daniel Farinotti合作论文数Department of Civil, Environmental and Geomatic Engineering, ETH Zurich3
 Matthias Huss合作论文数Versuchsanstalt für Wasserbau, Hydrologie und Glaziologie, Eidgenössische Technische Hochschule Zürich3
 Antoine Rabatel合作论文数EDYTEM, CNRS3Nandan Rajpoot合作论文数2Paul Willem Leclercq合作论文数2Sangita Kumari合作论文数2Johannes J. Fuerst合作论文数2Rishabh Agarwal合作论文数2Anshuman Bhardwaj合作论文数2
 Prateek Gantayat合作论文数Independent Reasercher2
 Douglas Brinkerhoff合作论文数Department of Computer Science, University of Montana2
 Ward J. J. van Pelt合作论文数Dept Earth Sci, Uppsala Univ2
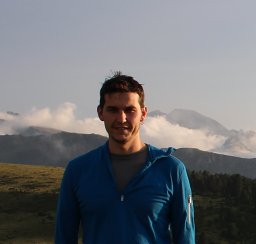 Fabien Maussion合作论文数Dept Atmospher & Cryospher Sci, Univ Innsbruck2
 Mathieu Morlighem合作论文数Department of Earth Sciences, Faculty of Arts and Sciences, Dartmouth College2Horst Machguth合作论文数Department of Geography;University of Zurich-Irchel;Department of Geography, University of Zurich-Irchel2Fabien Gillet-Chaulet合作论文数2
 Liss Marie Andreassen合作论文数Norwegian Water Resources and Energy Directorate2Huilin Li合作论文数2
 Thomas J. Reerink合作论文数Institute for Marine;Atmospheric research Utrecht;Utrecht University;Institute for Marine, Utrecht University2Harendra Singh Negi合作论文数1Kamal Kumar合作论文数1Sivaranjani Sivalingam合作论文数1
 Mayank Sharma合作论文数1
 Neha Kanda合作论文数1
 Rouges Emmanuel合作论文数1Olivier Sanchez合作论文数1
 Carlos Martin合作论文数1
 Andrea Fischer合作论文数Inst Interdisciplinary Mt Res, Austrian Acad Sci1
 Anita Chandrasekharan合作论文数Hydroremote Sensing Applicat HRSA Grp, Indian Inst Technol1
 Peter Alexander Stentoft合作论文数Dept Appl Math & Comp Sci, Tech Univ Denmark DTU1Erik Tamre合作论文数1
 Cyrille Mosbeux合作论文数Institute of Geophysics and Planetary Physics Scripps Institution of Oceanography, University of California San Diego1
 Mariappan Sakkan合作论文数TCS Research and Innovation1Daniel Binder合作论文数1
 Mohd Farooq Azam合作论文数Dept Civil Engn, Indian Inst Technol Indore1
 Johannes Landmann合作论文数Swiss Fed Inst Forest Snow & Landscape Res WSL1
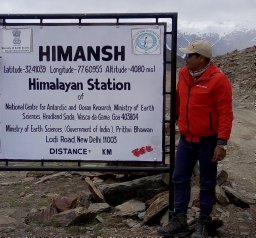 Parmanand Sharma合作论文数Govt India, Natl Ctr Polar & Ocean Res1
 Dhulipala Krishnaveni合作论文数1A. Ganju合作论文数1I. I. Lavrentiev合作论文数1
 Ramanathan Alagappan合作论文数Environmental Geology, Hydrogeochemistry, Biogeochemistry and Glaciology Laboratory, School of Environmental Sciences, Jawaharlal Nehru University1
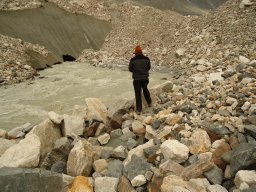 Anant Kumar合作论文数Snow & Avalanche Study Estab1K. K. Singh合作论文数1




