The International Panel on Climate Change (IPCC) has made it clear that a reduction in carbon emissions and a promotion in carbon sequestration are necessary in order to prevent the planet from reaching catastrophic warming levels of 1.5 degrees C globally. The IPCC identifies the investment in "high-carbon ecosystems" as a potential mitigation strategy, with one such ecosystem being wetlands. Historically, the majority of the world's wetlands have been destroyed due to human activities, with the midwestern U.S. being one of the most affected regions. Only in recent history has the U.S. sought to remedy this by mandating the construction of wetlands to replace those that are drained. While long-term carbon sequestration rates for natural wetlands are well-documented, it is unknown how constructed wetlands sequester carbon long-term. The Olentangy River Wetland Research Park (ORWRP) in Columbus, Ohio, USA is an ideal location to research this due to its extensive datasets collected over 29 years of biogeochemical and ecological monitoring. We used soil core samples taken across two constructed freshwater wetlands to quantify carbon storages and paired this data with similar studies at 18-month, 10-year, and 15-year milestones to create a timeline of carbon sequestration across 29 years. Our findings suggest that both wetlands have sequestered relatively equal amounts of carbon since construction and neither have shown a net gain or loss since year 15. At year 29, the average carbon storage between both wetlands is 3.58 +/- 2.21 kg C m(-2) which equates to 0.12 +/- 0.08 kg C m(-2) yr(-1), which is similar to other constructed wetlands. Results indicate that these wetlands likely have reached stability and are not expected to exhibit future carbon gains or losses under current conditions. Because these and other constructed wetlands have greater carbon sequestration rates than other options for conversion of croplands, they represent a successful climate change mitigation strategy.
Marine kelp forests cover 1/3 of our world's coastlines, are heralded as a nature-based solution to address socio-environmental issues, connect hundreds of millions of people with the ocean, and support a rich web of biodiversity throughout our oceans. But they are increasingly threatened with some areas reporting over 90% declines in kelp forest cover in living memory. Despite their importance and the threats they face, kelp forests are entirely absent from the international conservation dialogue. No international laws, policies, or targets focus on kelp forests and very few countries consider them in their national policy. The Kelp Forest Challenge addresses that gap. Together with 252 kelp experts, professionals, and citizens from 25 countries, the Kelp Forest Challenge was developed as a grassroots vision of what the world can achieve for kelp forest conservation. It is a global call to restore 1 million and protect 3 million hectares of kelp forests by 2040. This is a monumental challenge, that will require coordination across multiple levels of society and the mobilization of immense resources. Pledges may therefore include area for protection or restoration, enabling pledges which assist in conservation (funding, equipment, professional expertise, capacity building), or awareness-based pledges which increase awareness or education about kelp forests. Correspondingly, participants may be from government, scientific institutions, private sector, NGOs, community groups, or individuals. This challenge is the beginning of a 17-year mission to save our kelp forests and anyone and any organisation is invited to participate.
Effective restoration planning tools are needed to mitigate global carbon and biodiversity crises. Published spatial assessments of restoration potential are often at large scales or coarse resolutions inappropriate for local action. Using a Tanzanian case study, we introduce a systematic approach to inform landscape restoration planning, estimating spatial variation in cost-effectiveness, based on restoration method, logistics, biomass modelling and uncertainty mapping. We found potential for biomass recovery across 77.7% of a 53 000 km 2 region, but with some natural spatial discontinuity in moist forest biomass, that was previously assigned to human causes. Most areas with biomass deficit (80.5%) were restorable through passive or assisted natural regeneration. However, cumulative biomass gains from planting outweighed initially high implementation costs meaning that, where applicable, this method yielded greater long-term returns on investment. Accounting for ecological, funding and other uncertainty, the top 25% consistently cost-effective sites were within protected areas and/or moderately degraded moist forest and savanna. Agro-ecological mosaics had high biomass deficit but little cost-effective restoration potential. Socio-economic research will be needed to inform action towards environmental and human development goals in these areas. Our results highlight value in long-term landscape restoration investments and separate treatment of savannas and forests. Furthermore, they contradict previously asserted low restoration potential in East Africa, emphasizing the importance of our regional approach for identifying restoration opportunities across the tropics. This article is part of the theme issue ‘Understanding forest landscape restoration: reinforcing scientific foundations for the UN Decade on Ecosystem Restoration’.
The ocean is gaining prominence in climate change policy circles as a tool for addressing the climate crisis. Blue carbon, the carbon captured and stored by marine and coastal ecosystems and species, offers potential as a “nature-based solution” to climate change. The protection and restoration of specific ocean ecosystems can form part of a climate response within climate mitigation policies such as Nationally Determined Contributions under the United Nations Framework Convention on Climate Change. For mitigation policies that seek to implement management actions that drawdown carbon, ecosystem sequestration and emissions must be measurable across temporal and spatial scales, and management must be practical leading to improved sequestration and avoided emissions. However, some blue carbon interventions may not be suitable as a climate mitigation response and better suited for other policy instruments such as those targeted toward biodiversity conservation. This paper gives context to numerous blue carbon sequestration pathways, quantifying their potential to sequester carbon from the atmosphere, and comparing these sequestration pathways to point-source emissions reductions. The applicability of blue carbon is then discussed in terms of multiple international policy frameworks, to help individuals and institutions utilize the appropriate framework to reach ocean conservation and climate mitigation goals.
Open AccessMoreSectionsView PDF ToolsAdd to favoritesDownload CitationsTrack Citations ShareShare onFacebookTwitterLinked InRedditEmail Cite this article Wills Abigail R., Shirima Deo D., Villemaire-Côté Olivier, Platts Philip J., Knight Sarah J., Loveridge Robin, Seki Hamidu, Waite Catherine E., Munishi Pantaleo K. T., Lyatuu Herman, Bernal Blanca, Pfeifer Marion and Marshall Andrew R. 2023Correction to: 'A practice-led assessment of landscape restoration potential in a biodiversity hotspot' (2022) by Wills et al.Phil. Trans. R. Soc. B3782022047220220472http://doi.org/10.1098/rstb.2022.0472SectionOpen AccessCorrectionCorrection to: 'A practice-led assessment of landscape restoration potential in a biodiversity hotspot' (2022) by Wills et al. Abigail R. Wills Abigail R. Wills http://orcid.org/0000-0003-3370-156X Google Scholar Find this author on PubMed Search for more papers by this author , Deo D. Shirima Deo D. Shirima Google Scholar Find this author on PubMed Search for more papers by this author , Olivier Villemaire-Côté Olivier Villemaire-Côté Google Scholar Find this author on PubMed Search for more papers by this author , Philip J. Platts Philip J. Platts http://orcid.org/0000-0002-0153-0121 Google Scholar Find this author on PubMed Search for more papers by this author , Sarah J. Knight Sarah J. Knight Google Scholar Find this author on PubMed Search for more papers by this author , Robin Loveridge Robin Loveridge http://orcid.org/0000-0002-0691-9363 Google Scholar Find this author on PubMed Search for more papers by this author , Hamidu Seki Hamidu Seki Google Scholar Find this author on PubMed Search for more papers by this author , Catherine E. Waite Catherine E. Waite http://orcid.org/0000-0003-3092-5867 Google Scholar Find this author on PubMed Search for more papers by this author , Pantaleo K. T. Munishi Pantaleo K. T. Munishi Google Scholar Find this author on PubMed Search for more papers by this author , Herman Lyatuu Herman Lyatuu Google Scholar Find this author on PubMed Search for more papers by this author , Blanca Bernal Blanca Bernal Google Scholar Find this author on PubMed Search for more papers by this author , Marion Pfeifer Marion Pfeifer http://orcid.org/0000-0002-6775-3141 Google Scholar Find this author on PubMed Search for more papers by this author and Andrew R. Marshall Andrew R. Marshall http://orcid.org/0000-0002-3261-7326 Google Scholar Find this author on PubMed Search for more papers by this author Abigail R. Wills Abigail R. Wills http://orcid.org/0000-0003-3370-156X Google Scholar Find this author on PubMed , Deo D. Shirima Deo D. Shirima Google Scholar Find this author on PubMed , Olivier Villemaire-Côté Olivier Villemaire-Côté Google Scholar Find this author on PubMed , Philip J. Platts Philip J. Platts http://orcid.org/0000-0002-0153-0121 Google Scholar Find this author on PubMed , Sarah J. Knight Sarah J. Knight Google Scholar Find this author on PubMed , Robin Loveridge Robin Loveridge http://orcid.org/0000-0002-0691-9363 Google Scholar Find this author on PubMed , Hamidu Seki Hamidu Seki Google Scholar Find this author on PubMed , Catherine E. Waite Catherine E. Waite http://orcid.org/0000-0003-3092-5867 Google Scholar Find this author on PubMed , Pantaleo K. T. Munishi Pantaleo K. T. Munishi Google Scholar Find this author on PubMed , Herman Lyatuu Herman Lyatuu Google Scholar Find this author on PubMed , Blanca Bernal Blanca Bernal Google Scholar Find this author on PubMed , Marion Pfeifer Marion Pfeifer http://orcid.org/0000-0002-6775-3141 Google Scholar Find this author on PubMed and Andrew R. Marshall Andrew R. Marshall http://orcid.org/0000-0002-3261-7326 Google Scholar Find this author on PubMed Published:26 December 2022https://doi.org/10.1098/rstb.2022.0472This article corrects the followingResearch ArticleA practice-led assessment of landscape restoration potential in a biodiversity hotspothttps://doi.org/10.1098/rstb.2021.0070 Abigail R. Wills, Deo D. Shirima, Olivier Villemaire-Côté, Philip J. Platts, Sarah J. Knight, Robin Loveridge, Hamidu Seki, Catherine E. Waite, Pantaleo K. T. Munishi, Herman Lyatuu, Blanca Bernal, Marion Pfeifer and Andrew R. Marshall volume 378issue 1867Philosophical Transactions of the Royal Society B: Biological Sciences14 November 2022Phil. Trans. R. Soc. B378, 20210070. (Published online 14 November 2022). (https://doi.org/10.1098/rstb.2021.0070)In the original version of this article the authors' affiliations were listed incorrectly.This has now been corrected on the publisher's website to the following:Abigail R. Wills1,†, Deo D. Shirima2,11, Olivier Villemaire-Côté3, Philip J. Platts1,4,5, Sarah J. Knight1, Robin Loveridge1,6, Hamidu Seki1, Catherine E. Waite10, Pantaleo K. T. Munishi2, Herman Lyatuu11, Blanca Bernal8, Marion Pfeifer9 and Andrew R. Marshall1,10,11,12,††These authors contributed equally to this manuscript. Previous ArticleNext Article VIEW FULL TEXT DOWNLOAD PDF FiguresRelatedReferencesDetailsRelated articlesA practice-led assessment of landscape restoration potential in a biodiversity hotspot14 November 2022Philosophical Transactions of the Royal Society B: Biological Sciences This Issue13 February 2023Volume 378Issue 1870Theme issue 'Concepts in interaction: social engagement and inner experiences' compiled and edited by Anna M. Borghi, Albertyna Osinska, Andreas Roepstorff and Joanna Raczaszek-Leonardi Article InformationDOI:https://doi.org/10.1098/rstb.2022.0472PubMed:36571139Published by:Royal SocietyPrint ISSN:0962-8436Online ISSN:1471-2970History: Manuscript received16/11/2022Manuscript accepted16/11/2022Published online26/12/2022Published in print13/02/2023 License:© 2022 The Authors.Published by the Royal Society under the terms of the Creative Commons Attribution License http://creativecommons.org/licenses/by/4.0/, which permits unrestricted use, provided the original author and source are credited. Citations and impact Subjectsecology
Plastic pollution is now present in all areas of our planet, including its last wilderness, Antarctica, and the plastic crisis has further escalated because of COVID-19. The pandemic has caused a significant increase in the global consumption of single-use protective items such as masks and gloves. These and other plastic items add to the suite of plastic pollution issues, from entanglement of wildlife to microplastic bioaccumulation. Given plastics are a major threat facing humans and wildlife, swift action to reduce plastic pollution is urgently needed. Solutions to plastic pollution are within reach. With collective, impactful action we will ensure a better future for our planet and ourselves. Here, we propose several measures for decision-makers to implement to achieve a solution and tackle plastic pollution as a united, global community.
Invasion of plant species with functional traits that influences the rhizosphere can have significant effects on soil organic matter (SOM) dynamics if the invasive species stimulates soil microbial communities with, for example, an enhanced supply of labile carbon and oxygen. We evaluated these effects along a Phragmites invasion chronosequence spanning over 40 years. Using a δ13C and δ15N enriched substrate, we separated SOM-derived and substrate-derived carbon (C) and nitrogen (N) mineralization in surface (top 15 cm), shallow (30-45 cm), and deep (65-80 cm) soils collected from established, newly invaded, and native plant communities. We found all soils were susceptible to SOM priming, but priming profiles differed between vegetation communities, being highest at the surface in native assemblage soils, whereas highest at depth under invasive plants. Changes in functional microbial community composition at depth in Phragmites soils, evidenced by an increase in relative fungal laccase abundance, explained the SOM priming in these deep invaded soils. Our results show that invasive Phragmites maintains a microbial community at depth able to degrade SOM faster than that under native vegetation, evidencing that plant species shifts can fundamentally change soil biogeochemistry, altering element cycling and decreasing SOM residence time. Furthermore, our experimental design allowed to quantify real-time SOM-C and SOM-N gross mineralization, resulting in a new model relating C and N mineralization in these wetland soils and providing new insights on how SOM decomposition impacts N availability and cycling across wetland N pools.
Drainage canals have triggered peat subsidence and lowered groundwater table, enabling wildfires and peat degradation in Riau, Indonesia. This study examines the changes on groundwater table, peat subsidence rate, and carbon emission in response to deforestation and land cover changes. We established 31 study sites in some land cover types (i.e., oil palm plantation, acacia regrowth and shrub), with 124 monitoring shallow wells and 31 subsidence poles that were setup and have been monitored for 18 months. Groundwater table of all plots averaged -55 cm in Dosan Village, higher than that in Dayun Village (-66 cm). In accordance, peat had subsided in faster rate (8.4 cm year −1 ) in Dayun Village than that in Dosan (3.3 cm year −1 ). This average annual groundwater table has resulted in carbon emissions from peat decomposition up to 66 t CO 2 eq ha −1 year −1 . On the other hand, canal discharge of these sites ranged from 2 to 73 dm 3 s −1 , averaging 26 dm 3 s −1 . These results evidence that land uses converted from peat forest, and the dimension of canal control the decrease in groundwater table, the pace of peat subsidence, and rate of carbon emissions in tropical peatlands.
The objective of this study is to conduct a comparative study of the tourist load capacity of MSMEs in the state of Baja California, Mexico and Bucaramanga and Medellin, Colombia. This study is quantitative, quantitative and transversal; The statistical sample consists of 522 tourist companies. The results show that both are as attractive tourist destinations and that important areas of improvement with regard to their tourist load capacity in each of the dimensions studied.
Completeness is an important element for Reducing Emissions from Deforestation and forest Degradation (REDD+) accounting to ensure transparency and accountability. However, including a full accounting for all emission sources in a REDD+ program is often resource-intensive and cost-prohibitive, especially considering that some emission sources comprise far less than 10% of total emissions and are thus considered insignificant according to Intergovernmental Panel on Climate Change (IPCC) guidance. This is evident in forest reference emission level (FREL)/forest reference level (FRL) submissions to the United Nations Framework Convention on Climate Change (UNFCCC). Of the 50 countries that have submitted FRELs to date, only half of them include degradation in their FRELs even though degradation is often a significant source of emissions. Half of the countries that do include degradation use satellite imagery without necessarily specifying degrading activities or separating anthropogenic activities. Guyana provides an example of an approach that enables inclusion of all emission sources while considering the significance of each when developing an accounting approach. Since submitting its FREL in 2014, Guyana has made stepwise improvements to its emission estimates so that the country is now able to report on all deforestation and degradation activities resulting in emissions, whether significant or not. Based on the example of Guyana’s efforts, the authors recommend a simple approach to move towards complete accounting in a cost-effective manner. This approach can be scaled to other countries with other activities that results in greenhouse gas emissions from deforestation and forest degradation. Such complete accounting allows for higher accountability in REDD+ systems and can lead to greater effectiveness in reducing emissions.
Forest landscape restoration (FLR) has been adopted by governments and practitioners across the globe to mitigate and adapt to climate change and restore ecological functions across degraded landscapes. However, the extent to which these activities capture CO2 with associated climate mitigation impacts are poorly known, especially in geographies where data on biomass growth of restored forests are limited or do not exist. To fill this gap, we developed biomass accumulation rates for a set of FLR activities (natural regeneration, planted forests and woodlots, agroforestry, and mangrove restoration) across the globe and global CO2 removal rates with corresponding confidence intervals, grouped by FLR activity and region/climate.
Ecosystem services are becoming increasingly important and a reason to promote the sustainable use of natural resources. Wetlands provide many valuable ecosystem services, including carbon (C) sequestration. Wetlands are an important C sink, playing a key role in climate regulation. As such, their ability to sequester C is being considered in national GHG emissions assessments and private initiatives as a potential source of revenue to manage carbon-balanced landscapes and pay for ecosystem services. To be able to implement these initiatives widely some aspects of wetland carbon science and practice still need to be formalized and standardized. Here we synthesize the scientific basis of the biogeochemical processes that drive C sequestration in wetlands and assess the methods available for its measurement. We have reviewed data in 110 peer-reviewed studies form wetlands around the world and provide an overview of the current policies and guidelines in which C sequestration in wetlands is framed as an ecosystem management practice. The intention of this review is to provide a wide and comprehensive summary of C sequestration in wetlands, from science to practice. This analysis can help inform practitioners and land-scape managers in future considerations regarding project design and policy implementation, improve current climate mitigation schemes and payment for ecosystem services frameworks, and foster the worldwide implementation of wetland restoration, creation, and conservation projects for sustainable development and climate change mitigation and adaptation. (C) 2017 Elsevier B.V. All rights reserved.
Timber harvest from tropical regions generates seven billion dollars annually in exports and is estimated to occur across 20% of the area of remaining tropical forests. This timber harvesting is estimated to account for more than one in eight of all greenhouse gas emissions from tropical forests. Yet there is currently no means to independently estimate extracted volumes and associated greenhouse gas emissions. In this study, we built upon an earlier paper that used an automated algorithm applied to LiDAR to accurately identify area of timber harvest impact in the categories of roads/decks, skid trails and gaps. This algorithm was applied to 2014 harvest areas in four concessions in Kalimantan, Indonesia. In two of these concessions, total harvested timber volumes and greenhouse gas emissions were measured and calculated in the field using data from 188 harvested and extracted trees. In order to relate remote sensing data with the estimated extracted volumes, we calculated factors that linked extracted timber volumes with greenhouse gas emissions, and applied three different regression equations. The parameters of the most accurate equation were the areas of roads, skid trails and gaps, explaining 87% of the variation in the data. For situations where rivers are used in place of roads for extracting timber and for instances of non-mechanized, often illegal logging, a second equation was created in which only skid trail and gap attribute data were used, and in this equation 86% of the variation was accounted. The final equation, intended for use in scenarios where LiDAR data are not available but moderate resolution imagery could be used, associated length of roads only with extracted volumes. In this case, 78% of the variation was explained. Application of the first equation permitted estimation of extracted volumes and associated greenhouse gas emissions from two additional logging concessions. We discuss the application of these equations to areas that have been identified as illegal logging concessions, and propose that these may be applied to larger regions across the country. These equations offer a way to estimate volumes of timber extraction when no ground data is available, and to calculate greenhouse gas emissions associated with extracted volumes, providing a simple methodology useful across forested tropical countries.
The IPCC 2013 Wetlands Supplement provided new guidance for countries on inclusion of wetlands in their National GHG Inventories. The United States has responded by including managed coastal wetlands for the first time in its 2017 GHG Inventory report along with an updated time series in the most recent 2018 submission and plans to update the time series on an annual basis as part of its yearly submission to the United Nations Framework Convention on Climate Change (UNFCCC). The United States followed IPCC Good Practice Guidance when reporting sources and sinks associated with managed coastal wetlands. Here we show that intact vegetated coastal wetlands are a net sink for GHGs. Despite robust regulation that has protected substantial stocks of carbon, the United States continues to lose coastal wetlands to development and the largest loss of wetlands to open water occurs around the Mississippi Delta due mostly to upstream changes in hydrology and sediment delivery, and oil and gas extraction. These processes create GHG emissions. By applying comprehensive Inventory reporting, scientists in the United States have identified opportunities for reducing GHG emissions through restoration of coastal wetlands that also provide many important societal co-benefits.
 William J. Mitsch合作论文数Florida Gulf Coast University;The Ohio State University16
 Amanda M. Nahlik合作论文数Olentangy River Wetland Research Park;Ohio State University;Olentangy River Wetland Research Park, Ohio State University6
 Tiffany G. Troxler合作论文数Southeast Environmental Research Center and Department of Biological Sciences, Florida International University5
 Li Zhang合作论文数4Steve Crooks合作论文数3
 Hamidu Seki合作论文数3Herman Lyatuu合作论文数3
 Catherine E Waite合作论文数Forest Research Institute, University of the Sunshine Coast3
 Olivier Villemaire-Cote合作论文数Ctr Etud Foret, Univ Laval3nate herold合作论文数3
 Robin Loveridge合作论文数3
 James R. Holmquist合作论文数Smithsonian Environmental Research Center3
 Andrew J. Marshall合作论文数Department of Anthropology, University of Michigan;Department of Ecology and Evolutionary Biology, University of Michigan;School of Environment and Sustainability, University of Michigan3
 Kristin B. Byrd合作论文数Department of Environmental Science, Policy and Management, University of California3
 P.K.T. Munishi合作论文数Department of Forest Biology, Sokoine University of Agriculture3John W. Mccombs合作论文数3Deo Shirima合作论文数3
 Timothy R H Pearson合作论文数3
 Patrick Megonigal合作论文数Biogeochemistry Lab, Smithsonian Environmental Research Center;George Mason University;University of Maryland3
 Thomas J. Mozdzer合作论文数Biology Department, Fairfield UniversityFairfield3
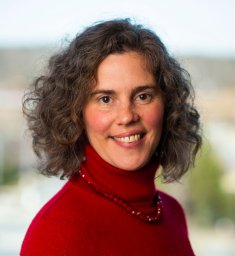 Ariana Sutton-Grier合作论文数USGS;Earth System Science Interdisciplinary Center;UMD3
 Philip J. Platts合作论文数Environment Department, University of York3
 Marion Pfeifer合作论文数University of Jena Institute of Ecology3
 Sarah J. Knight合作论文数Centre of Population Biology, Imperial College London3L. Windham‐Myers合作论文数2Lee‑Ann Ennis合作论文数2
 Simon Branigan合作论文数2Rietta Hohman合作论文数2Norah Eddy合作论文数2Betsy Peabody合作论文数2Sophie J I Koch合作论文数2Anita Giraldo-Ospina合作论文数2
 Jordi Boada合作论文数2Lynn Lee合作论文数2
 Finn Ross合作论文数2Tristin McHugh合作论文数Reef Check Fdn, Long Marine Lab, 115 McAllister Rd, Santa Cruz, CA 95060 USA2
 Bruno Cevallos合作论文数2
 Margalida Monserrat合作论文数Laboratoire d'Océanographie de Villefranche, Sorbonne Université2
 Reina J Veenhof合作论文数Faculty of Science and Engineering, Southern Cross University2
 Kelsey Miller合作论文数Institute of Marine Science, University of Auckland2
 Hannah S. Earp合作论文数Institute of Biological Environmental and Rural Sciences (IBERS),, Aberystwyth University2
 Hunter Forbes合作论文数2
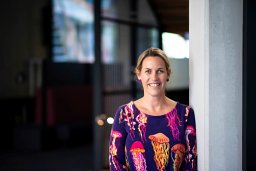 Prue Francis合作论文数2
 Duong Le合作论文数2
 Brian Timmer合作论文数University of Victoria2
 Shannen M Smith合作论文数Center for Marine Research, Ruđer Bošković Institute2
 Roberto A. Uribe合作论文数Área de Macroalgas y Biodiversidad, Instituto Del Mar Del Perú – IMARPE2
 Nur Arafeh-Dalmau合作论文数Univ Queensland, Sch Earth & Environm Sci, St Lucia, Qld, Australia2
 Bernabe Moreno合作论文数Inst Oceanol Polish Acad Sci2




