Objective: Shape-sensing robotic-assisted bronchoscopy is an emerging technology for the sampling of pulmonary lesions. We seek to characterize the shape-sensing robotic-assisted bronchoscopy learning curve at an academic center. Methods: Shape-sensing robotic-assisted bronchoscopy procedures performed by 9 proceduralists at a single institution were analyzed. Cumulative sum analyses were performed to examine diagnostic sampling and procedure time over each operator's first 50 cases, with the acceptable yield threshold set to 73%. Results: During the study period, 442 patients underwent sampling of 551 lesions. Each operator sampled 61 lesions (interquartile range, 60-63 lesions). Lesion size was 1.90 cm (interquartile range, 1.33-2.80 cm). The median procedure time for single-target cases decreased from 62 minutes during the first 10 cases to 39 minutes after case 40 (P < .001). The overall diagnostic yield was 72% (range, 58%-83%). Six of 9 operators achieved proficiency over the study period. An aggregated cumulative sum analysis of those who achieved competency demonstrated a steep improvement between lesions 1 and 21 and crossing of the competency threshold by lesion 25. Temporal analysis of yield-related lesion characteristics demonstrated that at approximately lesion 20, more challenging lesions were increasingly targeted, as evidenced by smaller target size, higher rates of unfavorable radial endobronchial ultrasound views, and a negative bronchus sign. Conclusions: Skills acquisition in shape-sensing robotic-assisted bronchoscopy is variable. Approximately half of proceduralists become facile with the technology within 25 lesions. After the initial learning phase, operators increasingly target lesions with more challenging features. Overall, these findings can inform certification and competency standards and provide new users with expectations related to performance over time.
Supplemental Figure S2. Relative expression on a per cell basis in KitV558Δ/+ tumors of (A) Trdv4 and (B) multiple genes known to be members of the SCART1+ γδ T cell phenotype. Dot plots represent scRNAseq data of γδ T cells from 6 mice as detailed in the methods section.
Viability of HG129 cells or T1 GIST cells after 24 hours of (A, B) human IL17a or (C, D) anti-human IL17Ra. Representative of 2 separate experiments with experimental groups in triplicate. Data represent mean ± SEM; p values were calculated using a two-sided Student’s t test; *, P < 0.05.
Abstract γδ T cells are a rare but potent subset of T cells with pleiotropic functions. They commonly reside within tumors but the response of γδ T cells to tyrosine kinase inhibition is unknown. To address this, we studied a genetically engineered mouse model of gastrointestinal stromal tumor (GIST) driven by oncogenic Kit signaling that responds to the Kit inhibitor imatinib. At baseline, γδ T cells were antitumoral, as blockade of either γδ T-cell receptor or IL17A increased tumor weight and decreased antitumor immunity. However, imatinib therapy further stimulated intratumoral γδ T cells, as determined by flow cytometry and single-cell RNA sequencing (scRNA-seq). Imatinib expanded a highly activated γδ T-cell subset with increased IL17A production and higher expression of immune checkpoints and cytolytic effector molecules. Consistent with the mouse model, γδ T cells produced IL17A in fresh human GIST specimens, and imatinib treatment increased γδ T-cell gene signatures, as measured by bulk tumor RNA-seq. Furthermore, tumor γδ T cells correlated with survival in patients with GIST. Our findings highlight the interplay between tumor cell oncogene signaling and antitumor immune responses and identify γδ T cells as targets for immunotherapy in GIST.
(A) Prevalence of IL17A+ γδ T cells in the spleens of KitV558Δ/+ mice after vehicle or imatinib treatment for 1 week. (B) Relative expression of Il6 by PCR of bulk KitV558Δ/+ tumors after 1 week of vehicle or imatinib. (C) Tumor weight in KitV558Δ/+ mice with 2 weeks of anti-IL23 therapy or isotype. Data are representative of 2 experiments each, 4 mice/experiment. Data represent mean ± SEM; p values were calculated using Student’s t test.
Supplemental Figure S1. (A) Alternate gating strategy for identifying γδ T cells in KitV558Δ/+ tumors by flow cytometry (B) Prevalence of γδ T cells as a percentage of T cells in KitV558Δ/+ mice across multiple anatomic compartments. (C) Percent of cells positive for IFNγ in KitV558Δ/+ tumor by flow cytometry after intracellular cytokine stimulation. (D) Histograms of flow cytometry staining for the transcription factors T-bet and EOMES in T cells from KitV558Δ/+ tumors. (E) Vγ2 expression in tumor and spleen γδ T cells from KitV558Δ/+ mice. Representative of 4 mice. Data represent mean ± SEM; p values were calculated using a two-sided Student’s t test; *, P < 0.05.
Supplementary Figure 3: the interaction between endogenous β-catenin and COP1 in human GIST specimens.
HIF1a mRNA expression in KitV558del/+ mice and 72h cell viability assay of GIST-T1 cells treated with ferric iron chloride + VLX600
Supplementary Figure 5: the effect of imatinib on Wnt/β-catenin signaling in Kit^V558Î"/+ tumors
Serum metabolic chemistries and splenic immune cell frequencies in VLX600-treated mice
ROS production in 2 week imatinib-treated and vehicle-treated KitV558del/+ murine CD45+ immune cells
Supplementary Table from Tyrosine Kinase Inhibition Alters Intratumoral CD8+ T-cell Subtype Composition and Activity
Real-time changes in OCR and ECAR in GIST-T1 cells treated with varying doses of VLX600 + imatinib
 Ronald P. DeMatteo合作论文数Department of Surgery, Perelman School of Medicine, University of Pennsylvania38
 Ferdinand Rossi合作论文数29Shan Zeng合作论文数27Jennifer K Loo合作论文数23
 Jennifer Zhang合作论文数Dermatology, Clinical Science Departments, Duke University School of Medicine, Duke University23Vitiello Gerardo A合作论文数23Liu M合作论文数Department of Pathology and Laboratory Medicine, Weill Cornell Medical College20
 Cristina R. Antonescu合作论文数Memorial Sloan-Kettering Cancer Center19Balachandran Vinod P合作论文数Department of Surgery, Memorial Sloan Kettering Cancer Center18
 Andrew Hanna合作论文数17
 Nesteene J Param合作论文数15Lillian Levin合作论文数15
 Seifert Adrian M合作论文数Department of Surgery, Memorial Sloan Kettering Cancer Center15Maltbaek J合作论文数School of Public Health, University of California14Timothy G Bowler合作论文数13Mark S. Etherington合作论文数12Beckman Michael J合作论文数12Kim Teresa S合作论文数Department of Surgery, Memorial Sloan Kettering Cancer Center11
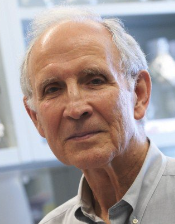 Peter Besmer合作论文数Memorial Sloan Kettering Cancer Center11Kevin Do合作论文数10
 Santamaria-Barria Juan A合作论文数Department of Surgery, Memorial Sloan Kettering Cancer Center10Crawley Megan H合作论文数10Cavnar Michael合作论文数10Ferdinando Rossi合作论文数9Julia N Zhao合作论文数Dept Surg, Mem Sloan Kettering Canc Ctr9
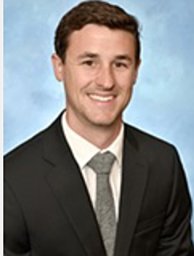 Tieniber Andrew D合作论文数Perelman School of Medicine, University of Pennsylvania9
 Justin R Cross合作论文数Novartis6Katherine J Tardy合作论文数5Hyunjee Kwak合作论文数5John Alec Moral合作论文数Mem Sloan Kettering Canc Ctr, 1275 York Ave, New York, NY 10021 USA3
 Molena Daniela合作论文数Department of Surgery, Johns Hopkins University3Ferdiando Rossi合作论文数2Amit Uppal合作论文数2
 Leandra S. Krowsoski合作论文数Department of Surgery, NYU Grossman School of Medicine2
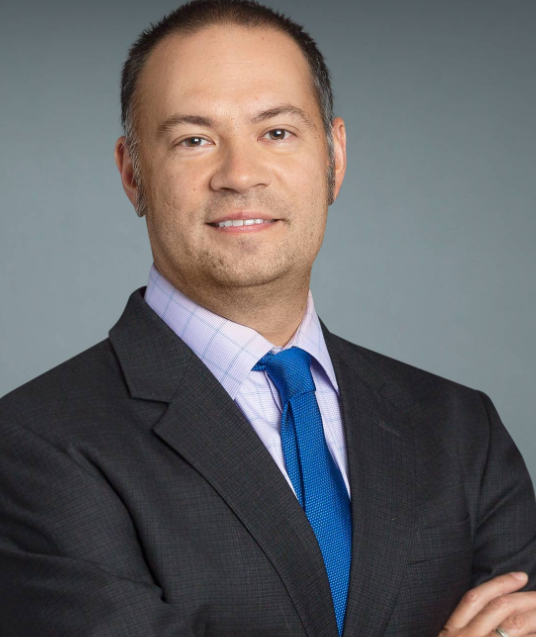 Marko Bukur合作论文数Division of Acute Care Surgery, Department of Surgery, Grossman School of Medicine, New York University2
 Vikramjit Mukherjee合作论文数Division of Pulmonary, Critical Care and Sleep Medicine, Department of Medicine, New York University Grossman School of Medicine;Bellevue Hospital Center, New York University2
 Kay See Tan合作论文数Department of Epidemiology & Biostatistics, Memorial Sloan Kettering Cancer Center2
 David R. Jones合作论文数Department of Surgery, Memorial Sloan-Kettering Cancer Center2
 Gaetano Rocco合作论文数Memorial Sloan Kettering Cancer Center2George Miller合作论文数2
 Matthew Bott合作论文数Department of Pathology;Memorial Sloan-Kettering Cancer Center;Department of Pathology, Memorial Sloan-Kettering Cancer Center2
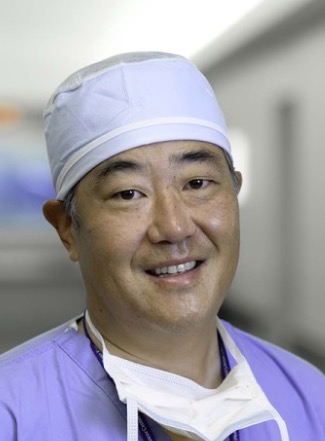 Bernard J. Park合作论文数Memorial Sloan Kettering Cancer Center2
 Charles J Dimaggio合作论文数Department of Population Health, NYU Grossman School of Medicine2
 Charles C. Hong合作论文数Department of Medicine, College of Human Medicine, Michigan State University;Proton Bio, Inc;Department of Medicine, School of Medicine, University of Maryland2
 Prasad S. Adusumilli合作论文数Department of Surgery, Memorial Sloan-Kettering Cancer Center;Cellular Therapeutics Center, Memorial Sloan-Kettering Cancer Center2Or Kalchiem-Dekel合作论文数1Marta Luksza合作论文数1Joseph Saglimbeni合作论文数1Nicolas Toumbacaris合作论文数1




