Over winter freeze-thaw events are notoriously difficult to represent in hydrologic models and have serious implications for the hydrologic function of intermittently freezing regions. Changing climate is leading to more frequent mid-winter thaw events. Midwinter thaw events are often the cause of flooding due to the combined impacts of snowmelt, precipitation, and limited soil infiltrability. A numerically efficient, semi-analytical coupled thermal and mass transport model is presented that represents the ice content of near-surface soil, and reports the depth of freezing/thawing. The model tracks pore ice formation and mean soil temperature in terms of enthalpy. It is tested against data collected in Southern Saskatchewan and is shown to capably reproduce field observations of frozen, thawed or transitioning soils. This numerically efficient model can be incorporated into regional hydrologic models where it is expected to improve predictions of soil ice content, leading to improved estimates of over-winter streamflow and flood potential.
Seasonally frozen ground (SFG) is a critical component of the cryosphere, yet its freezing dynamics are often oversimplified in large-scale monitoring frameworks - particularly in remote sensing (RS) and land surface modeling - through the use of binary 0 degrees C thresholds. This approach overlooks the physically significant "transitional" state where liquid water and ice coexist, leading to systematic errors in quantifying the timing and duration of the frozen season. To address this, we recast the Soil Freezing Characteristic Curve (SFCC) framework directly into permittivity-temperature space. By operating in dielectric space, we bypass the high uncertainty associated with soil-specific liquid water content calibrations and enable a robust categorization of soil into unfrozen, transitional, and frozen states. We fitted this model to in-situ measurements from eight monitoring networks (87 sites) across Canadian boreal forest, prairie, and tundra ecozones. Using Bayesian hierarchical partial pooling, we derived stabilized estimates of the freezing onset (Tf) and transition sharpness (b). Network-level Tf ranged from 0.15-0.44 degrees C, while b varied from 0.92-3.47 degrees C-1, reflecting distinct freezing regimes. We found that the transitional state is a dominant seasonal feature at these sites, challenging binary 0 degrees C assumptions used in RS evaluation. In high-moisture sites characterized by thick organic insulation (e.g., within the observed eastern boreal forest networks), this state persisted for over 100 d - effectively the entire winter - despite persistent subzero air temperatures. In contrast, sites in the western boreal and prairie networks, which generally lack thick surface organic layers and have lower soil moisture, exhibited shorter but still significant transitional periods (30 and 60 d, respectively). Even in the extreme cold of the tundra network sites, the transitional phase persisted for over 40 d. These results confirm that surface insulation and soil moisture, rather than air temperature alone, govern the SFG regime at the observed locations, providing a reproducible, physically-based reference framework for the next generation of freeze-thaw products.
This study evaluates the potential of L-band passive microwave data for monitoring soil moisture (SM) in boreal and temperate forests using SMAP and SMOS AM and PM overpasses. SMAP and SMOS Level 3 SM products were first assessed for spring and summer seasons. SMOS showed lower accuracy (r2 = 0.04–0.24, ubRMSE = 0.09–0.13 m3/m3), while SMAP performed better (r2 = 0.18–0.62, ubRMSE = 0.05–0.07 m3/m3) across sites and overpasses. Given the larger number of SMAP TB observations at a fixed incidence angle and greater temporal coverage over the study area, SMAP was selected for SM estimation using ML models. Feature importance analysis identified brightness temperature (TB) as the most influential variable, followed by vegetation water content (VWC), air and soil temperatures, and the microwave polarization difference index (MPDI). Soil and air temperatures were interchangeable during AM overpasses, whereas PM overpasses showed distinct differences, likely due to thermal absorption by dense vegetation. Using optimal features, SM was estimated with CatBoost, Gradient Boosting (GB), Random Forest (RF), and Principal Component Regression (PCR), using stratified shuffle split (SSS) and leave-one-year-out cross-validation (LOYOCV). In SSS, CatBoost achieved slightly higher accuracy than the other ensemble models (AM: r2 = 0.73; PM: R2 = 0.74), while PCR yielded substantially lower accuracy across both overpasses. LOYOCV showed closer rankings among models, with CatBoost ranking highest overall (r2 = 0.58 for AM and 0.54 for PM). Results highlight the feasibility of improved SM estimation in forests using L-band TB, VWC, temperature variables, and MPDI.
Forests are a critical component of the Earth system, accounting for approximately one-third of global photosynthetic activity and carbon storage. They also provide essential habitats for countless species and vital resources for human activities. Low-frequency (L-band; 1–2 GHz) microwave radiometry enables the measurement of forest soil moisture (SM) and L-band vegetation optical depth (L-VOD), offering valuable insights into processes such as tree growth, water infiltration, soil fertility, fuel moisture, carbon stocks, wildfire vulnerability, and biodiversity dynamics. These measurements also support the study of carbon and water fluxes, tree responses to hydrological stress (e.g., drought), and fuel moisture estimation. However, existing algorithms for retrieving SM and L-VOD were primarily developed for low-biomass vegetation types (e.g., grasslands and croplands), differing structurally from forests. This motivates the present review to evaluate the current retrieval approaches, their performance assessment methods, and available validation resources. The review found that systematic uncertainties persist in forest retrievals, despite the demonstrated sensitivity of L-band brightness temperature (TB) to forest SM and L-VOD. Moreover, the focus on non-forest ecosystems has led to a lack of suitable ground truth and reference data for validating forest SM and L-VOD products, and current validation techniques remain underdeveloped. To fully harness the potential of L-band radiometry in forest monitoring, new retrieval algorithms that account for the unique structural and compositional characteristics of forests are required. Additionally, validation efforts must be enhanced both quantitatively and qualitatively—particularly for L-VOD—to improve confidence in these remote sensing products.
Seasonal soil freeze-thaw (FT) transitions govern critical hydrological and biogeochemical processes across northern landscapes. While the physical state of freezing soil exists on a continuum heavily influenced by the zero-curtain effect—a prolonged thermodynamic period where latent heat exchange stabilizes temperatures near 0$^\circ$C, allowing liquid water and ice to coexist—operational passive microwave algorithms predominantly rely on binary classifications. This masks the extended and biogeochemically active partially frozen period. In this study, we developed a probabilistic, non-binary FT detection logistic model driven by multi-frequency passive microwave observations. This framework integrates the Soil Moisture Active Passive (SMAP) L-band Normalized Polarization Ratio ($Z_{NPR}$) with the Advanced Microwave Scanning Radiometer 2 (AMSR2) Normalized Difference V-Pol index ($Z_{NDV}$), derived from the 18.7 and 36.5~GHz vertical channels. To ensure robust generalizability, the model was trained and cross-validated using harmonized \textit{in situ} topsoil temperatures across diverse biomes in North America. Rather than relying on a rigid binary threshold, we employed a probabilistic ground-state labeling approach utilizing biome-specific Soil Freezing Characteristic Curves (SFCC) to mitigate target ambiguity and isolate high-confidence training data. Results demonstrate that the parsimonious two-feature model effectively discriminates between unfrozen, transitional, and fully frozen states. When evaluated against a 3-way unanimous consensus pseudo-truth (FT-SMAP, FT-ESDR, and FT-SMOS) across a randomized spatial sample, the model achieved match rates of 78.8--98.2\% and Cohen's Kappa values of 0.44--0.87 across five biomes, reflecting a clear performance gradient from canopy-dense Mixed Forests to open Tundra environments, with cross-validated F1 scores ranging from 0.36 to 0.91. Thermodynamic validation against ERA5 near-surface air temperature and \textit{in situ} soil records confirms that this mathematically defined transitional zone physically anchors to the latent heat of fusion. Ultimately, this interpretable framework offers a scalable, physically consistent methodology for mapping zero-curtain dynamics, providing critical non-binary baseline data for global carbon and climate modeling.
The Soil Moisture Active Passive mission (SMAP, since 2015) from The National Aeronautics and Space Administration's (NASA) and Soil Moisture and Ocean Salinity mission (SMOS, since 2009) from The European Space Agency's (ESA) measure polarimetric brightness temperature (TB) at L-band (1.4 GHz). They provide estimates of surface soil moisture (SM) and L-band vegetation optical depth (L-VOD) approximately every 2-3 days at the equator, with a spatial resolution of similar to 40 km for a local overpass time of 6 AM/PM. Integrating the AM and PM TB observations from SMAP and SMOS satellite missions can reduce the revisit time to about 1 day over the equator, thus helping to address fast-response hydrologic processes that cannot be addressed with the 2-3 day revisits. This will allow the capture of the SM conditions more often and, hence, capture the rate of decline due to drainage and recharge to groundwater. This occurs early during dry down after storms. The integration of SMOS measurements also works to fill temporal gaps caused by missing data due to SMAP instrument outages. This article details the integration of the SMAP and SMOS observations to achieve a combined SM and L-VOD product. The SMOS TB observations interpolated to 40 degrees incidence angle were first relatively calibrated (RC) to generate SMAP-like SMOS TB (RCTB), making the combined TB records consistent spatially and temporally. The SMAP baseline SM and L-VOD retrieval algorithm was then applied to the RCTB records. We showed that after relative calibration (ARC), the bias between the SMAP and SMOS TBs was reduced from 0.5 to -0.03 K for TB H and from 2.6 to 0.014 K for TB V in the AM cases. For the PM cases, the mean value of differences was reduced from 0.82 to 0.27 K and from 2.88 to 0.19 K for TB H and TB V, respectively. The comparison of the core validation sites (CVS) in situ SM to the retrieved SM from the combined TB record showed an unbiased root-mean-square-difference of 0.039 m3/m3 for both AM and PM cases and the retrieved L-VOD demonstrated consistency with independent biomass and tree height estimates. We also showed an improvement in temporal coverage and that the global mean number of visits to each grid went up from 283 (SMAP only) to 446 (SMAP+SMOS) when both AM and PM overpasses are considered.
Simultaneously estimating soil moisture (SM) and soil organic matter (OM) from microwave dielectric measurements has substantial value for sustainable agriculture and environmental monitoring, as both crop health and carbon sequestration depend heavily on these soil properties. However, existing dielectric mixing models often treat SM alone, neglecting the influence of OM and introducing discontinuities that complicate dualparameter optimization. Here, we propose a refined optimal estimation (OE) approach that seamlessly incorporates OM into dielectric modeling. Including OM in the dielectric modeling framework not only refines SM estimation but also provides a unique pathway for leveraging soil moisture sensors to assess soil carbon content. By carefully managing SM priors that contain OM-related uncertainties, the ambiguity typically associated with jointly estimating SM and OM is significantly reduced. Field data from the SMAP Validation Experiment 2012 (SMAPVEX12) strongly agree with the simultaneously estimated SM (R = 0.805, RMSE = 0.086 cm3cm-3), as well as OM validated against laboratory-derived organic matter from loss-on-ignition (R = 0.850, RMSE = 0.059 g-1). These improvements have direct implications for practical agricultural water management and ecological stewardship, especially when optimizing irrigation strategies or tracking carbon stocks. By enabling more accurate, spatially explicit, and temporally dynamic estimates of SM and OM, this method broadens the capabilities of remote sensing tools, ultimately aiding both farmers seeking to enhance soil health and environmental managers charged with carbon accounting. To our knowledge, this is the first demonstration of simultaneous SM-OM retrieval from in-situ 50 MHz dielectric measurements using optimal estimation, extending prior OM-aware dielectric modeling beyond singleparameter (SM-only) inversions. Notably, jointly estimating SM and OM improves SM itself relative to SM-only inversion (ubRMSE: 0.097 -> 0.074 m3 m-3), because explicitly accounting for OM variability prevents unmodeled OM from contaminating SM.
The boreal forest is the second largest terrestrial biome and owing to its vast extent, is a critical component of the global climate system, functioning as a major carbon reservoir and regulating land–atmosphere water and energy exchanges. However, boreal ecosystems are highly sensitive to climate-driven changes in water availability, exacerbating drought stress, wildfire risk, and widespread, drought-induced tree mortality, demonstrating the need for improved characterization of soil and plant water dynamics. More specifically, soil moisture is a fundamental control on boreal forest productivity and disturbance dynamics, governing water availability for transpiration, photosynthesis, and internal plant water storage. While microwave remote sensing instruments provide valuable large-scale soil moisture observations, their interpretation in forested environments remains challenging due to the combined influence of soil and vegetation water on the microwave signal and a lack of species-specific validation data. In particular, the contribution of internal plant water storage to microwave observations is poorly constrained in boreal ecosystems.In this study we examined coupled soil–plant water dynamics in a mixed boreal forest in central Saskatchewan as part of the SMAPVEX22-Boreal field campaign. Hourly measurements of real dielectric constant (RDC) were collected from near-surface organic soil (5 cm), mineral soil, and tree xylem across 27 forested sites during the 2022 growing season. Measurements focused on three dominant boreal species representing contrasting functional types: jack pine (Pinus banksiana), black spruce (Picea mariana), and trembling aspen (Populus tremuloides). To independently characterize internal plant water storage, destructive vegetation sampling was conducted to quantify gravimetric water content in primary branches, secondary branches (including foliage), and whole branches. Soil water potential was estimated using texture-based parameterizations to better represent plant-available water.Time series analyses revealed a strong and consistent relationship between soil RDC and tree xylem RDC, indicating tightly coupled soil–plant water dynamics throughout the growing season. Soil moisture exhibited greater short-term variability than tree RDC, while xylem RDC showed a gradual seasonal drydown and became less responsive to individual precipitation events as summer progressed. Pronounced species-specific differences were observed: trembling aspen exhibited significantly higher and more variable xylem RDC than the conifer species, whereas black spruce sites were characterized by persistently wetter soils associated with thicker organic layers. Lag-correlation analysis showed virtually no delay between soil moisture and tree RDC at an hourly timescale for jack pine and black spruce, and a short (~1 hour) lag for aspen, with the strongest correlations (~ 0.80) occurring in the mineral soil layer, suggesting the influence of relatively shallow rooting depth in water access strategies.These results reflect contrasting species-specific hydraulic strategies, with jack pine adapted to drier conditions and black spruce and aspen maintaining greater internal water storage. The strong, near-synchronous coupling between soil and plant water at hourly timescales suggests limited temporal separation between soil wetting and vegetation uptake in boreal forests, constraining their use as a signal-separation mechanism in microwave remote sensing. Thus, species-level hydraulic differences should be explicitly considered in soil moisture retrieval and validation frameworks.
Forests are one of the most essential components of the Earth system. They account for a large part of the total global photosynthetic activity, store a significant amount of the total carbon, and provide a habitat for countless species. At the same time, they offer critical resources to anthropogenic activities, such as timber, food, and firewood. Soil moisture (SM) plays a pivotal role in the processes governing all these functions. Low-frequency remote sensing is the only way to acquire a large spatial distribution of the forest SM because of its ability to carry the signal from the forest floor through the forest canopy to the satellite. Studies have shown that NASA's SMAP (Soil Moisture Active Passive) mission, measuring brightness temperature at 1.4 GHz (L-band), is sensitive to SM changes in forests despite the interference by the forest canopy. The challenge is to accurately account for the attenuation, scattering, and emission by the canopy. The SMAP Validation Experiment 2019-2022 (SMAPVEX19-22) in the temperate forests of the northeast US collected a vast amount of in situ and other experimental data to improve SMAP's SM and L-band vegetation optical depth (L-VOD) retrievals in forested areas. The results from the experiment have shown that the transmissivity is substantially higher in the spring no-leaf conditions than later in the season, suggesting that the seasonal water content changes and phenology significantly affect L-band TB. While the effect is seasonal, substantial changes in the L-VOD response occurred within days as the water content and phenological changes occurred harmoniously across the large SMAP footprint (tens of km). Moreover, the frozen season effect on the tree permittivity affected the SMAP L-VOD at daily timescales as the trees within the SMAP footprint underwent changes between frozen and thawed states. The results underline the need for the SM and L-VOD retrieval algorithms to account for the short-timescale changes.
Information on lake Water Surface Elevation (WSE) in the Arctic permafrost region is essential for understanding the impacts of climate warming on water storage and hydrological processes. The location of these lakes, in remote areas with limited access to in-situ monitoring capacity, remains a significant constraint in retrieving WSE. To overcome these issues, we leveraged the high spatial along-track resolution of ICESat-2, the higher temporal resolution of Sentinel-3, and the monitoring accuracy of installed gauges for retrieving WSE time series for several Arctic lakes. We derived in-situ WSE benchmark from 20 out of the 36 HOBOware gauges installed on a series of Arctic lakes over the non-frozen period spanning mid-June to the end of September 2022. The ICESat-2 ATL13 product (2018-2024) and Sentinel-3 SRAL data sets (2016-2024) were acquired over the study area. A multiple linear regression model (MLRM) was used to estimate bias between the different data sources. The comparison between in-situ measured WSE and whole-lake ICESat-2 WSE estimates revealed a root-mean-square-difference (RMSD) of 0.36 m, although with positive bias from ICESat-2. Using our in-situ data and MLRM, we calibrated the ICESat-2 product for this Arctic Lake region that produced an RMSD of 0.03 m. With the goal of combining the two WSE products from the ICESat-2 and the Sentinel-3 satellites to attain a WSE time series we compared the satellite products. The RMSD observed between ICESat-2 and the Sentinel-3 was 1.7 m for this region. To improve the time series WSE, we calibrated the instruments to each other, resulting in an RMSD of 0.17 m between the two satellites' WSE. After producing a combined WSE from the calibrated ICESat-2 and Sentinel-3, an accuracy assessment with the DAHITI database WSE revealed that our product had an RMSD of 0.03 m. This study demonstrates the combination of these sources of data towards WSE monitoring in Arctic lakes experiencing permafrost-related changes. It is also expected to serve as a baseline inventory for the recently launched SWOT altimetry satellites in producing long-temporal monitoring for the sizes of lakes in Arctic permafrost regions.
Arctic lake color and quality are changing in response to the warming climate, permafrost degradation, and intensifying disturbances. These changes have important implications on carbon and nutrient cycling, wildlife habitat, and water resources planning. However, the drivers, spatial distribution, and long-term trajectories of these changes remain poorly characterized on regional scales (∼100 km). In this study, we examined over 3,000 lakes in part of the Mackenzie Delta, Tuktoyaktuk Coastlands, and adjacent upland tundra in the Northwest Territories, Canada, to quantify both gradual and abrupt changes in lake color using harmonized Landsat time series from 1985 to 2022. Across the region, we found average declines of surface reflectance in the red and green bands by 13 % and 15 % over the last four decades, respectively. In comparison, the Normalized Difference Turbidity Index (NDTI) trends differed between sub-regions, with a decadal increase in the Tuktoyaktuk Coastlands and a decrease in the Mackenzie Delta. We identified a positive, lagged correlation between abrupt lake color change and mean summer air temperature (MSAT), particularly in the Tuktoyaktuk Coastlands (R = 0.7, lag = 2 years), indicating a delayed impact of warm summers on lake color. One important mechanism of such impact was lakeshore thaw slumping intensified by rising summer temperatures, with slump-affected lakes experiencing abrupt increases in surface reflectance and NDTI driven by sediment input. We identified fire as another important driver of lake color dynamics, which led to greater changes in lake surface reflectance (p < 0.01) and NDTI (p = 0.1) compared to surrounding lakes. These findings demonstrate the value of harmonized Landsat time series for characterizing multifaceted Arctic lake color dynamics, along with their drivers and impacts.
Satellite-based retrieval of forest soil moisture (SM) and vegetation optical depth (VOD) are two long-standing unresolved issues hindering advances in hydrology, ecology, and Earth system science. A key obstacle is the lack of adequate reference data in forested regions. NASA's Soil Moisture Active Passive (SMAP) mission, with its partners, conducted the SMAP Validation Experiment 2019-2022 (SMAPVEX19-22) to improve the SMAP SM and VOD retrievals in temperate forests of the northeastern USA. The scope and scale of the campaign exceeded anything done thus far to develop forest satellite-based SM and VOD retrieval algorithms. The field campaign measured SM, surface conditions, and vegetation properties, with results demonstrating the value of tree sensors with SM measurements and destructive sampling of the vegetation water content of branches and leaves to capture the water distribution in soil and trees. Using low-cost zenith-pointing cameras proved effective in tracking vegetation phenology, aiding the interpretation of brightness temperature (TB). Airborne and mobile terrestrial laser scanning measurements captured the three-dimensional forest structure necessary for microwave measurement interpretation. Challenges included characterizing SM in organic forest soils and determining volumetric SM due to spatially variable soil bulk density. Comparisons of the field measurements with SMAP data revealed its ability to retrieve the soil permittivity (correlation of 0.68 and 0.75 for the two experiment sites) alongside VOD, including the frozen conditions. The findings indicated that L-band scattering albedo is temporally variable, and L-band TB is sensitive to deciduous forest leaves, influencing the development of SM and VOD retrieval algorithms.
Repeatable methods capable of quantifying Arctic surface water extent at high resolutions are important, but still require development. Here, we present a study using very-high resolution (VHR) X-band Synthetic Aperture Radar (SAR) imagery from Capella Space for fine-scale semantic segmentation of Arctic surface water features. Our study proposes a modified U-Net encoder-decoder model for this task, optimized using the Nadam algorithm. Otsu thresholding was leveraged to rapidly generate 512 × 512-pixel patches for the U-Net, resulting in an efficient and automated training pipeline. Within this study, we also quantitatively compared the deep learning (DL) U-Net to a shallow machine learning (ML) algorithm, XGBoost (XGB), and evaluated the Capella Space imagery against spatially and temporally coincident Sentinel-1 C-band. Performance evaluations showed the U-Net outperforms XGB measured under several statistical metrics, reaching an Intersection over Union (IoU) of 0.955. An explainability analysis was conducted to complement this finding, using Gradient-weighted Class Activation Mapping (Grad-Cam). Visual analysis also underscored the extreme detail of small water features captured by Capella Space imagery, which are at times omitted or lack clarity in conventional Sentinel-1. This research makes several contributions to Arctic surface water mapping, demonstrating the effectiveness of combining VHR SAR imagery with DL.
Climate change greatly impacts forest carbon and water dynamics in the boreal biome. To understand the vulnerability of the North American boreal biome to climate change disturbances, including droughts and temperature extremes, a biome-wide characterization of near-surface soil moisture (SM) is essential. SM is an important control on photosynthetic carbon dioxide uptake and the associated evaporative loss of water through transpiration. Two missions with passive microwave radiometers operating at L-band (1-2 GHz) were launched to estimate SM at a global scale: soil moisture and ocean salinity (SMOS) launched in 2009 and soil moisture active passive (SMAP) launched in 2015. In this study, we analyzed the relationships between various microwave observations [brightness temperature (TB), soil reflectivity (r), and soil moisture (SM)] derived from SMOS and SMAP with in situ SM measurements (2016-2021) over 16 sites across the boreal biome of North America. Our results show good agreement between SMAP and SMOS in terms of relationships between TB and in situ SM measurements (with a coefficient of determination R (2) > 0.7). Analysis comparing microwave variables (TB, r, and SM) and in situ SM data demonstrated considerable differences across sites and years. We observed moderate to strong correlation coefficients (R_TB > 0.5) between the TB and in situ SM data, generally when a seasonal soil drying trend emerges over the summer. However, soils with high water content and frequent precipitation input showed weaker correlations between TB and in situ SM. By analyzing the correlations between r and in situ SM data, we demonstrated that the soil effective temperature partly affects performances in terms of R_TB. Comparisons with other SMAP SM retrievals (multitemporal dual-channel algorithm and multichannel collaborative algorithm) revealed similar results in correlations and showed high spatiotemporal differences across all SM retrievals and study sites. Our findings highlight the complexity of the interactions between microwave observations and SM dynamics across the boreal biome, thus challenging the L-band passive microwave SM retrievals.
Abstract. We present a novel method for surface freeze/thaw (F/T) classification based on L-band brightness temperature (TB), as measured by the Soil Moisture Active Passive (SMAP) mission, combined with thermodynamic temperature estimates, whether in situ or derived from near real-time model output. Variations in the cryosphere have significant, lasting impacts on physical, biological, and social systems, and act as sensitive indicators of climate change. Remote sensing at microwave frequencies is uniquely suited for monitoring the cryosphere’s spatial and temporal dynamics. Indeed, SMAP was tasked with providing a daily classification of the surface F/T state as one of two primary mission goals. Although surface F/T events are extrinsically driven phenomena, most existing classification algorithms rely on intrinsic thresholds – those derived from single-variable observables – that may not accurately reflect in situ conditions. Meanwhile, soil physicists have long used a robust framework to study the relationship between unfrozen water content and sub-freezing temperature, known as the soil freezing characteristic curve (SFC). These curves, and to a lesser extent their soil thawing characteristic curve (STC) branches, have been well studied in laboratory settings using a variety of instruments and methods. These concepts have not been extended to remote sensing (RS) until now. The remotely sensed surface freezing characteristic curves (SurFCs) introduced here are the satellite-pixel-scale counterpart to SFCs. SurFCs are constructed with SMAP TB measurements, which are inversely correlated with water content, along with thermodynamic temperature records at two mid-latitude sites. We used in situ temperature data from SMAP core validation sites near Kenaston, Saskatchewan and Carman, Manitoba, covering a combined total of nine years, alongside modelled temperature estimates from the Goddard Earth Observing System Model, Version 5 Forward Processing product (GEOS-5 FP). SurFCs constructed with in situ soil temperatures showed a structure like that of SFCs, including analogue thawing branches, identified as surface thawing characteristic curves (SurTCs). Lastly, we show SurTCs can serve as a tool for identifying extrinsic thresholds – transition points linked to both the system’s physical state and its external drivers – enhancing the realism and operational accuracy of satellite-based F/T classification. Overall, the proposed TBHmin approach improved detection accuracy by 39.4 % compared to the widely used Normalized Polarization Ratio (NPR) method. This analysis challenges the prevailing assumption that 0.15 °C is a universal F/T threshold. Instead, we argue that the threshold should be determined from measurements of the system’s physical response and environmental forcing (SurFC/SurTC). Although useful, a 0.15 °C classifier is not uniformly applicable across freeze–thaw phenomena or measurement methods.
Microwave remote sensing can be used to estimate vegetation optical depth (VOD), a measure of the attenuation of microwave radiation by vegetation. VOD is tightly linked to vegetation properties such as water content and above-ground biomass. Satellite-based VOD appears to be sensitive to tree hydraulics at larger scales, highlighting its potential to improve understanding of tree water status across the boreal biome. However, a detailed comparative analysis of boreal tree hydraulic functioning from microwave VOD is still lacking. This study explored empirical relationships between seven microwave VOD data products at three frequencies (L-, C- and X-bands) against in-situ tree hydraulic measurements. Additionally, we examined the correlations between VOD and above-ground biomass. Continuous measurements of relative dielectric constant, stem radius variations, and sap flux density across boreal forest stands were used to quantify tree hydraulic functioning across the Canadian boreal forest. Inter-comparisons between the different microwave VOD data products across forest stands and sensors revealed high spatiotemporal differences between all VOD data products for AM and PM orbit times. We observed higher VOD values in the Taiga Plains ecozone and lower values in the Boreal Plains and Boreal Shields ecozones, which may be attributed to differences in vegetation density across these regions. As expected, tight linear correlations were found between mean annual VOD values and above-ground biomass, with correlation coefficients exceeding 0.7 across all products and boreal forest stands. Analysis comparing microwave VOD products against in-situ tree hydraulic data demonstrated considerable differences across forest stands and years. Unexpected negative correlations (ranging from -0.02 and -0.8) were obtained between passive VOD and tree dielectric measurements. This relationship could be driven by soil moisture dynamics, which generally exhibited negative behaviors with VOD. Conversely, correlations were positive with the active VOD product, reaching approximately 0.9 in some cases. Our findings indicate strong interannual and spatial variability in the relationships between VOD and in situ tree hydraulic data and suggest that the VOD retrievals are limited in the boreal region. Further work should explore how to improve daily VOD retrievals in boreal forests. La t & eacute;l & eacute;d & eacute;tection micro-onde peut & ecirc;tre utilis & eacute;e pour estimer l'& eacute;paisseur optique de la v & eacute;g & eacute;tation (VOD), une mesure des effets d'att & eacute;nuation des radiations micro-ondes par le couvert v & eacute;g & eacute;tal. Le VOD est & eacute;troitement li & eacute; aux propri & eacute;t & eacute;s de la v & eacute;g & eacute;tation telles que le contenu en eau de v & eacute;g & eacute;tation et la biomasse. Provenant des observations satellitaires, le VOD semble sensible & agrave; l'hydraulique des arbres, soulignant son potentiel pour am & eacute;liorer la compr & eacute;hension de l'& eacute;tat hydrique des arbres dans le biome de la for & ecirc;t bor & eacute;ale. Cependant, une analyze comparative d & eacute;taill & eacute;e du fonctionnement hydraulique des arbres bor & eacute;aux & agrave; partir des VOD estim & eacute;s & agrave; partir des observation micro-ondes n'a jamais & eacute;t & eacute; fait. La pr & eacute;sente & eacute;tude explore les relations empiriques entre sept produits VOD issus de donn & eacute;es micro-ondes & agrave; trois fr & eacute;quences (bande L, C et X) et des mesures in situ d'hydrauliques des arbres. Nous avons exploit & eacute; des mesures continues de la constante di & eacute;lectrique relative, des variations du diam & egrave;tre du tronc et de la densit & eacute; de flux de s & egrave;ve, recueillies dans des peuplements forestiers bor & eacute;aux, afin de quantifier le fonctionnement hydraulique des arbres dans la for & ecirc;t bor & eacute;ale canadienne. Les inter-comparaisons entre les diff & eacute;rents produits de donn & eacute;es VOD, & agrave; travers les peuplements forestiers et les capteurs, ont r & eacute;v & eacute;l & eacute; d'importantes diff & eacute;rences spatio-temporelles entre l'ensemble des produits VOD pour les orbites du matin (AM) et du soir (PM). Nous avons observ & eacute; des valeurs de VOD plus & eacute;lev & eacute;es dans l'& eacute;cozone de la Ta & iuml;ga des plaines et des valeurs plus faibles dans celles des Plaines bor & eacute;ales et du Bouclier bor & eacute;al, ce qui pourrait s'expliquer par des diff & eacute;rences de densit & eacute; de v & eacute;g & eacute;tation dans ces r & eacute;gions. Comme pr & eacute;vu, des corr & eacute;lations lin & eacute;aires & eacute;troites ont & eacute;t & eacute; trouv & eacute;es entre les valeurs moyennes annuelles de VOD et la biomasse avec des coefficients de corr & eacute;lation sup & eacute;rieurs & agrave; 0,7 pour tous les produits et peuplements forestiers bor & eacute;aux. L'analyze comparant les produits micro-ondes de VOD aux donn & eacute;es in situ d'hydrauliques des arbres a montr & eacute; des diff & eacute;rences consid & eacute;rables selon les peuplements et les ann & eacute;es. Des corr & eacute;lations n & eacute;gatives inattendues (variant de -0,02 & agrave; -0,8) ont & eacute;t & eacute; obtenues entre les VOD issus des observations micro-ondes passives et les mesures di & eacute;lectriques des arbres. Cette relation pourrait & ecirc;tre influenc & eacute;e par la dynamique de l'humidit & eacute; du sol, qui a g & eacute;n & eacute;ralement montr & eacute; des comportements n & eacute;gatifs avec les VOD. En revanche, les corr & eacute;lations avec les produits VOD issus des donn & eacute;es actives & eacute;taient positives, atteignant environ 0,9 dans certains c Des travaux futurs devraient explorer comment am & eacute;liorer les estimations journali & egrave;res de VOD en for & ecirc;t bor & eacute;ale.
Repeatable methods capable of quantifying Arctic surface water extent at high resolutions are important, but still require development. Here, we present a study using very-high resolution (VHR) X-band Synthetic Aperture Radar (SAR) imagery from Capella Space for fine-scale semantic segmentation of Arctic surface water features. Our study proposes a modified U-Net encoder-decoder model for this task, optimized using the Nadam algorithm. Otsu thresholding was leveraged to rapidly generate 512 x 512-pixel patches for the U-Net, resulting in an efficient and automated training pipeline. Within this study, we also quantitatively compared the deep learning (DL) U-Net to a shallow machine learning (ML) algorithm, XGBoost (XGB), and evaluated the Capella Space imagery against spatially and temporally coincident Sentinel-1 C-band. Performance evaluations showed the U-Net outperforms XGB measured under several statistical metrics, reaching an Intersection over Union (IoU) of 0.955. An explainability analysis was conducted to complement this finding, using Gradient-weighted Class Activation Mapping (Grad-Cam). Visual analysis also underscored the extreme detail of small water features captured by Capella Space imagery, which are at times omitted or lack clarity in conventional Sentinel-1. This research makes several contributions to Arctic surface water mapping, demonstrating the effectiveness of combining VHR SAR imagery with DL. Le d & eacute;veloppement des m & eacute;thodes reproductibles permettant de quantifier l'& eacute;tendue des eaux de surface de l'Arctique & agrave; fine r & eacute;solution est important. Nous pr & eacute;sentons ici une & eacute;tude utilisant des images radar & agrave; synth & egrave;se d'ouverture (SAR) en bande X & agrave; tr & egrave;s haute r & eacute;solution spatiale (THR) de Capella Space pour la segmentation s & eacute;mantique & agrave; & eacute;chelle fine des caract & eacute;ristiques des eaux de surface de l'Arctique. Notre & eacute;tude propose un mod & egrave;le codeur-d & eacute;codeur U-Net modifi & eacute; pour cette t & acirc;che, optimis & eacute; par l'algorithme Nadam. Le seuillage Otsu a & eacute;t & eacute; utilis & eacute; pour g & eacute;n & eacute;rer des imagettes de 512 x 512 pixels pour le mod & egrave;le U-Net, ce qui a permis de cr & eacute;er un pipeline d'apprentissage efficace et automatis & eacute;. Dans le cadre de cette & eacute;tude, nous avons & eacute;galement compar & eacute; quantitativement l'algorithme d'apprentissage profond U-Net (DL: Deep Learning) & agrave; un algorithme d'apprentissage automatique (ML: Machine Learning), XGBoost (XGB). De plus, nous avons compar & eacute; les r & eacute;sultats obtenus & agrave; partir de l'imagerie Capella Space avec ceux obtenus & agrave; partir des images Sentinel-1 en bande C, pour des r & eacute;solutions spatiales et temporelles similaires. Les & eacute;valuations ont montr & eacute; que les r & eacute;sultats issus du model U-Net surpassent ceux du mod & egrave;le XGB pour plusieurs m & eacute;triques statistiques, atteignant une intersection sur l'union (IoU: Intersection over Union) de 0,955. Une analyse plus approfondie a & eacute;t & eacute; r & eacute;alis & eacute;e pour mieux interpr & eacute;ter ces r & eacute;sultats, & agrave; l'aide de la cartographie d'activation de classe pond & eacute;r & eacute;e par gradient (Grad-Cam: Gradient-weighted Class Activation Mapping). L'analyse visuelle a & eacute;galement mis en & eacute;vidence comment l'imagerie Capella Space peut faire ressortir des petites caract & eacute;ristiques aquatiques, qui sont parfois omises ou manquent de clart & eacute; avec l'usage des images de Sentinel-1. Cette recherche apporte plusieurs contributions & agrave; la cartographie des eaux de surface de l'Arctique, d & eacute;montrant l'efficacit & eacute; de la combinaison de l'imagerie SAR THR avec un mod & egrave;le DL.
In digital soil mapping (DSM), a fundamental assumption is that the spatial variability of the target variable can be explained by the predictors or environmental covariates. Strategies to adequately sample the predictors have been well documented, with the conditioned Latin hypercube sampling (cLHS) algorithm receiving the most attention in the DSM community. Despite advances in sampling design, a critical gap remains in determining the number of samples required for DSM projects. We propose a simple workflow and function coded in R language to determine the minimum sample size for the cLHS algorithm based on histograms of the predictor variables using the Freedman-Diaconis rule for determining optimal bin width. Data preprocessing was included to correct for multimodal and non -normally distributed data, as these can affect sample size determination from the histogram. Based on a user -selected quantile range (QR) for the sample plan, the densities of the histogram bins at the upper and lower bounds of the QR were used as a scaling factor to determine minimum sample size. This technique was applied to a field -scale set of environmental covariates for a well -sampled agricultural study site near Guelph, Ontario, Canada, and tested across a range of QRs. The results showed increasing minimum sample size with an increase in the QR selected. Minimum sample size increased from 44 to 83 when the QR increased from 50% to 95% and then increased exponentially to 194 for the 99% QR. This technique provides an estimate of minimum sample size that can be used as an input to the cLHS algorithm.
 Andreas Colliander合作论文数NASA Jet Propulsion Laboratory, California Institute of Technology70
 Michael H Cosh合作论文数Hydrology and Remote Sensing Laboratory, Beltsville Agricultural Research Center, Agricultural Research Service, U.S. Department of Agriculture68
 Tracy L. Rowlandson合作论文数Department of Agronomy;Iowa State University;of Science and Technology;Department of Agronomy, Iowa State University54
 Heather McNairn合作论文数43
 Jeffrey Walker合作论文数Department of Civil Engineering, Faculty of Engineering, Monash University42
 Todd G. Caldwell合作论文数USGS Nevada Water Science Center42
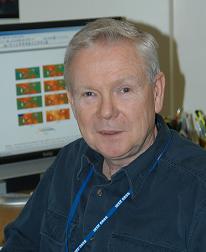 Thomas Jackson合作论文数Hydrology and Remote Sensing Laboratory, Beltsville Agricultural Research Center, Agricultural Research Service, United States Department of Agriculture40
 Simon Yueh合作论文数Jet Propulsion Laboratory, California Institute of Technology35
 Jose Martinez-Fernandez合作论文数Department of Geography, University of Salamanca34
 Dara Entekhabi合作论文数Department of Civil and Environmental Engineering, School of Engineering, Massachusetts Institute of Technology;Department of Earth, Atmospheric, & Planetary Sciences, School of Science, Massachusetts Institute of Technology33
 Rajat Bindlish合作论文数Hydrol & Remote Sensing Lab, USDA ARS33
 Patrick J. Starks合作论文数33
 David Bosch合作论文数College of Engineering, University of Georgia29
 Peggy O'Neill合作论文数Hydrological Sciences Laboratory, Goddard Space Flight Center, NASA;Jet Propulsion Laboratory, NASA29John Prueger合作论文数Soil, Water and Air Unit, National Laboratory for Agriculture and The Environment, U.S. Department of Agriculture26
 Ramata Magagi合作论文数Centre d’Applications et de Recherches en Télédétection—CARTEL, Université de Sherbrooke26Mark S. Seyfried (Mark Seyfried)合作论文数Northwest Watershed Research Center, United States Department of Agriculture-Agricultural Research Service25
 Alexandre Roy合作论文数UMR1019, INRA25
 Zhongbo Su (Bob)合作论文数Department of Water Resources, Faculty of Geo-Information and Earth Observation, University of Twente/ITC Netherlands22
 Jun Asanuma合作论文数Graduate School of Life and Environmental Sciences, University of Tsukuba22H McNairn合作论文数21M. Thibeault合作论文数20
 Justin R. Adams合作论文数19
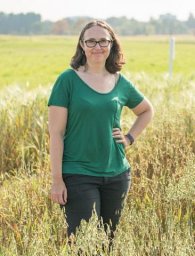 Catherine Champagne合作论文数Department of Geography, University of Guelph19
 Ernesto Lopez-Baeza合作论文数Department of Earth Physics & Thermodynamics, Faculty of Physics, University of Valencia19Brenda Toth合作论文数18Jaison Thomas Ambadan合作论文数17
 Wade Crow合作论文数USDA-ARS Hydrology and Remote Sensing Laboratory17
 Mahta Moghaddam合作论文数Microwave Systems, Sensors, and Imaging Lab, Ming Hsieh Department of Electrical Engineering, University of Southern California17
 Jay Famiglietti合作论文数School of Sustainability, Arizona State University;Global Futures Laboratory, Arizona State University;Global Institute for Water Security, School of Environment and Sustainability, University of Saskatchewan16
 Chris Derksen合作论文数Climate Research Division, Environment and Climate Change Canada16
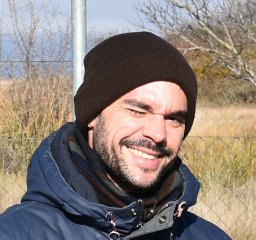 Angel Gonzalez-Zamora合作论文数Inst Hispano Luso Invest Agr CIALE, Univ Salamanca15Erica Tetlock合作论文数14Jarrett Powers合作论文数14
 R. Scott Dunbar合作论文数14
 Chandra Holifield Collins合作论文数Southwest Watershed Research Center, U.S. Department of Agriculture14
 Oscar van der Velde合作论文数Departament d'Enginyeria Elèctrica, Polytechnic University of Catalonia14
 Yann Kerr合作论文数Center for Hydrology - Hydrological Observatory, HOBE;CESBIO, CNES, CNRS, IRD, INRAE14
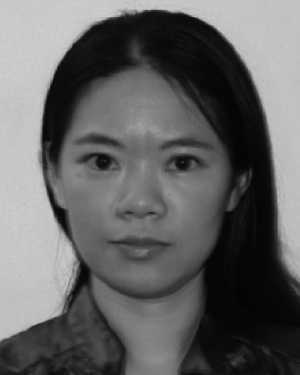 Fan Chen合作论文数13
 Peter Toose合作论文数Climate Research Division, Environment Canada13
 Paul R. Bullock合作论文数13
 Simon Zwieback合作论文数13S. Chan合作论文数12
 Renato Pardo Lara合作论文数Dept Geog Environm & Geomat, Univ Guelph12
 Eni G. Njoku合作论文数Jet Propulsion Laboratory12
 Anna Pacheco合作论文数12
 Alain Royer合作论文数Centre d’Applications et de Recherches en Télédétection (CARTEL),, Université de Sherbrooke12
 William Quinton合作论文数Cold Regions Research Centre;Wilfrid Laurier University;Cold Regions Research Centre, Wilfrid Laurier University12
 Xiaoling Wu合作论文数Department of Civil Engineering, Faculty of Engineering, Monash University11




