Rising atmospheric and ocean temperatures have caused substantial changes in terrestrial water circulation and land surface water fluxes, such as precipitation and evapotranspiration, potentially leading to abrupt shifts in terrestrial water storage. The European Centre for Medium-Range Weather Forecasts (ECMWF) Reanalysis v5 (ERA5) soil moisture (SM) product reveals a sharp depletion during the early 21st century. During the period 2000 to 2002, soil moisture declined by approximately 1614 gigatonnes, much larger than Greenland’s ice loss of about 900 gigatonnes (2002–2006). From 2003 to 2016, SM depletion continued, with an additional 1009-gigatonne loss. This depletion is supported by two independent observations of global mean sea level rise (~4.4 millimeters) and Earth’s pole shift (~45 centimeters). Precipitation deficits and stable evapotranspiration likely caused this decline, and SM has not recovered as of 2021, with future recovery unlikely under present climate conditions.
This dataset provides high-resolution (60 m) global irrigation maps to support water resource and agricultural management. It identifies the likely irrigation status (rainfed or irrigated) and water source (groundwater or surface water) of croplands for 2000, 2005, 2010, and 2015. We downscaled a 10-km irrigation dataset derived from national and subnational statistics (GMIA) using (i) spatial patterns between high-resolution (30 m) cropland and nearby surface water, and (ii) irrigation water requirements from a global crop model. Validation used household agriculture surveys in India (N = 8,355) and a U.S. well database (N = 1,505,371). In the U.S., our method achieved 85% accuracy in distinguishing groundwater use within 2 km of wells – substantially higher than GMIA (25%). In India’s groundwater-dominated regions, our estimates performed comparably to GMIA (73% vs. 72%). These results suggest our dataset offers a more accurate and spatially detailed representation of irrigation water sources, enabling improved analysis of agricultural water use.
This study demonstrates the critical role of precipitation intensity in groundwater recharge generation and terrestrial water storage (TWS) change. We conducted two experiments driven by precipitation products with close annual totals but distinct intensity in Arizona, using the Noah‐MP model with advanced soil hydrology. The experiment with higher precipitation intensity (EXP HI ) produces an annual groundwater recharge of 6.91 mm/year in Arizona during 2001–2020, ∼15 times that of the experiment with lower precipitation intensity (EXP LI ). Correspondingly, EXP LI produces a declining groundwater storage (GWS) trend of 0.51 mm/month, nearly triple that of EXP HI . GWS change dominates the TWS trend. EXP LI shows a declining TWS trend of 0.57 mm/month, nearly twice that of EXP HI . Higher precipitation intensity reduces evapotranspiration and enhances infiltration and percolation, allowing more precipitation to recharge groundwater. This study underscores the need to ensure the accuracy of precipitation intensity in hydrological modeling for reliable water resources assessment and projection.
The Colorado River Basin (CRB) is experiencing persistent aridification due to a complex interplay of natural and anthropogenic activities, resulting in significant groundwater depletion across the region. We used over two decades of NASA GRACE and GRACE Follow‐On (GRACE‐FO) observations (April 2002–October 2024), land surface models and observed data, to document pronounced groundwater depletion in the CRB. We estimate that the CRB lost 52.2 ± 4.0 km 3 of terrestrial water storage over the study period, of which groundwater accounted for 65% (34.3 ± 9.2 km 3 ). Of this, the Upper Basin lost 14.6 ± 3.5 km 3 of terrestrial water storage (53% from groundwater, 7.8 ± 5.3 km 3 ) while the Lower Basin lost 36.0 ± 6.2 km 3 of terrestrial water storage (71% from groundwater, 25.5 ± 7.4 km 3 ). Progress toward groundwater sustainability could be achieved by reducing annual extraction in line with the annual depletion rates presented here (0.35 km 3 /yr in Upper Basin and 1.15 km 3 /yr in the Lower Basin).
Changes in terrestrial water storage (TWS) are a critical indicator of freshwater availability. We use NASA GRACE/GRACE-FO data to show that the continents have undergone unprecedented TWS loss since 2002. Areas experiencing drying increased by twice the size of California annually, creating "mega-drying" regions across the Northern Hemisphere. While most of the world's dry/wet areas continue to get drier/wetter, dry areas are now drying faster than wet areas are wetting. Changes in TWS are driven by high-latitude water losses, intense Central American/European droughts, and groundwater depletion, which accounts for 68% of TWS loss over non-glaciated continental regions. "Continental drying" is having profound global impacts. Since 2002, 75% of the population lives in 101 countries that have been losing freshwater water. Furthermore, the continents now contribute more freshwater to sea level rise than the ice sheets, and drying regions now contribute more than land glaciers and ice caps. Urgent action is required to prepare for the major impacts of results presented.
The Earth's rivers vary in size across several orders of magnitude. Yet, the relative significance of small upstream reaches compared to large downstream rivers in the global water cycle remains unclear, challenging the determination of adequate spatial resolution for observations. Here, we use monthly simulations of river stores and fluxes to investigate the intrinsic spatial scales of the global river water cycle. We frame these scale-dependent river dynamics in terms of observational capabilities, assessing how the size of rivers that can be resolved influences our ability to capture key global hydrologic stores and fluxes. By filtering reaches by estimated river widths, we quantify the relative contribution of global river reaches by size and estimate that over 17% of global discharge to ocean and nearly 9% of the world's river storage lies within rivers smaller than 100 m-hence revealing both strengths and limitations of current observational capabilities.
Terrestrial evaporation (ET) estimates from the water balance framework and large-scale modeling have been widely used in the evaluation and prediction of hydrological regimes. However, each method has its inherent limitations, including the external bias introduced by forcing variables, simplified functional relationships, and unconsidered human modules. A systematic comparison between water balance ET and modeled ET remains unexplored. Here, we quantify and attribute the difference between water balance estimations of ET and modelsimulated ET (i.e., DET) on a global scale. We apply an unprecedentedly unique probabilistic ensemble of 84,042 DET estimates (2002-2021) based on all currently available datasets on water balance components. Satisfactory performance is found from the validation of the water balance-derived ET against several benchmarking ET products. We identify the regions with significantly positive DET in South and East Asia, Southern and Northern Africa, and southwestern parts of North America, with a global mean of 7 mm/a (5 % spread range: -2 to 16 mm/ a). The patterns are primarily contributed by human water use and reservoir construction. We also report negative DET in the majority of South America, which may be related to human-induced deforestation. In addition, the seasonality of DET reflects the significant role of irrigation in regional ET dynamics. Variance analysis indicates higher uncertainties of DET in humid zones, mainly contributed by precipitation and simulated ET. Our uncertainty-constrained DET estimates have potential implications for assessing global and regional water availability, benchmarking climate and hydrological models, and developing sustainable mitigation and adaptation strategies.
The global terrestrial water storage (TWS), the most accessible component in the hydrological cycle, is a general indicator of freshwater availability on Earth. The global TWS trend caused by climate change is harder to detect than global mean temperature due to the highly uneven hydrological responses across the globe, the brevity of global freshwater observations, and large noises of internal climate variability. To overcome the climate noise and small sample size of observations, we leverage the vast amount of observed and simulated meteorological fields at daily scales to project global TWS through its fingerprints in weather patterns. The novel method identifies the relationship between annual global mean TWS and daily surface air temperature and humidity fields using multi-model hydrological simulations. We found that globally, approximately 50% of days for most years since 2016 have climate change signals emerged above the noise of internal variability. Climate change signals in global mean TWS have been consistently increasing over the last few decades, and in the future, are expected to emerge from the natural climate variability. Our research indicates the urgency to limit carbon emission to not only avoid risks associated with warming but also sustain water security in the future.
Human actions compromise the many life-supporting functions provided by the freshwater cycle. Yet, scientific understanding of anthropogenic freshwater change and its long-term evolution is limited. Here, using a multi-model ensemble of global hydrological models, we estimate how, over a 145-year industrial period (1861–2005), streamflow and soil moisture have deviated from pre-industrial baseline conditions (defined by 5th–95th percentiles, at 0.5° grid level and monthly timestep over 1661–1860). Comparing the two periods, we find an increased frequency of local deviations on ~45% of land area, mainly in regions under heavy direct or indirect human pressures. To estimate humanity’s aggregate impact on these two important elements of the freshwater cycle, we present the evolution of deviation occurrence at regional to global scales. Annually, local streamflow and soil moisture deviations now occur on 18.2% and 15.8% of global land area, respectively, which is 8.0 and 4.7 percentage points beyond the ~3 percentage point wide pre-industrial variability envelope. Our results signify a substantial shift from pre-industrial streamflow and soil moisture reference conditions to persistently increasing change. This indicates a transgression of the new planetary boundary for freshwater change, which is defined and quantified using our approach, calling for urgent actions to reduce human disturbance of the freshwater cycle.
Groundwater is the most ubiquitous source of liquid freshwater globally, yet its role in supporting diverse ecosystems is rarely acknowledged1,2. However, the location and extent of groundwater-dependent ecosystems (GDEs) are unknown in many geographies, and protection measures are lacking1,3. Here, we map GDEs at high-resolution (roughly 30 m) and find them present on more than one-third of global drylands analysed, including important global biodiversity hotspots4. GDEs are more extensive and contiguous in landscapes dominated by pastoralism with lower rates of groundwater depletion, suggesting that many GDEs are likely to have already been lost due to water and land use practices. Nevertheless, 53% of GDEs exist within regions showing declining groundwater trends, which highlights the urgent need to protect GDEs from the threat of groundwater depletion. However, we found that only 21% of GDEs exist on protected lands or in jurisdictions with sustainable groundwater management policies, invoking a call to action to protect these vital ecosystems. Furthermore, we examine the linkage of GDEs with cultural and socio-economic factors in the Greater Sahel region, where GDEs play an essential role in supporting biodiversity and rural livelihoods, to explore other means for protection of GDEs in politically unstable regions. Our GDE map provides critical information for prioritizing and developing policies and protection mechanisms across various local, regional or international scales to safeguard these important ecosystems and the societies dependent on them. Mapping of groundwater-dependent ecosystems, which support biodiversity and rural livelihoods, shows they occur on more than one-third of global drylands analysed, but lack protections to safeguard these critical ecosystems and the societies dependent upon them from groundwater depletion.
To compensate for the intrinsic coarse spatial resolution of groundwater storage (GWS) anomalies (GWSA) from the Gravity Recovery and Climate Experiment (GRACE) satellites and make better use of current dense in situ groundwater-level data in some regions, a new statistical downscaling method was proposed to derive high-resolution GRACE GWS changes. A ground-based scaling factor (SFGB) method was proposed to downscale GRACE GWS changes that were corrected using gridded scaling factors estimated from ground-based GWS changes through forward modeling. The proposed method was applied in the North China Plain (NCP), where many observation wells and consistently measured specific yield are available. Importantly, the sensitivity of the proposed method was explored considering the uncertainties of in situ GWS changes due to variable specific yield and/or number of observation wells. Independent validation shows that SFGB can effectively recover GRACE GWSA at the 0.5º grid scale (r = 0.81, root mean square error = 40.51 mm/yr). The SFGB-corrected GWSA in the NCP was -32.60{plus minus}0.99 mm/yr (-4.6{plus minus}0.14 km3/yr) during 2004-2015, showing contrasting GWS trends in the piedmont west (loss) and the coastal east (gains). Uncertainties in SFGB-corrected GWSA arising from specific yield, groundwater-level, and both can be reduced by 90%, 65%, and 84%, respectively relative to ground-based GWSA. This study highlights the potential value of jointly using GRACE and in situ observation data to improve the accuracy of GRACE-derived GWSA at smaller scales. The new downscaling method and the improved groundwater storage change estimates would facilitate better groundwater management.
Groundwater is a dynamic component of the global water cycle with important social, economic, ecological, and Earth system functions. We present a new global classification and mapping of groundwater systems, which we call groundwaterscapes, that represent predominant configurations of large-scale groundwater system functions. We identify 18 groundwaterscapes, which offer a new lens to conceptualize, study, model, and manage groundwater. Groundwaterscapes are empirically derived using a novel application of sequenced self-organizing maps and capture grid cell level (5 arcminute) patterns in groundwater system functions, such as groundwater-dependent ecosystem type and density, storage capacity, irrigation, and integrated groundwater management. All large aquifer systems of the world are characterized by multiple groundwaterscapes, highlighting the pitfalls of treating these groundwater bodies as lumped systems in global assessments. We evaluate the distribution of Global Groundwater Monitoring Network wells across groundwaterscapes and find that industrial agricultural regions with strong groundwater management are disproportionately monitored, while several groundwaterscapes have next to no monitoring wells at all. This disparity undermines the ability to understand system dynamics across the full range of settings in which groundwater is found. We argue groundwaterscapes offer a conceptual and spatial tool to guide model development, hypothesis testing, and future data collection initiatives to better understand groundwater’s embeddedness within social-ecological systems at the global scale.
AbstractThe following tutorial details how to use observations from the Gravity Recovery and Climate Experiment (GRACE) to evaluate changes in groundwater storage for a large river basin. Here, you will learn how to apply remote sensing estimates of total water storage anomalies, land surface model output, and in situ observations to resolve groundwater storage changes in California’s Central Valley.
Groundwater resources are connected with social, economic, ecological, and Earth systems. We introduce the framing of groundwater-connected systems to better represent the nature and complexity of these connections in data collection, scientific investigations, governance and management approaches, and groundwater education. Groundwater-connected systems are social, economic, ecological, or Earth systems that interact with groundwater, such as irrigated agriculture, groundwater-dependent ecosystems, and cultural relationships to groundwater expressions such as springs and rivers. Groundwater-connected systems form social-ecological systems with complex behaviours such as feedbacks, non-linear processes, multiple stable system states, and path dependency. These complex behaviours are only visible through this integrated system framing and are not endogenous properties of physical groundwater systems. The framing is syncretic as it aims to provide a common conceptual foundation for the growing disciplines of socio-hydrogeology, eco-hydrogeology, groundwater governance, and hydro-social groundwater analysis. The framing also facilitates greater alignment between the groundwater sustainability discourse and emerging sustainability concepts and principles. Aligning with these concepts and principles presents groundwater sustainability as more than a physical state to be reached that additionally must integrate place-based and multi-faceted goals, values, justice, knowledge systems, governance and management to maintain groundwater’s social, ecological, and Earth system functions. The groundwater-connected system framing can underpin a broad, methodologically pluralistic, and community-driven new wave of data collection and analysis, research, governance, management, and education. These developments, together, can invigorate efforts to foster sustainable groundwater futures in the complex systems groundwater is embedded within.
Water is a critical resource, but ensuring its availability faces challenges from climate extremes and human intervention. In this Review, we evaluate the current and historical evolution of water resources, considering surface water and groundwater as a single, interconnected resource. Total water storage trends have varied across regions over the past century. Satellite data from the Gravity Recovery and Climate Experiment (GRACE) show declining, stable and rising trends in total water storage over the past two decades in various regions globally. Groundwater monitoring provides longer-term context over the past century, showing rising water storage in northwest India, central Pakistan and the northwest United States, and declining water storage in the US High Plains and Central Valley. Climate variability causes some changes in water storage, but human intervention, particularly irrigation, is a major driver. Water-resource resilience can be increased by diversifying management strategies. These approaches include green solutions, such as forest and wetland preservation, and grey solutions, such as increasing supplies (desalination, wastewater reuse), enhancing storage in surface reservoirs and depleted aquifers, and transporting water. A diverse portfolio of these solutions, in tandem with managing groundwater and surface water as a single resource, can address human and ecosystem needs while building a resilient water system. Water resources are threatened by human activities and climate variability. This Review discusses trends in water storage and availability and examines ways to enhance water-resource resilience through green and grey solutions.
The prevailing approaches for ET retrievals are either limited in spatiotemporal coverage or largely influenced by choice of input data or simplified model physics, or a combination thereof. Here, using an independent mass conservation approach, we develop water balance-based ET datasets (ET-WB) for the global land and the selected 168 major river basins. We generate 4669 probabilistic unique combinations of the ET-WB leveraging multi-source datasets (23 precipitation, 29 runoff, and 7 storage change datasets) from satellite products, in-situ measurements, reanalysis, and hydrological simulations. We compare our results with the four auxiliary global ET datasets and previous regional studies, followed by a rigorous discussion of the uncertainties, their possible sources, and potential ways to constrain them. The seasonal cycle of global ET-WB possesses a unimodal distribution with the highest (median value: 65.61 mm/month) and lowest (median value: 36.11 mm/month) values in July and January, respectively, with the spread range of roughly +/-10 mm/month from different subsets of the ensemble. Auxiliary ET products illustrate similar intra-annual characteristics with some over/under-estimation, which are completely within the range of the ET-WB ensemble. We found a gradual increase in global ET-WB from 2003 to 2010 and a subsequent decrease during 2010-2015, followed by a sharper reduction in the remaining years primarily attributed to the varying precipitation. Multiple statistical metrics show reasonably good accuracy of monthly ET-WB (e.g., a relative bias of +/-20%) in most river basins, which ameliorates at annual scales. The long-term mean annual ET-WB varies within 500-600 mm/yr and is consistent with the for auxiliary ET products (543-569 mm/yr). Observed trend estimates, though regionally divergent, are evidence of the increasing ET in a warming climate.
Managing groundwater is challenging because its below-ground existence makes the resource difficult to monitor. GRACE is an important tool as it provides the opportunity to monitor the storage of groundwater. While GRACE-based groundwater studies have focused on many regions across the globe, studies that link scientific research to policymaking and groundwater practices are still limited. This paper aims to provide recommendations for the improved use of GRACE data for the purpose of sustainable groundwater management. To gain insight into this, a policy Delphi survey was conducted to collect opinions from both the academic and nonacademic communities. Although opinions are divergent and a mismatch exists between what science (researchers) currently supplies and what users (practitioners) demand, we found that both communities acknowledged the potential of GRACE data and GRACE-derived products for groundwater management and would be willing to collaborate to develop projects for practical applications. Better communication between researchers and practitioners was recommended as key for greater application of GRACE-derived products into practice. Practitioners noted the need for reliable data for management responsibilities but prefer locally observed data. The reliability of GRACE at local scales was raised by practitioners as a limitation despite advances in downscaling methods within the academic community. The survey reveals a shared desire for more comparison between GRACE-derived products with local measurements to determine whether GRACE products can be useful for informing local decisions. Using survey outcomes, we propose three recommendations to improve the usefulness of GRACE-derived and other remote sensing products for groundwater management and practices: improving communication strategies; increasing data accuracy, transparency and accessibility to build trust; and conducting solution-oriented research.
Environmental change is growingly reported as an important driver of human migration. Among all environmental variables, water crises are the most critical factors. To date, patterns of interconnections between changes in water and migration are not yet clearly understood. Here, we explore these patterns through a systematic review that combined a quantitative text-mining approach with qualitative thematic analysis. Our results generally concur with those of previous studies, which found that water-driven migration usually occurs internally and that the population in low- and middle-income countries and in dry regions are the most vulnerable and more likely to migrate or be displaced in the face of water-related events. However, our causal network analysis highlights that water is not the only reason for migration: Its related problems could be major triggers driving people-at-risk to leave their original place. Based on observed evidence, water-driven migration can be generally divided into four patterns: variability in water quantity, damaging water hazards and extremes, physical disturbances to water systems, and water pollution. These patterns are not independent but interconnected through multifaceted factors affecting people's livelihoods and their decisions to migrate. Understanding water-migration dynamics requires systematic thinking of the interconnections between changes in water and in migration patterns, the investigation of interactions between fast and slow water variables and their dynamic link to other socioeconomic variables, an integrated water-migration database to help identify early-warning signals of damaging water hazards that may result in undesirable migration, and targeted water policies that focus on building the resilience of vulnerable regions and population to climate change.This article is categorized under:Human Water > Value of Water
<p>Due to the lack of accurate representation of hydrological processes and parameter measurements, physically-based hydrological models consist of many parameters requiring calibration to historical observations so that reliable hydrological inference can be obtained. With the increasing data availability from various sources (e.g., satellite remote sensing, climate model reanalysis), additional information on different water balance components (e.g., soil moisture, groundwater storage, etc.) are used to constrain and validate hydrological models, resulting in better model performance and parameter identifiability. However, given the emergence of multiple datasets for various water budget components, and their differences in temporal and spatial resolutions, the uncertainties in these datasets, when used together in driving and evaluating hydrological models, could introduce potential inconsistencies in water balance estimation and lead to a non-closure problem, which could result in potentially biased parameter and water balance component estimates in hydrological modelling.</p> <p>This study addresses this issue by examining the impact of inconsistent water balance component data on model performance and exploring the importance of hydrologically consistent data for robust hydrological inference. The assessment is done using a Canadian Hydrologic-Land Surface Models named MESH in the Saskatchewan River basin, Canada over the period of 2002 to 2016. Seven precipitation datasets, seven evapotranspiration products, one source of water storage data &#8211; GRACE from three different centers using spherical harmonic and mass concentration approaches &#8211; and observed discharge data from hydrometric stations are selected as the input and evaluation data. A reference water balance dataset is developed to optimally combine all available data sources for each water balance component and to obtain water balance closure though a constrained Kalman filter data assimilation technique. The MESH model is rerun with this reference dataset and results are assessed and compared to different combinations of input and evaluation data. Preliminary results reveal great variations of model performance in the water balance components when using different combinations of input and evaluation data and results of using the reference dataset is expected to have less biased water balance component estimates. This study aims to highlight the necessity of using a set of hydrologically consistent data before any model runs and model evaluation.</p>
 Matthew Rodell合作论文数NASA Goddard Space Flight Center119
 JT Reager合作论文数Jet Propulsion Laboratory, California Institute of Technology;Joint Institute for Regional Earth System Sciences, University of California, Los Angeles76
 Sean Swenson合作论文数Climate & Global Dynamics Lab, National Center for Atmospheric Research34
 Min-Hui Lo合作论文数33
 Tajdarul Hassan Syed合作论文数Department of Applied Geology, Indian School of Mines32
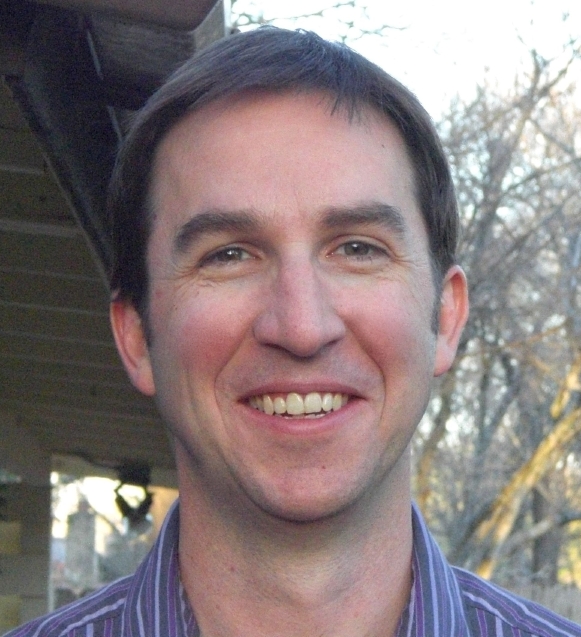 Don P. Chambers合作论文数College of Marine Science, University of South Florida29
 Clark R. Wilson合作论文数25
 Eric Wood合作论文数Department of Civil and Environmental Engineering, Princeton University21
 Pat J.-F. Yeh合作论文数Ralph M. Parsons Laboratory;Department of Civil and Environmental Engineering;Massachusetts Institute of Technology;Ralph M. Parsons Laboratory, Massachusetts Institute of Technology19
 Brian F Thomas合作论文数UC Center for Hydrologic Modeling, University of California Irvine;Department of Earth System Science, University of California Irvine;NASA Jet Propulsion Laboratory, California Institute of Technology Pasadena;University of California Irvine, University of California Irvine18
 Yoshihide Wada合作论文数Climate and Livability Initiative, King Abdullah University of Science and Technology;Department of Physical Geography, Universiteit Utrecht;International Institute for Applied Systems Analysis18
 David Wiese合作论文数NASA Jet Propulsion Laboratory18
 John Matthew Wahr合作论文数Department of Physics, College of Arts and Sciences, University of Colorado Boulder18
 Isabella Velicogna合作论文数Department of Earth System Science, School of Physical Sciences, University of California, Irvine;Cooperative Institute for Research in Environmental Science (CIRES), University of Colorado;Dipartimento Politecnico di Ingegneria e Architettura, Università degli Studi di Udine17
 Aaron Berg合作论文数Department of Geography, Environment & Geomatics, College of Social and Applied Human Sciences, University of Guelph;Hydrology and Remote Sensing Lab, University of Guelph16
 Cédric H. David合作论文数16
 R Steven Nerem合作论文数Ann and H.J. Smead Aerospace Engineering Sciences, College of Engineering & Applied Science, University of Colorado Boulder;Colorado Center for Astrodynamics Research, University of Colorado Boulder15
 Dongryeol Ryu合作论文数Department of Infrastructure Engineering, School of Electrical, Mechanical and Infrastructure Engineering, Faculty of Engineering and Information Technology, The University of Melbourne14
 Paul R. Houser合作论文数NASA Goddard Space Flight Center14
 Tom Gleeson合作论文数Department of Civil Engineering, Faculty of Engineering and Computer Science, University of Victoria13C. de Linage合作论文数12mingling lo合作论文数11
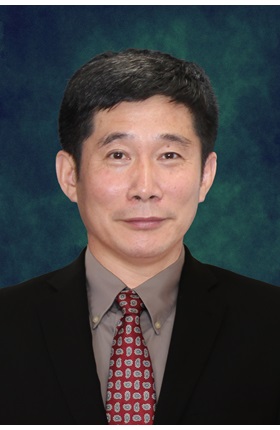 Jianli Chen (陈剑利)合作论文数Department of Land Surveying and Geo-Informatics, Faculty of Construction and Environment, The Hong Kong Polytechnic University11
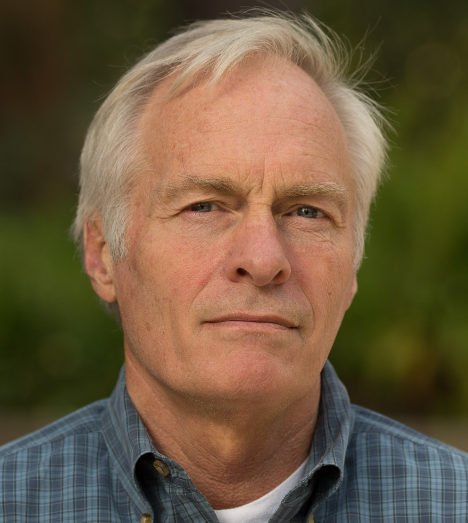 Dennis Lettenmaier合作论文数Department of Geography, Division of Social Sciences, College of Letters and Science, University of California, Los Angeles11Gopi Goteti合作论文数Princeton University11Caroline De Linage合作论文数11
 Kyle A. Hilburn合作论文数Center for Ocean-Atmospheric Prediction Studies;Florida State University;Center for Ocean-Atmospheric Prediction Studies, Florida State University11
 Adam J. Purdy合作论文数Department of Earth System Science, University of California10
 Hrishikesh Chandanpurkar合作论文数Univ Saskatchewan10
 Felix Landerer合作论文数Jet Propulsion Laboratory, California Institute of Technology10
 Kwabena Asante合作论文数Raytheon-EROS Data Center;U. S. Geological Survey;Raytheon-EROS Data Center, U. S. Geological Survey10
 Bailing Li合作论文数University of Maryland;NASA Goddard Space Flight Center10
 Bridget R. Scanlon合作论文数Bureau of Economic Geology, Jackson School of Geosciences, The University of Texas at Austin10Hiroko Kato Beaudoing合作论文数9
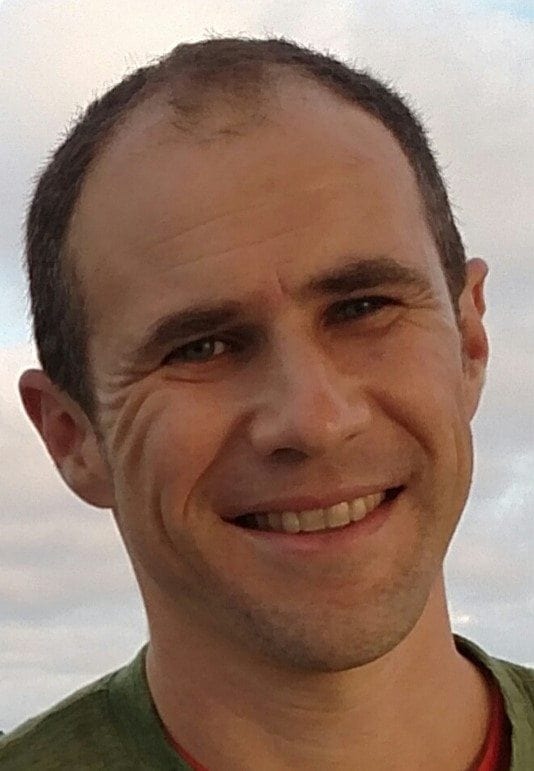 Benjamin Zaitchik合作论文数Morton K. Blaustein Department of Earth & Planetary Sciences, Krieger School of Arts & Sciences, Johns Hopkins University9Shane C. Burgess合作论文数8
 Frederic Frappart合作论文数8johnny chen合作论文数8Rajiv Khosla合作论文数8David B. Allison (Nam)合作论文数8
 Xander Huggins合作论文数International Institute for Applied Systems Analysis8
 James W. Jones合作论文数Department of Agricultural and Biological Engineering, University of Florida8
 Corrie Brown合作论文数Department of Pathology, College of Veterinary Medicine, University of Georgia;African Studies Institute, Franklin College of Arts and Sciences, University of Georgia;Lifestock International8
 Janet Jansson合作论文数Biology in the Biological Sciences Division, Pacific Northwest National Laboratory;Oath Inc.8Helen H. Jensen合作论文数Iowa State University8
 Jim E. Riviere合作论文数Institute of Computational Comparative Medicine, Kansas State University;North Carolina State University8
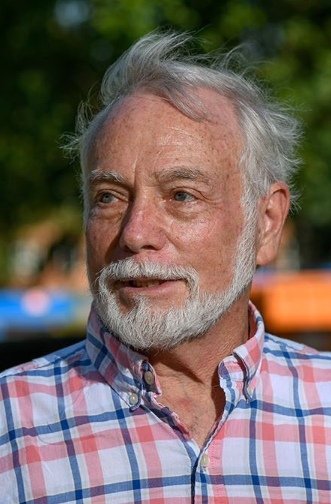 Fred Gould合作论文数Department of Entomology and Plant Pathology, College of Agriculture and Life Science, North Carolina State University;Genetic Engineering and Society Center, North Carolina State University8
 Jill McCluskey合作论文数College of Agricultural, Human, and Natural Resource Sciences, Washington State University8
 Lisa Goddard合作论文数Institute for Climate and Society8




