Mapping of magnetic anomalies in volcanic areas is a valuable tool to better understand lava flow geometries and dynamics. The high magnetization of basaltic lava allows us to easily identify buried lava flows, providing constraints on the total volume of old erupted material and the flow geometry, while magnetic mapping of volcanic intrusions in country rock enables us to model feeder dike geometry. The low magnetic signals within recent lava flows can identify areas that are still above the Curie temperature, constraining the dynamic of recent flow, and negative anomalies above old empty lava tubes can allow us to identify these hidden conduits. Traditionally, magnetic anomaly mapping for small regions is performed by walking through the survey area and for larger regions using crewed aircraft. Walking is often daunting, labor-intensive, and potentially dangerous. On the other hand, crewed aircraft are normally expensive and require a significant logistical organization before the survey. Uncrewed aerial vehicles (UAVs) have the potential to bridge the gap and collect a significant amount of high-resolution data in a relatively short time, possibly in areas not easily accessible. UAVs also provide the opportunity to collect data at multiple altitudes, providing a full gradient of the measured field. Here we present the results from both old and recent lava flows. Little Cones in Nevada (USA) consists of two visible cones erupted ~0.8Ma in the vicinity of the proposed nuclear repository of Yucca Mountain, Nevada. The lava flows from the two cones are partially buried by alluvium and not visible above ground. Our UAV data collection and data inversion allowed us to map the full extent of the lava flow and estimate the total volume of effused material. Our surveys of Hell’s Half Acre (~3000 BCE) lava flow, and Kings’ Bowl (~300 BCE) flow in Idaho (USA) are examples of the use of magnetic anomalies to identify lava tubes, feeding dikes, and flow morphology. Our 2022 survey of the 2018 Pacaya (Guatemala) lava flow is an example of a hard-to-access flow in which we can identify the warmer core that has not yet cooled below the Curie temperature. A survey of the 2018 Lower East Rift Zone eruption of Kīlauea in Hawaiʻi (USA) conducted in 2022 is another example of a negative anomaly possibly associated with areas that are still hot, or lava tubes. In all the surveys we collected a few hundred line kms of data in a few days using two 200 Hz triaxial fluxgate magnetometers mounted on a medium-lift drone. UAV magnetic surveys in volcanic regions are a powerful tool for understanding old and recent volcanic processes.
Improvements in miniaturization and affordability of lidar technology, mainly due to innovation in self-driving cars, means that UAV lidar is now an accessible option for geoscience research. We present applications in which UAV lidar contributes to data collection in ways that would otherwise not be possible in the time frame, budget, and/or with the resolution required. Volcanoes: Lava flow surface texture can provide information on lava flow dynamics and emplacement. The transition between pahoehoe and a’a flow textures can indicate changes in flow rates and flow thickness, and the morphology of ripples in ropey pahoehoe flows can indicate flow direction. Hell’s Half Acre, Idaho, USA, is a basaltic lava flow that was erupted ~5000 y.a. Analysis of UAV lidar data at this lava field shows lava flow surface texture in sufficient resolution to define cm-scale pahoehoe ripples. In addition, larger scale lava features such as channels and inflation/deflation ridges can be mapped which allows us to understand the dynamics of the lava flow emplacement. Vegetation: UAV Lidar can be useful for analysis of vegetation canopy, both in stripping canopy (lidar last return) and in using it for tree height (lidar first return). By combining UAV lidar with other airborne data, e.g. multispectral imaging, we can identify and map tree species at Ft de Soto Park, in Florida, USA. Permafrost: Permafrost thermokarst features can develop rapidly and climate change will cause an increase in these rapid thaw events. With UAV lidar we can strip the vegetation to reveal the underlying ground surface which can then be used to assess and model permafrost processes. UAV surveys are quick and relatively inexpensive (as compared to crewed aviation) and data can be collected in response to a thaw event. We present data from Alaska, USA, at known sites of rapid thermokarst thaw. UAV lidar, both as a stand-alone dataset, and when integrated with other data streams e.g. multispectral and visible imagery, can provide high-resolution data (both spatial and temporal) on a platform that is relatively low-cost and logistically straightforward to deploy.
Eruption source parameters (ESPs) used to characterize explosive eruptions are estimated from tephra deposit data using different models (statistical or numerical) and inversion approaches. The ESPs thus derived are subject to substantial uncertainties when the bulk of the tephra deposit, including information about its full spatial extent and spatial variation in grain-size distribution is missing due to geographical and environmental conditions. We use an advection-diffusion model coupled with a Bayesian inversion and uncertainty quantification algorithm to investigate how ESPs can be robustly estimated given such conditions. The 2021 eruption of La Soufriere volcano (St Vincent and the Grenadines) is our case study. An inversion is conducted for the first two explosive phases of this eruption (U1 and U2). We estimate: an erupted mass of 3.3 x 10(10) +/- 1 x 10(10) kg for U1 and 3.1 x 10(10) +/- 1.9 x 10(9) kg for U2, with an average particles release height of c. 13.5 km a.s.l.+/- 0.5 km for both phases. Given the efficiency of the proposed approach and the plausibility of the stochastic inversion results, we recommend this procedure for estimating ESPs for explosive eruptions for which the bulk of the deposit is missing or is inaccessible.
The Aso-4 explosive eruption on Kyushu, Japan, 89,500 years ago was one of the biggest eruptions in the last one hundred millennia, with a magnitude of approximately M8. Modern society requires the likelihood of natural events with potentially disastrous consequences to be evaluated, even if probabilities of occurrence are diminishingly small. For some situations, it is not satisfactory to assert an event scenario probability is “negligible” or can be “ignored”. Judicial hearings or litigation may require risk levels to be quantified, in which case, statements of scientific confidence could be decisive. Internationally, e.g., for nuclear site safety evaluations, event likelihoods on order of 10–7/year are often considered for quantitative assessment. At such hazard levels, this might include evaluating the proposition that a particular volcano can deliver a future super-eruption, a supposition that could be attached to Aso volcano. But, simplistically taking the average recurrence interval between past caldera-forming eruptions at a given volcano is an unreliable guide to the likelihood of a future repeat: each past event represented a unique set of tectonic and magmatic conditions within a continually evolving volcanic system. Such processes are not temporally stationary nor statistically uniform. To evaluate the probability of a new M8 event at Aso, within the next 100 years, we performed a comprehensive stochastic probability uncertainty analysis using a model implemented with advanced computational Bayes Net (BN) software. Our eruption process model is informed by multiple strands of evidence from volcanology, petrology, geochemistry and geophysics, together with estimates of epistemic (knowledge) uncertainty, adduced from reviews of published data, modelling and from expert judgement elicitation. Several lines of evidence characterise the likely structure, magmatic composition and eruptive state of the present-day Aso volcano, which has had numerous smaller eruptions since Aso-4. To calculate the probability of another M8 eruption of Aso, we implemented probabilistic ‘Importance Sampling’ in our model. With this approach, we find the chance of an Aso-4 scale eruption (characterised by mean volume 500 km3 DRE and approximate 90
Cordilleran arcs are built by long periods of steady-state magmatism punctuated by transient high-flux magmatic episodes or flare-ups. Such flare-ups, manifested as periods of prodigious silicic volcanism and magmatism, result from geodynamic perturbations that cause elevated rates of magma addition to the crust. Questions remain, however, about how magmatic addition rates quantitatively compare between steady-state and flare-up modes of arc magmatism, and how long after the major geodynamic perturbation the flare-up begins. Here, we compute new estimates of erupted volumes over the last 35 Myr for the 22.5–29°S segment of the Central Andes based on a new volcanic geospatial database. These yield magmatic addition rates at least an order of magnitude higher during flare-up compared to steady-state conditions. A lag time of ~8–12 Myr between ocean ridge subduction (the major geodynamic perturbation in the Central Andean arc) and the onset of flare-up conditions is estimated.
Computation has become an essential part of today's personal, educational, civic, and career living, which necessitates preparation of a generation of future citizens who are knowledgeable of computational thinking (CT) concepts and are able to apply CT skills in daily life and work.Because of CT's use across fields, it is important that we take an interdisciplinary approach and ground the teaching and learning of CT in authentic and meaningful contexts with learners.This symposium explores different approaches of integrating CT into topics in formal settings.The six empirical studies of this symposium present designs of authentic environments that aim to infuse CT into plant science, literacy, ecosystems, general biology, and chemistry.These studies also report the findings of teacher and student learning from the implementations.Collectively these studies provide unique insights towards design recommendations, challenges, pedagogies, and opportunities in the rapidly developing STEM+C field.
Mapping volcanic flow deposits can be achieved by considering backscattering characteristics as a metric of surface roughness. In this study, we developed an approach to extract a measure of surface roughness from dual-band airborne Synthetic Aperture Radar (ASAR) backscattering data to characterize and map various volcanic flow deposits—namely, debris avalanches, lahars, lava flows, and pyroclastic density currents. We employed ASAR and Indian Space Research Organization (ISRO) airborne SAR datasets, from a joint project (ASAR-ISRO), acquired in December 2019 at 2 m spatial resolution, to assess the role and importance of incorporating dual-band data, i.e., L-band and S-band, into surface roughness models. Additionally, we derived and analyzed surface roughness from a digital surface model (DSM) generated from unoccupied aircraft systems (UAS) acquisitions using Structure from Motion (SfM) photogrammetry techniques. These UAS-derived surface roughness outputs served as meter-scale calibration products to validate the radar roughness data over targeted areas. Herein, we applied our method to a region in the United States over the Mount St. Helens volcano in the Cascade Range of Washington state. Our results showed that dual-band systems can be utilized to characterize different types of volcanic deposits and range of terrain roughness. Importantly, we found that a combination of radar wavelengths (i.e., 9 and 24 cm), in tandem with high-spatial-resolution backscatter measurements, yields improved surface roughness maps, compared to single-band, satellite-based approaches at coarser resolution. The L-band (24 cm) can effectively differentiate small, medium, and large-scale structures, namely, blocks/boulders from fine-grained lahar deposits and hummocks from debris avalanche deposits. Additionally, variation in the roughness estimates of lahar and debris avalanche deposits can be identified and quantified individually. In contrast, the S-band (9 cm) can distinguish different soil moisture conditions across variable terrain; for example, identify wet active channels. In principle, this dual-band approach can also be employed with time series of various other SAR data of higher coherence (such as satellite SAR), using different wavelengths and polarizations, encompassing a wider range of surface roughness, and ultimately enabling additional applications at other volcanoes worldwide and even beyond volcanology.
When volcanic unrest occurs, the scientific community can advance fundamental understanding of volcanic systems, but only with coordination before, during, and after the event across academic and governmental agencies. To develop a coordinated response plan, the Community Network for Volcanic Eruption Response (CONVERSE) orchestrated a scenario exercise centered around a hypothetical volcanic crisis in Arizona’s San Francisco Volcanic Field (SFVF). The exercise ran virtually from February 4 to March 4, 2022. Over 60 scientists from both academic and governmental spheres participated. The scenario exercise was assessed for its effectiveness in supporting collaborative production of knowledge, catalyzing transdisciplinary collaboration, supporting researcher confidence, and fostering a culture of inclusion within the volcanology community. This identified a need to support early career researchers through community and allyship. Overall, the 2022 CONVERSE exercise demonstrated how a fully remote, extended scenario can be authentically implemented and help broaden participation within the volcano science community.
As computational methods are widely used in science disciplines, integrating computational thinking (CT) into classroom materials can create authentic science learning experiences for students. In this study, we classroom-tested a CT-integrated geoscience curriculum module designed for secondary students. The module consisted of three inquiry investigations that were age-appropriately translated from the computational practices of volcanologists who study tephra hazards and risks. We developed a domain-specific, block-code-based computational modeling environment where students carried out 1 of the 3 science practices in each inquiry investigation: experimentation, data visualization and interpretation, and modeling. We examined (1) student learning outcomes using pre- and post-tests and (2) student reflections on the computationally supported science practices surveyed at the end of each inquiry investigation during the module. Results indicate that students made statistically significant gains in science content as well as in computationally supported experimentation, data visualization and interpretation, and modeling practices. Over 80% of students identified different ways in which block coding supported their practices during inquiry investigations. Based on these findings, we discuss implications for the future development of computationally supported inquiry investigations in science.
<p>The use of unoccupied aerial systems (UAS) in geoscience has dramatically improved our ability to collect data at high resolution, minimal cost, and in rapid response to sudden events. The wide range of sensor and platform configurations gives scientists great flexibility in survey design and data collection. Satellite remote sensing data has exceptional spatial coverage and continues to increase its data acquisition to meter-level resolution. UAS data can image to the cm-level resolution but lacks the same spatial coverage as satellite. By combining and comparing UAS data with satellite and ground-based remote sensing data we can utilize the different strengths of these systems. Here we demonstrate various UAS applications in high-resolution topographic change, land use classification, and sub-surface geological mapping. We use UAS payloads such as RTK georeferenced RGB and multispectral images, lidar, and magnetic sensors to image surface changes and sub-surface structures. We demonstrate the need for post-processing (PPK) high precision GNSS rover locations over utilizing only RTK position information.</p><p>Florida, USA, is home to rapidly changing beaches and wetlands, which are highly susceptible to our changing climate and destructive storm events. We show examples from beaches and wetlands in Pinellas County, Florida, USA where we have a) imaged the emergence and development of a barrier island, b) developed automated land use classification using photogrammetry and multispectral data, c) evaluated the impacts of a major hurricane event on a recently renourished beach. Pacaya Volcano, Guatemala, is an active volcano with frequent lava flows and historical flank collapse events. Using a combination of satellite DEMs, ground-based Terrestrial Radar Interferometry data, and UAS RGB SfM-photogrammetry, we have imaged recent lava flows in high-resolution showing details of lava flow levees and other structures. By comparing our data to pre-eruption satellite DEMs we can evaluate the volume and morphology of recently emplaced lava flows. In addition, we have collected magnetic data over recent lava flows that allows us to image the sub-surface structure of the lava flows and model lava flow properties. UASs are a powerful tool for remote sensing, geodetic, and geophysical data collection. They augment satellite and ground-based methodologies and by combining multidisciplinary data from these platforms we can image the earth in greater spatial and temporal detail than ever before. &#160;</p>
<p>Over the three-month duration of the 2021 Cumbre Vieja eruption, lava flows covered an area of 1,241 ha. (12.41 km2) out of the total 8,790 ha (87.90 km2) impacted by the eruption overall. Consequently, lava is responsible for the destruction of a majority of the 3,000 buildings and large agricultural areas. At the beginning of the eruption, authorities used a model to forecast the inundation areas. We compare that preliminary forecast with those produced by other models, such as MOLASSES, Q-LAVHA, MrLavaLoba, VolcFlow, and others. The different forecasted flow fields are also compared with the evolution of the flow field as observed by satellite and aerial mapping. Where available, we anchor dynamic model predictions for observables such as flow velocity to local measurements obtained from velocimetry on UAV and ground-based videos of flowing lava. Lava properties used in the models are informed by petrological analysis of samples collected during the eruption.&#160;</p>
A probabilistic volcanic hazard assessment (PVHA) for Ceboruco volcano (Mexico) is reported using PyBetVH, an e-tool based on the Bayesian Event Tree (BET) methodology. Like many volcanoes, Ceboruco is under-monitored. Despite several eruptions in the late Holocene and efforts by several university and government groups to create and sustain a monitoring network, this active volcano is monitored intermittently rather than continuously by dedicated groups. With no consistent monitoring data available, we look at the geology and the eruptive history to inform prior models used in the PVHA. We estimate the probability of a magmatic eruption within the next time window (1 year) of ~ 0.002. We show how the BET creates higher probabilities in the absence of monitoring data, which if available would better inform the prior distribution. That is, there is a cost in terms of higher probabilities and higher uncertainties for having not yet developed a sustained volcano monitoring network. Next, three scenarios are developed for magmatic eruptions: i) small magnitude (effusive/explosive ), ii) medium magnitude (Vulcanian/sub-Plinian) and iii) large magnitude (Plinian). These scenarios are inferred from the Holocene history of the volcano, with their related hazardous phenomena: ballistics, tephra fallout, pyroclastic density currents, lahars and lava flows. We present absolute probability maps (unconditional in terms of eruption size and vent location) for a magmatic eruption at Ceboruco volcano. With PyBetVH we estimate and visualize the uncertainties associated with each probability map. Our intent is that probability maps and uncertainties will be useful to local authorities who need to understand the hazard when considering the development of long-term urban and land-use planning and short-term crisis management strategies, and to the scientific community in their efforts to sustain monitoring of this active volcano.
Dramatic volcanic eruptions occurred in the Spring of 2021 in Iceland and St. Vincent. This column explores the use of a numerical model to understand the giant displacements of the Earth's surface that result from such volcanic activity. The model used was development by Japanese geophysicist Kiyoo Mogi to explain a much older eruption, the 1914 eruption of Sakurajima volcano, located in Kyushu, Japan. Mogi's model was so successful, and is still widely used today, because he took a step-by-step approach to solving this complicated problem, making simplifying assumptions where he could, and using data to the maximum extent possible to estimate a reasonable solution.
Evaluation of volcanic hazards typically focusses on single eruptive centres or spatially restricted areas, such as volcanic fields. Expanding hazard assessments across wide regions (e.g., large sections of a continental margin) has rarely been attempted, due to the complexity of integrating temporal and spatial variability in tectonic and magmatic processes. In this study, we investigate new approaches to quantify the hazards of such long-term active and complex settings, using the example of the 22.5–28°S segment of the Central Volcanic Zone of the Andes. This research is based on the estimation of: 1) spatial probability of future volcanic activity (based on kernel density estimation using a new volcanic geospatial database), 2) temporal probability of future volcanic events, and 3) areas susceptible to volcanic flow and fall processes (based on computer modeling). Integrating these results, we produce a set of volcanic hazard maps. We then calculate the relative probabilities of population centres in the area being affected by any volcanic phenomenon. Touristic towns such as La Poma (Argentina), Toconao (Chile), Antofagasta de la Sierra (Argentina), Socaire (Chile), and Talabre (Chile) are exposed to the highest relative volcanic hazard. In addition, through this work we delineate five regions of high spatial probability (i.e., volcanic clusters), three of which correlate well with geophysical evidence of mid-crustal partial melt bodies. Many of the eruptive centres within these volcanic clusters have poorly known eruption histories and are recommended to be targeted for future work. We hope this contribution will be a useful approach to encourage probabilistic volcanic hazard assessments for other arc segments.
Uncertainty quantification (UQ) in eruption source parameters, like tephra volume, plume height, and umbrella cloud radius, is a challenge for volcano scientists because tephra deposits are often sparsely sampled due to burial, erosion, and related factors. We find that UQ is improved by coupling an advection‐diffusion model with two Bayesian inversion approaches: (a) a robust but computationally expensive Generalized Likelihood Uncertainty Estimation algorithm, and (b) a more approximate but inexpensive parameter estimation algorithm combined with first‐order, second‐moment uncertainty estimation. We apply the two inversion methods to one sparsely sampled tephra fall unit from the 2070 BP El Misti (Peru) eruption and obtain: Tephra mass 0.78–1.4 × 10 11 kg; umbrella cloud radius 4.5–16.5 km, and plume height 8–35 km (95% confidence intervals). These broad ranges demonstrate the significance of UQ for eruption classification based on mapped deposits, which has implications for hazard management.
The Blackfoot Reservoir volcanic field (BRVF), Idaho, USA, is a bimodal volcanic field that has hosted silicic eruptions during at least two episodes, as recently as 58 ka. Using newly collected ground and boat-based gravity data, two large negative anomalies (-16 mGal) are modeled as shallow (<1 km) intrusions beneath a NE-trending alignment of BRVF rhyolite domes and tuff rings. Given the trade-off between density contrast and model volume, best-fit gravity inversion models yield a total intrusion volume of 50-120 km3; a density contrast of -400 kg m-3 results in two intrusions, each similar to 9 km x4.5 km and about 0.5 km thick, with cumulative volume of 100 km3. A network of 340 degrees-360 degrees trending faults lies directly above and on the margins of the mapped gravity anomalies. Most of these faults have 5-10 m throw; one has throw up to similar to 50 m. We suggest that the emplacement of shallow sill-like intrusions produced this fault zone and also created a ENE-trending fault set, indicating widespread ground deformation during intrusion emplacement. The intrusions and silicic domes are located 3-5 km E of a regional, 20 mGal step in gravity. We interpret this step in gravity as thickening of the Upper Precambrian to lowermost Cambrian quartzites in the Meade thrust sheet, part of the Idaho-Wyoming Thrust Belt. Silicic volcanism in the BRVF is a classic example of volcanotectonic interaction, influenced by regional structure and creating widespread deformation. We suggest volcanic hazard assessments should consider the possibility of large-volume silicic eruptions in the future.
 Laura J. Connor合作论文数Department of Geology - SCA 528, University of South Florida73
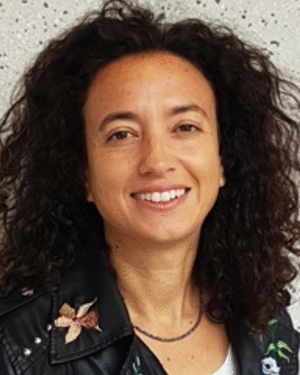 Costanza Bonadonna合作论文数Earth and Environmental Sciences Section, University of Geneva26
 Brittain E. Hill合作论文数24
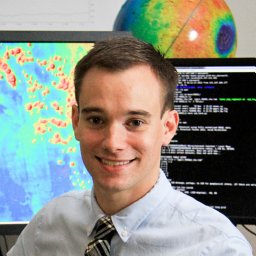 Jacob A Richardson合作论文数NASA, GSFC Sellers Exoplanet Environm Collaborat20
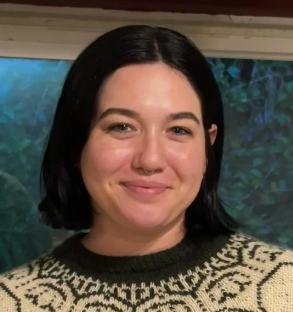 Lis Gallant合作论文数Geology Department, College of Natural and Health Sciences, University of Hawaii at Hilo20Paul H. Wetmore合作论文数20Koji Kiyosugi合作论文数17
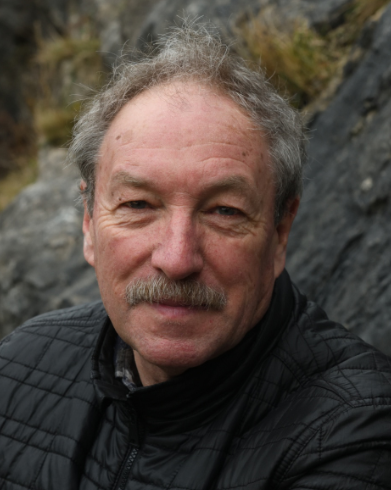 Stephen Sparks合作论文数School of Earth Sciences, University of Bristol15
 Sarah E. Kruse合作论文数Department of Geology, University of South Florida14
 Rocco Malservisi合作论文数School of Geosciences, College of Arts and Sciences, University of South Florida;Department of Geology, College of Arts and Sciences, University of South Florida14
 Ivan Savov合作论文数School of Earth and Environment, Faculty of Environment, University of Leeds14
 Sylvain Charbonnier合作论文数centre de recherche sur la paléobiodiversité et les paléoenvironnements, Muséum national d’histoire naturelle14
 Alain C.M. Volentik合作论文数11P. C. La Femina合作论文数11
 A. Germa合作论文数Laboratoire de Géochronologie Multi-Techniques, Université Paris-Sud 1111John A. Stamatakos合作论文数Center for Nuclear Waste Regulatory Analyses, Southwest Research Institute10
 Timothy Dixon合作论文数School of Geosciences, College of Arts & Sciences, University of South Florida;Geodesy Lab, College of Arts & Sciences, University of South Florida9larry j connor合作论文数8j a saballos合作论文数8
 Ward Sanford合作论文数United States Geological Survey8
 Robert Constantinescu合作论文数Institute of Earth Science and Engineering, The University of Auckland8Wilfried Strauch合作论文数Instituto Nicaragüense de Estudios Territoriales8leah m courtland合作论文数Phys & Earth Space Sci, Univ Indianapolis7
 Stewart K. Sandberg合作论文数Department of Geology;University of South Florida;Department of Geology, University of South Florida7F Michael Conway合作论文数7s c p pearson合作论文数6
 Jose Armando Saballos合作论文数6Fanghui Deng (邓方慧)合作论文数Scripps Inst Oceanog, Univ Calif San Diego6
 Willy Aspinall合作论文数6
 Mel Rodgers合作论文数Sch Geosci, Univ S Florida5
 Kelvin Berryman合作论文数Natural Hazards Division, GNS Science5
 Chris M. Hall合作论文数5
 Mark Cloos合作论文数Department of Earth and Planetary Sciences, Jackson School of Geosciences, The University of Texas at Austin5Olivier Jaquet合作论文数5Re Stoiber合作论文数4M. Diez合作论文数4Neil Chapman合作论文数4
 Surui Xie (谢苏锐)合作论文数Scripps Institution of Oceanography, University of California San Diego4j m wilson合作论文数4
 Jeremy T. White合作论文数Corresponding author.4
 Jan Lindsay合作论文数School of Environment, Faculty of Science, The University of Auckland4
 Andy Woods合作论文数Department of Earth Sciences, University of Cambridge;St John's College, University of Cambridge4Sean Callihan合作论文数4
 James F. Luhr合作论文数Department of Mineral Sciences, National Museum of Natural History, Smithsonian Institution4Peter Lafemina合作论文数Penn State Univ, University Pk4C. D. Condit合作论文数4Katrin Sieron合作论文数4
 Mauro Rosi合作论文数Department of Earth Sciences, Universita di Pisa4David A. Ferrill合作论文数Southwest Research Institute4




