The Japan Aerospace Exploration Agency (JAXA) has developed a novel partial column CO2 (XCO2) dataset from Japan’s Greenhouse Gases Observing Satellite (GOSAT) that partitions XCO2 into contributions from the lower troposphere (surface to ~4 km a.g.l.) and upper troposphere (~4 km to ~12 km a.g.l.). Evaluating this two-layer product is essential for its application in studies of atmospheric CO2 distributions and surface fluxes. Here, we assess the JAXA/GOSAT two-layer XCO2 using aircraft measurements from ACT-America, ATom, NOAA aircraft profiling network, and other available datasets, along with global model ensembles from the OCO-2 Model Intercomparison Project (MIP). GOSAT XCO2 generally agrees well with aircraft measurements in zonal means for both tropospheric layers, demonstrating its ability to capture large-scale vertical CO2 structures. A notable low bias of up to 10 ppm is identified in northern high latitudes (50°–80°N). Over northern midlatitudes, particularly North America where aircraft coverage is most extensive, GOSAT shows better agreement with observations in lower-tropospheric XCO2 than the OCO-2 MIP simulations, suggesting potential biases in model surface fluxes and/or transport. Significant differences between GOSAT and OCO-2 MIP are found in both layers over the Amazon (2–10 ppm), southern China (0–8 ppm), India (5–8 ppm), tropical Africa (2–10 ppm), and the Arctic (>10 ppm). However, limited aircraft data in these regions constrain independent validation. Our findings demonstrate that the GOSAT two-layer XCO2 provides a valuable constraint for identifying possible biases in CO2 fluxes and vertical mixing in current global models and has potential to improve surface CO2 flux inversions.
Subnational climate actions, such as the decarbonization of cities, require timely and spatially granular greenhouse gas (GHG) information. However, commonly used emissions datasets often do not capture subnational variations because such differences are masked by national-level aggregation. Here we present the National Emissions Modeling System for GHG emissions in Japan (NEMS-GHG), a framework for modeling monthly emissions at 1 × 1 km spatial resolution. The system currently estimates fossil-fuel CO _2 (FFCO _2 ) emissions for eight sectors, with sector-specific spatiotemporal variations derived from publicly accessible socioeconomic statistics. This paper outlines the methodology and the initial version (1.0) of NEMS-GHG, focusing on estimates for 2015, and compares the resulting dataset with four established emissions inventories. Annual FFCO _2 emissions from NEMS-GHG closely match those reported in Japan’s National Greenhouse Gas Inventory. At the subnational scale, NEMS-GHG reproduces regional variations reasonably well, although noticeable discrepancies appear in electricity generation and industry and commerce when compared with a widely used global dataset. Comparisons of 1 km emissions distributions show differences exceeding 100 ≥ 10 Gg C yr ^-1 . While further refinement is needed to improve sector-specific spatial distributions, NEMS-GHG provides a transparent and detailed bottom-up framework capable of estimating recent emissions from local socioeconomic sources at municipality and prefecture scales. The system can support the development and evaluation of subnational mitigation strategies by identifying locally relevant emission sources.
Urban areas are major sources of greenhouse gas (GHG) and air pollutant emissions. Given their substantial potential for mitigation, urban emissions need to be accurately monitored in a timely manner. Satellite observations have proven to be a practical approach -and an independent, objective verification support tool- for monitoring emissions from urban areas worldwide. In particular, the combined use of co-emitted GHG and air pollutant data, such as Carbon Dioxide (CO _2 ) and Carbon Monoxide (CO), can help characterize combustion type and efficiency across different countries and regions, as well as monitor changes in response to economic development and/or mitigation policy measures. This study examines the utility of space-based GHG and air quality (AQ) data collected by the Greenhouse Gases Observing Satellite-2 (GOSAT-2, 2018-present) for studying urban emissions. GOSAT-2 uniquely collects GHG and CO data simultaneously, enabling co-emitted gas analysis without requiring co-located satellite data. In particular, this study uses partial column CO _2 data and total column CO data retrieved for 2018–2021. We estimate concentration enhancements of CO _2 and CO over 65 urban areas worldwide (population > 1 million) and examine their relationships. We find that the CO _2 –CO relationship is well represented by the Modified Environmental Kuznets Curve, which describes the link between AQ and economic development. We also examine CO/CO _2 ratios calculated using GOSAT-2 data and the Emissions Database for Global Atmospheric Research (EDGAR) inventory. Urban areas in Southeast Asia and Africa regions show large discrepancies (>40%) between ratios from GOSAT-2 and EDGAR, which might be attributable to biofuel use that is poorly represented in inventories. These findings suggest that simultaneous CO _2 and CO observations could help monitor emissions in regions with less robust bottom-up estimates. Such observations also provide a top–down, independent assessment of emission inventories and progress toward sustainable development goals.
The decline in marine resources, exemplified by the Sakura shrimp (Lucensosergia lucens), highlights the pressing need for aquaculture solutions. This study pioneers the development of the first individual-based model (IBM) to explore the impact of temperature on Sakura shrimp larvae development. By integrating novel experimental data on the effect of temperature on larvae development and survival, and individual variability, our model provides insights crucial for informed artificial rearing practices. In our breeding experiments, larvae were successfully raised to the third protozoa stage, with development time and survival rates showing high sensitivity to water temperature. Notably, embryonic development times exhibited significant variations across temperature conditions, with durations of 3 days at 14 C-degrees, 2 days at 18 C-degrees, and 1.3 days at 26 C-degrees. However, none of the individuals reached adulthood, highlighting the complexity of larval development under different thermal regimes. Our individual-based model, integrating experimental data and insights from Omori's (1971) work, revealed the Ratkowsky et al. (1983) equation as the most suitable representation of temperature-dependent larval growth. Similarly, the Gaussian equation emerged as the optimal choice for capturing temperature-dependent survival patterns. Notably, the model predicted an optimal larval temperature of 24( degrees)C. By scrutinizing these patterns, our model not only elucidates the temperature-dependent dynamics of Sakura shrimp larval development but also provides a valuable framework for optimizing artificial rearing practices. Moving forward, future iterations of the model should incorporate considerations of salinity and environmental effects on hatching success to further refine our understanding of Sakura shrimp aquaculture.
Managing carbon stocks in the land, ocean, and atmosphere under changing climate requires a globally‐integrated view of carbon cycle processes at local and regional scales. The growing Earth Observation (EO) record is the backbone of this multi‐scale system, providing local information with discrete coverage from surface measurements and regional information at global scale from satellites. Carbon flux information, anchored by inverse estimates from spaceborne Greenhouse Gas (GHG) concentrations, provides an important top‐down view of carbon emissions and sinks, but currently lacks global continuity at assessment and management scales (<100 km). Partial‐column data can help separate signals in the boundary layer from the overlying atmosphere, providing an opportunity to enhance surface sensitivity and bring flux resolution down from that of column‐integrated data (100–500 km). Based on a workshop held in September 2024, the carbon cycle community envisions a carbon observation system leveraging GHG partial columns in the lower and upper troposphere to weave together information across scales from surface and satellite EO data, and integration of top‐down/bottom‐up analyses to link process understanding to global assessment.
Quantifying greenhouse gas (GHG) emissions is a critical task for climate monitoring and mitigation actions. Under the Paris Agreement, for example, accounting and reporting of GHG emissions are mandatory for Parties. Reported emissions are often calculated using activity data approaches. The robustness of the activity data collection is a key for obtaining accurate emission estimates; however, in a period of open conflict or war, the systems for data collection can be desperately damaged and destroyed and thus the ability of achieving robust GHG estimates and transparent reporting can be significantly hampered. Also, military emissions, which are thought to be often poorly quantified, should increase significantly than peace times. We attempted to quantify GHG emissions during the first 18 months of the 2022/2023 full-scale war in Ukraine. We first identified major, war-related, emission drivers and processes from the territory of Ukraine. We analyzed publicly available data and used expert judgment to estimate emissions from (1) the use of bombs, missiles, barrel artillery, and mines; (2) the consumption of oil products for military operations; (3) fires at petroleum storage depots and refineries; (4) fires in buildings and infrastructure facilities; (5) fires on forest and agricultural lands; and (6) the decomposition of war-related garbage/waste. Those sources are often not covered by current GHG inventory guidelines, and thus are not likely to be included in national inventory reports. Our estimate of the war-related emissions of carbon dioxide (CO2), methane, (CH4) and nitrous oxide (N2O) for the first 18 months of the war in Ukraine is 77 MtCO2-eq. with a relative uncertainty of ±22 % (95 % confidence interval). It is important to note that these emissions are considered to be emissions from Ukraine in reporting because the emissions occurred within the territory of Ukraine. The current emission accounting system (e.g. UNFCCC) is not designed to account war/conflict time emissions adequately. The uncertainties due to the unaccounted emissions are also aliasing to our global and regional carbon budget calculations.
The carbon sink over land plays a key role in the mitigation of climate change by removing carbon dioxide (CO2) from the atmosphere. Accurately assessing the land sink capacity across regions should contribute to better future climate projections and help guide the mitigation of global emissions towards the Paris Agreement. This study estimates terrestrial CO2 fluxes over India using a high-resolution global inverse model that assimilates surface observations from the global observation network and the Indian subcontinent, airborne sampling from Brazil, and data from the Greenhouse gas Observing SATellite (GOSAT) satellite. The inverse model optimizes terrestrial biosphere fluxes and ocean-atmosphere CO2 exchanges independently, and it obtains CO2 fluxes over large land and ocean regions that are comparable to a multi-model estimate from a previous model intercomparison study. The sensitivity of optimized fluxes to the weights of the GOSAT satellite data and regional surface station data in the inverse calculations is also examined. It was found that the carbon sink over the South Asian region is reduced when the weight of the GOSAT data is reduced along with a stricter data filtering. Over India, our result shows a carbon sink of 0.040 ± 0.133 PgC yr−1 using both GOSAT and global surface data, while the sink increases to 0.147 ± 0.094 PgC yr−1 by adding data from the Indian subcontinent. This demonstrates that surface observations from the Indian subcontinent provide a significant additional constraint on the flux estimates, suggesting an increased sink over the region. Thus, this study highlights the importance of Indian sub-continental measurements in estimating the terrestrial CO2 fluxes over India. Additionally, the findings suggest that obtaining robust estimates solely using the GOSAT satellite data could be challenging since the GOSAT satellite data yield significantly varies over seasons, particularly with increased rain and cloud frequency.
We introduce a new method for calculating the carbon dioxide () emissions from point sources (e.g., power stations) and cities using the cross‐sectional flux method constrained by space‐based and nitrogen dioxide () observations. First, we derive a proxy estimate for enhancements from observations through linear regression near the plume cross‐section. Then, we fit a Gaussian function to the resulting ‐based enhancement data. We apply this method to data from the Orbiting Carbon Observatory‐2 (OCO‐2) and the Sentinel‐5 Precursor TROPOspheric Monitoring Instrument (S5P/TROPOMI) starting from May 2018. The method is tested on the Matimba and Medupi power stations in South Africa, as well as the cities of Madrid (Spain), Las Vegas (USA), and Baghdad (Iraq). The corresponding mean emission estimates are 49 17 Mt/yr, 22 10 Mt/yr, 30 8 Mt/yr, and 41 19 Mt/yr, respectively. The results show that the method is robust and can be applied to challenging cases where data helps constrain the fit. The proxy approach allows evaluation of 17 additional scenes (out of 53), reducing the average error of individual emission estimates from approximately 30%–40% to 22%–25% compared with the traditional method. Furthermore, we highlight the significant potential of satellite data to uncover discrepancies in reported emission estimates, for example, by identifying under‐reported or missing emission sources. The proposed approach can be extended to other case studies and applied to future satellite missions with joint observations, such as CO2M, GOSAT‐GW, TanSat‐2, and TANGO.
In the U.S., emissions of greenhouse gases and air pollutants are often developed independently. Here, we describe the GR eenhouse gas A nd A ir P ollutants E missions S ystem (GRA 2 PES), which provides gridded emissions of fossil‐fuel carbon dioxide (ffCO 2 ) and 93 air quality (AQ) species for 17 combustion and non‐combustion sectors at 4 km × 4 km spatial resolution across the contiguous US. We find that the AQ emissions most spatially correlated with ffCO 2 are nitrogen oxides (NO x , ρ = 0.67), followed by sulfur dioxide (SO 2 , ρ = 0.51), carbon monoxide (CO, ρ = 0.44), and fine particulate matter (PM 2.5 , ρ = 0.38). We evaluate GRA 2 PES ffCO 2 emissions with an ensemble of publicly available regional and global inventories at national (Normalized Mean Bias (NMB) = +1.4%), state (NMB = +1.5%, R 2 = 0.98), and urban (NMB = +11.5%, R 2 = 0.97) scales. Nationally, the differences of publicly available inventories from the ensemble average range from −10.0% to +5.7%, and consistency diverges at state and urban scales. We simulate GRA 2 PES ffCO 2 in a particle dispersion model and compare to measurements of radiocarbon ( 14 C)‐derived ffCO 2 collected in Los Angeles (August 2021), with results suggesting that GRA 2 PES ffCO 2 may be low by 19% for this city, but well within model‐observation differences for other publicly available inventories (−43% to +94%). GRA 2 PES AQ/ffCO 2 ratios converted to concentration space generally agree with field observations (NMB = +4%, log R 2 = 0.90). Lastly, we present a method by which to utilize GRA 2 PES to derive AQ emission fluxes from ffCO 2 emissions.
In the U.S., emissions of greenhouse gases and air pollutants are often developed independently. Here, we describe the GReenhouse gas And Air Pollutants Emissions System (GRA(2)PES), which provides gridded emissions of fossil-fuel carbon dioxide (ffCO(2)) and 93 air quality (AQ) species for 17 combustion and non-combustion sectors at 4 km x 4 km spatial resolution across the contiguous US. We find that the AQ emissions most spatially correlated with ffCO(2) are nitrogen oxides (NOx, rho = 0.67), followed by sulfur dioxide (SO2, rho = 0.51), carbon monoxide (CO, rho = 0.44), and fine particulate matter (PM2.5, rho = 0.38). We evaluate GRA(2)PES ffCO(2) emissions with an ensemble of publicly available regional and global inventories at national (Normalized Mean Bias (NMB) = +1.4%), state (NMB = +1.5%, R-2 = 0.98), and urban (NMB = +11.5%, R-2 = 0.97) scales. Nationally, the differences of publicly available inventories from the ensemble average range from -10.0% to +5.7%, and consistency diverges at state and urban scales. We simulate GRA(2)PES ffCO(2) in a particle dispersion model and compare to measurements of radiocarbon (C-14)-derived ffCO(2) collected in Los Angeles (August 2021), with results suggesting that GRA(2)PES ffCO(2) may be low by 19% for this city, but well within model-observation differences for other publicly available inventories (-43% to +94%). GRA(2)PES AQ/ffCO(2) ratios converted to concentration space generally agree with field observations (NMB = +4%, log R-2 = 0.90). Lastly, we present a method by which to utilize GRA(2)PES to derive AQ emission fluxes from ffCO(2) emissions.
As atmospheric CO2 emissions and the trend of urbanization both increase, the ability to accurately assess the CO2 budget from urban environments becomes more important for effective CO2 mitigation efforts. This task can be difficult for complex areas such as the urban–coastal Mediterranean region near Marseille, France, which contains the second most populous city in France as well as a broad coastline and nearby mountainous terrain. In this study, we establish a CO2 modeling framework for this region for the first time using WRF-Chem and demonstrate its efficacy through comparisons against cavity-ringdown spectrometer measurements recorded at three sites: one 75 km north of the city in a forested area, one in the city center, and one at the urban/coastal border. A seasonal CO2 analysis compares Summertime 2016 and Wintertime 2017, to which Springtime 2017 is also added due to its noticeably larger vegetation uptake values compared to Summertime. We find that there is a large biogenic signal, even in and around Marseille itself, though this may be a consequence of having limited fine-scale information on vegetation parameterization in the region. We further find that simulations without the urban heat island module had total CO2 values 0.46 ppm closer to the measured enhancement value at the coastal Endoume site during the Summertime 2016 period than with the module turned on. This may indicate that the boundary layer on the coast is less sensitive to urban influences than it is to sea-breeze interactions, which is consistent with previous studies of the region. A back-trajectory analysis with the Lagrangian Particle Dispersion Model found 99.83% of emissions above 100 mol km−2 month−1 captured in Summer 2016 by the three measurement towers, providing evidence of the receptors’ ability to constrain the domain. Finally, a case study showcases the model’s ability to capture the rapid change in CO2 when transitioning between land-breeze and sea-breeze conditions as well as the recirculation of air from the industrial Fos region towards the Marseille metroplex. In total, the presented modeling framework should open the door to future CO2 investigations in the region, which can inform policymakers carrying out CO2 mitigation strategies.
BACKGROUND:The Greenhouse gas Observations of Biospheric and Local Emissions from the Upper sky (GOBLEU) is a new joint project by Japan Aerospace Exploration Agency (JAXA) and ANA HOLDING INC. (ANAHD), which operates ANA flights. GOBLEU aims to visualizes our climate mitigation effort progress in support of subnational climate mitigation by collecting greenhouse gas (GHG) data as well as relevant data for emissions (nitrous dioxide, NO2) and removals (Solar-Induced Fluorescence, SIF) from regular passenger flights. We developed a luggage-sized instrument based on the space remote-sensing techniques that JAXA has developed for Japan's Greenhouse gas Observing SATellite (GOSAT). The instrument can be conveniently installed on a coach-class passenger seat without modifying the seat or the aircraft. RESULTS:The first GOBLEU observation was made on the flight from the Tokyo Haneda Airport to the Fukuoka Airport, with only the NO2 module activated. The collected high-spatial-resolution NO2 data were compared to that from the TROPOspheric Monitoring Instrument (TROPOMI) satellite and surface NO2 data from ground-based air quality monitoring stations. While GOBLEU and TROPOMI data shared the major concentration patterns largely driven by cities and large point sources, regardless of different observation times, we found fine-scale concentration pattern differences, which might be an indication of potential room for GOBLEU to bring in new emission information and thus is worth further examination. We also characterized the levels of NO2 spatial correlation that change over time. The quickly degrading correlation level of GOBLEU and TROPOMI suggests a potentially significant impact of the time difference between CO2 and NO2 as an emission marker and, thus, the significance of co-located observations planned by future space missions. CONCLUSIONS:GOBLEU proposes aircraft-based, cost-effective, frequent monitoring of greenhouse emissions by GOBLEU instruments carried on regular passenger aircraft. Theoretically, the GOBLEU instrument can be installed and operated in most commercially used passenger aircraft without modifications. JAXA and ANAHD wish to promote the observation technique by expanding the observation coverage and partnership to other countries by enhancing international cooperation under the Paris Agreement.
Download This Paper Open PDF in Browser Add Paper to My Library Share: Permalink Using these links will ensure access to this page indefinitely Copy URL Copy DOI
The seasonal fluctuations of the copepod Eodiaptomus japonicus, which dominates the zooplankton community of Lake Biwa, have been disrupted several times over the past 45 years. The aim of this study was to clarify the primary environmental factor that caused the disrupted seasonal cycle in population density of E. japonicus. Here, we tested the hypothesis that the disruption in their seasonal cycle was due to the impacts of water temperature, food conditions, and predator pressure, using an individual-based model (IBM). Based on the experimental data from the literature, we described the growth and reproduction of E. japonicus using temperature- and food-dependent functions. Previously, the developmental time of this species was expressed using Bělehrádek’s equation. In this study, we applied the Kontodimas equation, which successfully reproduced the effects of food scarcity at higher temperatures. Additionally, the influence of predators was incorporated into the survival rate of adult individuals. The long-term data set of Lake Biwa was input into the developed model to simulate the population fluctuations during the disruption period (1975–1979) and stable period (1995–1999) of their seasonal cycle. The combination of environmental data to be input was (1) water temperature, food availability, and predators; (2) water temperature and food availability; and (3) water temperature and predators. Disruptions in the seasonal cycle of the population were only observed in scenario (1) during the disruption period simulation, suggesting that the disrupted seasonal cycle of this species in Lake Biwa may have been caused by the effects of both food condition and predators. The results of simulation scenarios (2) and (3) indicated that predators have a stronger impact on the population than food availability. This time, we used common and simple indicators to describe food conditions and predators, but the model can be improved to be more complex and accurate as more data become available. Such models are important tools for understanding the relationship between environmental factors and the dynamics of diaptomid copepod populations.
The executable specification is one of the powerful tools in lightweight formal software development. VDM-SL allows the explicit and executable definition of operations that reference and update internal state through imperative statements. While the extensive executable subset of VDM-SL enables validation and testing in the specification phase, it also brings difficulties in reading and debugging as in imperative programming. In this paper, we define specification slicing for VDM-SL based on program slicing, a technique used for debugging and maintaining program source code in implementation languages. We then present and discuss its applications. The slicer for VDM-SL is implemented on ViennaTalk and can be used on browsers and debuggers describing the VDM-SL specification.
Accounting and reporting of greenhouse gas (GHG) emissions are mandatory for Parties under the Paris Agreement. Emissions reporting is important for understanding the global carbon cycle and for addressing global climate change. However, in a period of open conflict or war, military emissions increase significantly and the accounting system is not currently designed to account adequately for this source. In this paper we analyze how, during the first 18 months of the 2022/2023 full-scale war in Ukraine, GHG national inventory reporting to the UNFCCC was affected. We estimated the decrease of emissions due to a reduction in traditional human activities. We identified major, war-related, emission processes from the territory of Ukraine not covered by current GHG inventory guidelines and that are not likely to be included in national inventory reports. If these emissions are included, they will likely be incorporated in a way that is not transparent with potentially high uncertainty. We analyze publicly available data and use expert judgment to estimate such emissions from (1) the use of bombs, missiles, barrel artillery, and mines; (2) the consumption of oil products for military operations; (3) fires at petroleum storage depots and refineries; (4) fires in buildings and infrastructure facilities; (5) fires on forest and agricultural lands; and (6) the decomposition of war-related garbage/waste. Our estimate of these war-related emissions of carbon dioxide, methane, and nitrous oxide for the first 18 months of the war in Ukraine is 77 MtCO2-eq. with a relative uncertainty of +/-22 % (95 % confidence interval).
Top-down approaches, such as atmospheric inversions, are a promising tool for evaluating emission estimates based on activity-data. In particular, there is a need to examine carbon budgets at subnational scales (e.g. state/province), since this is where the climate mitigation policies occur. In this study, the subnational scale anthropogenic CO _2 emissions are estimated using a high-resolution global CO _2 inverse model. The approach is distinctive with the use of continuous atmospheric measurements from regional/urban networks along with background monitoring data for the period 2015–2019 in global inversion. The measurements from several urban areas of the U.S., Europe and Japan, together with recent high-resolution emission inventories and data-driven flux datasets were utilized to estimate the fossil emissions across the urban areas of the world. By jointly optimizing fossil fuel and natural fluxes, the model is able to contribute additional information to the evaluation of province–scale emissions, provided that sufficient regional network observations are available. The fossil CO _2 emission estimates over the U.S. states such as Indiana, Massachusetts, Connecticut, New York, Virginia and Maryland were found to have a reasonable agreement with the Environmental Protection Agency (EPA) inventory, and the model corrects the emissions substantially towards the EPA estimates for California and Indiana. The emission estimates over the United Kingdom, France and Germany are comparable with the regional inventory TNO–CAMS. We evaluated model estimates using independent aircraft observations, while comparison with the CarbonTracker model fluxes confirms ability to represent the biospheric fluxes. This study highlights the potential of the newly developed inverse modeling system to utilize the atmospheric data collected from the regional networks and other observation platforms for further enhancing the ability to perform top-down carbon budget assessment at subnational scales and support the monitoring and mitigation of greenhouse gas emissions.
Over the past decade, 1000s of cities have pledged reductions in carbon dioxide emissions. However, tracking progress toward these pledges has largely relied exclusively on activity-based, self-reported emissions inventories, which often underestimate emissions due to incomplete accounting. Furthermore, the lack of a consistent framework that may be deployed broadly, across political boundaries, hampers understanding of changes in both city-scale emissions and the global summation of urban emissions mitigation actions, with insight being particularly limited for cities within the global south. Given the pressing need for rapid decarbonization, development of a consistent framework that tracks progress toward city-scale emissions reduction targets, while providing actionable information for policy makers, will be critical. Here, we combine satellite-based observations of atmospheric carbon dioxide and an atmospheric model to present an atmospherically-based framework for monitoring changes in urban emissions and related intensity metrics. Application of this framework to 77 cities captures ∼16% of global carbon dioxide emissions, similar in magnitude to the total direct emissions of the United States or Europe, and demonstrates the framework’s ability to track changes in emissions via satellite-observation. COVID-19 lockdowns correspond to an average ∼21% reduction in emissions across urban systems over March–May of 2020 relative to non-lockdown years. Urban scaling analyses suggest that per capita energy savings drive decreases in emissions per capita as population density increases, while local affluence and economic development correspond to increasing emissions. Results highlight the potential for a global atmospherically-based monitoring framework to complement activity-based inventories and provide actionable information regarding interactions between city-scale emissions and local policy actions.
Abstract. Bottom-up accounting methods of carbon dioxide (CO2) emissions can provide high-resolution emissions estimates at a global scale; however, the necessary in situ observations to verify these emissions are limited in coverage. Space-based observations of CO2 in the Earth’s atmosphere expand this coverage to a near-global scale to inform carbon cycle science and record emission trends. This work applied an observing system simulation experiment (OSSE) to characterize the flux information contained in “Snapshot Area Map” (SAM) CO2 measurements from the Orbiting Carbon Observatory-3 (OCO- 3). Unlike previous space-based carbon-observing systems, OCO-3 SAMs provide spatially dense observations of CO2 over targeted urban areas at unprecedented coverage. A Bayesian inversion using synthetic data was applied to these SAMs to explore their effectiveness in optimizing estimates of fossil fuel CO2 (FFCO2) emissions from the Los Angeles Basin. Results demonstrated that errors in the locations of large point sources diminished the inversion’s ability to reduce errors at the sub-city-level. Furthermore, reductions in atmospheric transport error exacerbated these issues. Only after geolocation errors in large point source locations were removed and atmospheric transport error was reduced did individual SAM observations provide modest corrections to prior flux estimates. The aggregation of multiple SAMs proved to be effective in reducing systematic errors in manufacturing- and transportation-related estimates, demonstrating the need for similar measurements in future space-based missions.
To limit global climate change, ultimately it will be necessary to minimize the use of all fossil fuels for energy. Because the rate of CO2 emissions per unit of primary energy varies among the fossil fuels, it is useful to focus first on reducing the use of coal, the fuel with the most CO2 per unit of energy used. Although multiple factors are involved in the choice of which fuel will be used for a given purpose, data on CO2 emissions show that over the last 25 years there has been an evolution in the fraction of emissions away from coal and toward natural gas. That is, although total emissions have continued to increase globally, the fraction attributable to coal has been decreasing in many places. This is true for the global sum of emissions, for Annex I countries, and for all regions except Asia Pacific. The fraction of emissions from oil products has varied largely with growth in the contribution of petroleum transportation fuels. Focus on decreasing the sum of all fossil fuels is needed, especially among the major energy users in the Asia Pacific region, but progress in the decreasing relative use of coal is promising.
 Shamil Maksyutov合作论文数Center for Global Environmental Research, National Institute for Environmental Studies82
 Thomas Lauvaux合作论文数Laboratoire des Sciences|du Climat et de l'Environnement47
 Vinu Valsala合作论文数Center for Global Environmental Research, National Institute for Environmental Studies42
 Dmitry Belikov合作论文数National Institute for Environmental Studies41
 makoto saito合作论文数35
 Alexander Ganshin合作论文数Yandex33
 Eric A. Kort合作论文数College of Engineering Climate and Space Sciences and Engineering, University of Michigan29
 Lesley E Ott合作论文数NASA Goddard Space Flight Center;U.S. Greenhouse Gas Center;Integrated Modeling Virtual Institute27r j andres合作论文数26r zhuravlev合作论文数26
 Kevin Gurney合作论文数School of Informatics, Computing and Cyber Systems, Northern Arizona University;Crosswalk Labs25Dien Wu合作论文数24
 Chris O'Dell合作论文数Cooperative Institute for Research in the Atmosphere, Colorado State University22
 Isamu Morino合作论文数Earth System Division, Satellite Observation Center, National Institute for Environmental Studies22
 Rostyslav Bun合作论文数Lviv Polytechnic National University21
 Annmarie Eldering合作论文数National Institute of Standards and Technology;Eldering Consulting, LLC19
 Sha Feng合作论文数Penn State Univ, Dept Meteorol & Atmospher Sci, University Pk, PA 16802 USA17Osamu Uchino合作论文数17
 Tatsuya Yokota合作论文数Center for Global Environmental Research, National Institute for Environmental Studies17
 B. Weir合作论文数Department of Mathematics, University of Arizona17Yukio Yoshida合作论文数16
 Ito Akihiko (伊藤昭彦)合作论文数Earth System Division, National Institute for Environmental Studies15Tazu Saeki合作论文数15
 Ning Zeng合作论文数Department of Atmospheric and Oceanic Science, University of Maryland;Earth System Science Interdisciplinary Center, University of Maryland;Department of Geology, University of Maryland;Carbon Lockdown14
 Johannes Kaiser合作论文数The Climate and Environmental Research Institute NILU;SatFire Kaiser14
 John Chun-Han Lin合作论文数Department of Atmospheric Sciences, University of Utah;Wilkes Center for Climate Science & Policy, University of Utah;Utah-Atmospheric Trace Gas & Air Quality Lab14
 Abhishek Chatterjee合作论文数13Sergey Oshchepkov合作论文数13
 Steven Pawson合作论文数Goddard Space Flight Center, National Aeronautics and Space Administration13
 Ben Poulter合作论文数Spark Climate Solutions;Department of Geographical Sciences, College of Behavioral & Social Sciences, University of Maryland12jc lin合作论文数11
 Prabir K. Patra合作论文数Earth Surface System Research Center, Institute of Arctic Climate and Environment Research, Japan Agency for Marine-Earth Science and Technology;Chiba University;Center for Atmospheric and Oceanic Studies, Tohoku University11
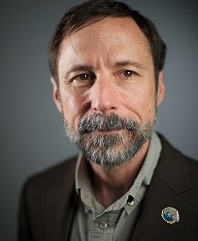 David Crisp合作论文数Jet Propulsion Laboratory, California Institute of Technology;NASA11Xinxin Ye (叶欣欣)合作论文数10
 Rajesh Janardanan合作论文数Earth Syst Div, Natl Inst Environm Studies10Hiroshi Takagi合作论文数10
 Andrey Bril合作论文数National Institute for Environmental Studies;Nagoya University;National Institute for Environmental Studies, Nagoya University10
 Miguel O. Román合作论文数Earth Sciences Division, Goddard Space Flight Center, National Aeronautics and Space Administration10
 Andrew Schuh合作论文数10
 Andre Butz合作论文数Institute of Environmental Physics, Heidelberg University;Department of Physics and Astronomy, Heidelberg University;Heidelberg Center for the Environment, Heidelberg University10R. Saito合作论文数10
 Junjie Liu (刘俊杰)合作论文数中国科学院大学东北地理与农业生态研究所9
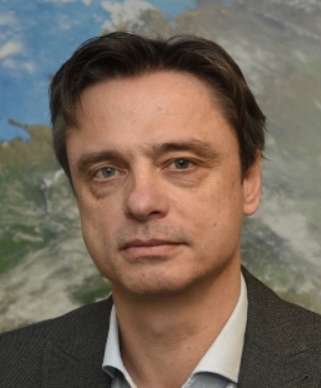 Hartmut Bösch合作论文数Institute for Environmental Physics, FB1, University of Bremen9Hidekazu Matsueda合作论文数9R Janardanan Achari合作论文数8
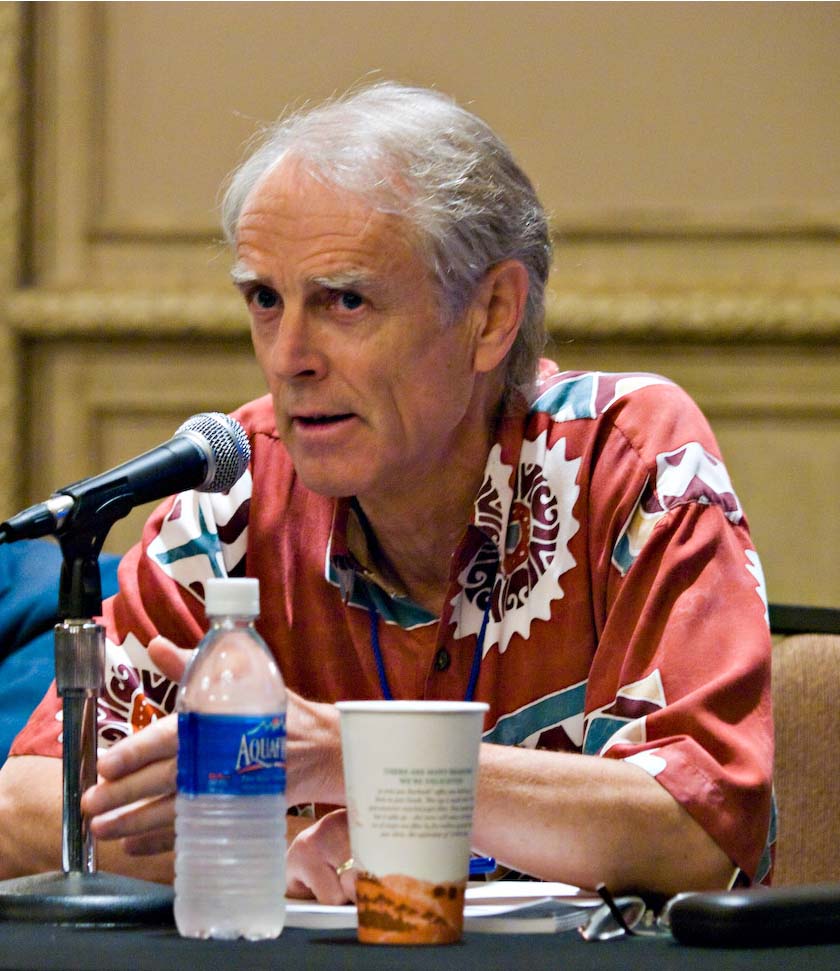 Pieter Tans合作论文数Global Monitoring Laboratory, National Oceanic & Atmospheric Administration;Institute of Arctic and Alpine Research, University of Colorado Boulder8
 Kei Shiomi合作论文数8
 Vitaliy Kinakh合作论文数Dept Comp Sci, Univ Geneva7
 Andrew Jacobson合作论文数Department of Earth and Planetary Sciences, Weinberg College of Arts and Sciences, Northwestern University7




