The chemistry of the global ocean is rapidly changing due to the uptake of anthropogenic carbon dioxide (CO2). This process, commonly referred to as ocean acidification (OA), is negatively impacting many marine species and ecosystems. In this study, we combine observations in the global surface ocean collected by NOAA Pacific Marine Environmental Laboratory and Atlantic Oceanographic and Meteorological Laboratory scientists and their national and international colleagues over the past four decades, along with model outputs, to provide a high-resolution, regionally varying view of global surface ocean carbon dioxide fugacity, carbonate ion content, total hydrogen ion content, pH on total scale, and aragonite and calcite saturation states on selected time intervals from 1961 to 2020. We discuss the major roles played by air-sea anthropogenic CO2 uptake, warming, local upwelling processes, and declining buffer capacity in controlling the spatial and temporal variability of these parameters. These changes are occurring rapidly in regions that would normally be considered OA refugia, thus threatening the protection that these regions provide for stocks of sensitive species and increasing the potential for expanding biological impacts.
Accurate assessment of anthropogenic carbon dioxide (CO2) emissions and their redistribution among the atmosphere, ocean, and terrestrial biosphere – the global carbon budget – is important to better understand the global carbon cycle, support the development of climate policies, and project future climate change. Here we describe data sets and methodology to quantify the five major components of the global carbon budget and their uncertainties. CO2 emissions from fossil fuels and industry (EFF) are based on energy statistics and cement production data, respectively, while emissions from land-use change (ELUC), mainly deforestation, are based on land-cover change data and bookkeeping models. The global atmospheric CO2 concentration is measured directly and its rate of growth (GATM) is computed from the annual changes in concentration. The ocean CO2 sink (SOCEAN) and terrestrial CO2 sink (SLAND) are estimated with global process models constrained by observations. The resulting carbon budget imbalance (BIM), the difference between the estimated total emissions and the estimated changes in the atmosphere, ocean, and terrestrial biosphere, is a measure of imperfect data and understanding of the contemporary carbon cycle. All uncertainties are reported as ±1σ. For the last decade available (2007–2016), EFF was 9.4 ± 0.5 GtC yr−1, ELUC 1.3 ± 0.7 GtC yr−1, GATM 4.7 ± 0.1 GtC yr−1, SOCEAN 2.4 ± 0.5 GtC yr−1, and SLAND 3.0 ± 0.8 GtC yr−1, with a budget imbalance BIM of 0.6 GtC yr−1 indicating overestimated emissions and/or underestimated sinks. For year 2016 alone, the growth in EFF was approximately zero and emissions remained at 9.9 ± 0.5 GtC yr−1. Also for 2016, ELUC was 1.3 ± 0.7 GtC yr−1, GATM was 6.1 ± 0.2 GtC yr−1, SOCEAN was 2.6 ± 0.5 GtC yr−1, and SLAND was 2.7 ± 1.0 GtC yr−1, with a small BIM of −0.3 GtC. GATM continued to be higher in 2016 compared to the past decade (2007–2016), reflecting in part the high fossil emissions and the small SLAND consistent with El Niño conditions. The global atmospheric CO2 concentration reached 402.8 ± 0.1 ppm averaged over 2016. For 2017, preliminary data for the first 6–9 months indicate a renewed growth in EFF of +2.0 % (range of 0.8 to 3.0 %) based on national emissions projections for China, USA, and India, and projections of gross domestic product (GDP) corrected for recent changes in the carbon intensity of the economy for the rest of the world. This living data update documents changes in the methods and data sets used in this new global carbon budget compared with previous publications of this data set (Le Quéré et al., 2016, 2015b, a, 2014, 2013). All results presented here can be downloaded from https://doi.org/10.18160/GCP-2017 (GCP, 2017).
Editor’s note: For easy download the posted pdf of the State of the Climate for 2016 is a very low-resolution file. A high-resolution copy of the report is available by clicking here. Please be patient as it may take a few minutes for the high-resolution file to download.
The Surface Ocean CO₂ Atlas (SOCAT, www.socat.info) is a synthesis activity by the international marine carbon community (>100 contributors) with support from SOLAS, IMBER, IOCCP, IOC and (inter-)national agencies. SOCAT brings together quality-controlled fCO₂ (fugacity of carbon dioxide) values for the global surface oceans and coastal seas with regular updates. Version 3 of SOCAT has 14.5 million surface water fCO₂ values for the years 1957 to 2014 with more than 1.0 million fCO₂ values per year for 2006 to 2012. SOCAT now accepts well-calibrated, good quality fCO₂ measurements from alternative sensors and platforms. Dataset flags reflect the accuracy of surface water fCO₂ values, ranging from better than 2 micro-atm (for the highest quality data) to better than 10 micro-atm (for alternative sensors). Automation of data upload is now enabling annual SOCAT releases from version 4 onwards. The interactive Data Set Viewer allows effective interrogation of the SOCAT data collection and rapid creation of high-quality figures for scientific presentations. Users of SOCAT data products are urged to acknowledge the contribution of data providers, as stated in the SOCAT Fair Data Use Statement. SOCAT version 4 is planned to be made public in early September 2016, and we'll highlight its updates above version 3 including observations to end of 2014. We will also present scientific applications of SOCAT including quantification of the ocean carbon sink and its long-term variation, detection of ocean acidification, as well as evaluation of coupled-climate and ocean-only biogeochemical models. SOCAT represents a milestone in coordinating international researchers, for the delivery of publically accessible and uniformly quality-controlled datasets, for marine and global carbon research and for informing government climate policy.
High-resolution data collected from several programs have greatly increased the spatiotemporal resolution of pCO(2)(sw) data in the Bering Sea, and provided the first autumn and winter observations. Using data from 2008 to 2012, monthly climatologies of sea-air CO2 fluxes for the Bering Sea shelf area from April to December were calculated, and contributions of physical and biological processes to observed monthly sea-air pCO(2) gradients (pCO(2)) were investigated. Net efflux of CO2 was observed during November, December, and April, despite the impact of sea surface cooling on pCO(2). Although the Bering Sea was believed to be a moderate to strong atmospheric CO2 sink, we found that autumn and winter CO2 effluxes balanced 65% of spring and summer CO2 uptake. Ice cover reduced sea-air CO2 fluxes in December, April, and May. Our estimate for ice-cover corrected fluxes suggests the mechanical inhibition of CO2 flux by sea-ice cover has only a small impact on the annual scale (<2%). An important data gap still exists for January to March, the period of peak ice cover and the highest expected retardation of the fluxes. By interpolating between December and April using assumptions of the described autumn and winter conditions, we estimate the Bering Sea shelf area is an annual CO2 sink of approximate to 6.8 Tg C yr(-1). With changing climate, we expect warming sea surface temperatures, reduced ice cover, and greater wind speeds with enhanced gas exchange to decrease the size of this CO2 sink by augmenting conditions favorable for greater wintertime outgassing.
Biological productivity is a key factor controlling the ocean's ability to take up carbon dioxide from the atmosphere. However, the ecological dynamics that drive regions of intense productivity and carbon export are poorly understood. In this study, we present high-spatial-resolution estimates of air-sea CO2 flux, net community production (NCP) rates calculated from O-2/Ar ratios, and phytoplankton population abundances determined by continuous underway measurements on a cruise across the Gulf of Alaska in May 2010. The highest rates of NCP (24940 mmol C m(-2) d(-1)) and oceanic CO2 uptake (air-sea flux of -42.36.1 mmol C m(-2) d(-1)) were observed across a transition zone between the high-nitrate low-chlorophyll (HNLC) waters of the Alaskan Gyre and the coastal waters off the Aleutian Islands. While the transition zone comprises 20% of the total area covered in crossing the Gulf of Alaska, it contributed 58% of the total NCP and 67% of the total CO2 uptake observed along the cruise track. A corresponding transition zone phytoplankton bloom was dominated by two small-celled (<20 mu m) phytoplankton communities, which were distinct from the phytoplankton communities in the surrounding Alaskan Gyre and coastal waters. We hypothesize that mixing between iron-rich coastal waters and iron-limited Alaskan Gyre waters stimulated this bloom and fueled the high NCP and CO2 export observed in the region.
In order to facilitate the collection of high quality and uniform surface water pCO2 data, an underway pCO2 instrument has been designed based on community input and is now commercially available. Along with instrumentation, agreements were reached on data reduction and quality control that can be easily applied to data from these systems by using custom-made freeware. This new automated underway pCO2 measuring system is designed to be accurate to within 0.1μatm for atmospheric pCO2 measurements and to within 2μatm for seawater pCO2, targeted by the scientific community to constrain the regional air–sea CO2 fluxes to 0.2PgCyear−1. The procedure to properly reduce the underway pCO2 data and perform the steps necessary for calculation of the fugacity of CO2 from the measurements is described. This system is now widely used by the scientific community on many different types of ships. Combined with the recommended data-reduction procedures, it will facilitate producing data sets that will significantly decrease the uncertainty currently present in estimates of air–sea CO2 fluxes.
We have developed a new temperature-controlled, automated underway system for making atmospheric and surface ocean pCO2 measurements onboard research ships equipped with an uncontaminated seawater intake system. Uncontaminated seawater is supplied to a showerhead plexiglass equilibrator. After about 3min, the air trapped in the equilibrator is equilibrated with seawater. This air is sampled six times per hour. In addition, atmospheric air is sampled three times per hour from the intake on the bow flagstaff through 3/8in. DekabonTM tubing to the underway system.
Extensive measurements of CO2 fugacity in the North Pacific surface ocean and overlying atmosphere during the years 1985-1989 are synthesized and interpreted to yield a basin-wide estimate of Delta fCO(2). The observations, taken from February through early September, suggest that the subtropical and subarctic North Pacific is a small sink for atmospheric CO2 (0.07 to 0.2 Gton C (half year)(-1) for the region north of 15 degrees N). Objective analysis techniques are used to estimate uncertainty fields resulting from constructing basin-wide contours of oceanic fCO(2) on the basis of individual cruise transects. The uncertainties are significant and imply that future sampling programs need to recognize that estimating oceanic uptake of anthropogenic CO2 from ship-transect observations of oceanic fCO(2) alone will require very extensive sampling.
Extensive measurements of CO 2 fugacity in the North Pacific surface ocean and overlying atmosphere during the years 1985-1989 are synthesized and interpreted to yield a basin-wide estimate of AfCO 2. The observations, taken from February through early September, suggest that the subtropical and subarctic North Pacific is a small sink for atmospheric CO 2 (0.07 to 0.2 Gton C (half year) - for the region north of 15 øN). Objective analysis techniques are used to estimate uncertainty fields resulting from constructing basin- wide contours of oceanic fCO 2 on the basis of individual cruise transects. The uncertainties are significant and imply that future sampling programs need to recognize that estimating oceanic uptake of anthropogenic CO 2 from ship-transect observations of oceanic fCO 2 alone will require very extensive sampling.
 Richard A. Feely合作论文数Pacific Marine Environmental Laboratory, National Oceanic and Atmospheric Administration;Department of Oceanography, University of Washington22
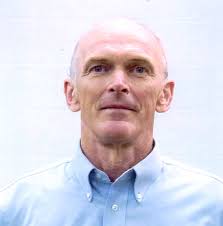 Richard (Rik) Wanninkhof合作论文数NOAA's Atlantic Oceanographic and Meteorological Laboratory, U.S. Department of Commerce11
 Simone R. Alin合作论文数Oceanography, University of Washington10
 Yukihiro Nojiri合作论文数National Institute for Environmental Studies7
 B. Pfeil合作论文数Sektion Physik der Universität München Theresienstrasse 37 D-8000 Munich 2 Germany Theresienstrasse 37 D-8000 Munich 2 Germany7
 Nicolas Metzl合作论文数7
 Dorothee C. E. Bakker合作论文数Centre for Ocean and Atmospheric Sciences, School of Environmental Sciences, Faculty of Science, University of East Anglia7
 Bronte Tilbrook合作论文数Antarctic Climate and Ecosystems Cooperative Research Centre;Commonwealth Scientific and Industrial Research Organisation7A. Kozyr合作论文数6
 Kim I. Currie合作论文数6
 Denis Pierrot合作论文数Rosenstiel School of Marine and Atmospheric Science, University of Miami6
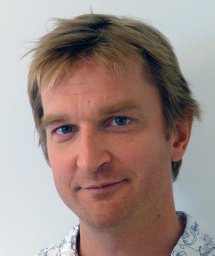 Are Olsen合作论文数Geophysical Institute, University of Bergen6Jeremy T. Mathis合作论文数School of Fisheries and Ocean Sciences, University of Alaska Fairbanks6
 Burke Hales合作论文数College of Earth, Ocean, and Atmospheric Sciences, Oregon State University;Dakunalytics, LLC.6Kevin Sullivan合作论文数5Maciej Telszewski合作论文数5
 Peter Landschutzer合作论文数Max Planck Inst Meteorol, Hamburg, Germany5
 Tobias Steinhoff合作论文数GEOMAR Helmholtz Centre for Ocean Research Kiel5
 S. M. A. C. (Steven) Van Heuven合作论文数Centre for Isotope Research, Faculty of Science and Engineering, University of Groningen5Ute Schuster合作论文数5
 Wiley Evans合作论文数College of Oceanic and Atmospheric Sciences, Oregon State University5
 Siv K. Lauvset合作论文数5
 Jan Marinus Hoppema合作论文数Helmholtz Centre for Polar and Marine Research, Alfred Wegener Institute;Department Physical Oceanography of Polar Seas, Alfred Wegener Institute;University of Applied Sciences Bremerhaven5
 Ingunn Skjelvan合作论文数5
 Kortzinger Arne合作论文数Leibniz Institute of Marine Sciences5Nathalie Lefevre合作论文数Institut de Statistique, Université Catholique de Louvain5A. Manke合作论文数4B. Huss合作论文数4R.D. CASTLE,合作论文数4Chisato Wada合作论文数4
 Christopher Hunt合作论文数4s hankin合作论文数4
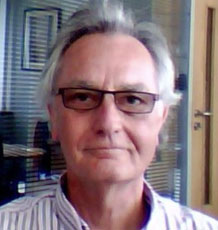 Andrew Watson合作论文数College of Life and Environmental Sciences, University of Exeter4
 Francisco P. Chavez合作论文数Monterey Bay Aquarium Research Institute4
 Tsuneo Ono合作论文数4
 Rainer Schlitzer合作论文数Fachbereich Geowissenschaften, Universitat Bremen;Helmholtz-Zentrum Fur Polar- Und Meeresforschung, Alfred-Wegener-Institut4
 Sarma VVSS合作论文数Regional Centre, CSIR, National Institute of Oceanography4
 Penny Vlahos合作论文数Department of Marine Sciences, University of Connecticut4
 Adrienne J. Sutton合作论文数Horn Point Laboratory, University of Maryland Center for Environmental Science4
 Abdirahman M. Omar合作论文数University of Bergen, University of Bergen4
 Aida F. Rios合作论文数4Hein de Baar合作论文数University of Groningen;Department of Biological Oceanography, Royal Netherlands Institute for Sea Research4Leticia Barbero合作论文数Laboratoire d'Océanographie et du Climat: Expérimentations et approches numériques, UPMC4
 Sara Jutterström合作论文数IVL Swedish Environmental Research Institute4
 Jerry Tjiputra合作论文数Division of Climate & Environment, Norce;Bjerknes Centre for Climate Research4
 Doug Vandemark合作论文数4Nobuo Tsurushima合作论文数4
 Melissa Chierici合作论文数Institute of Ocean Sciences, Centre for Ocean Climate Chemistry, P.O. Box 6000, 9860 West Saanich Road, Sidney, British Columbia, Canada V8L 4B24Liliane Merlivat合作论文数Sorbonne Université-CNRS-IRD-MNHN4




