Three criteria (y, to Y3) have been compared for assaying vitamin K activity from the prothrombin time (y') in seconds of blood plasma when the vitamin was mixed in the feed at different dosage levels and fed to groups of chicks. For a response criterion plotting linearly against the log dose, y, = log y' was not acceptable, but both Y2 = 10/y' and y3 = log(y' y') met assay requirements. In a comparison of two provisional estimates of the threshold y', the next-to-shortest observed prothrombin time among the treated chicks, less 1.0 second, proved simpler than a tolerance limit from positive controls. Either estimate could be adjusted to zero quadratic curvature and then used as a provisional estimate to be determined definitively by maximum likelihood.
Journal Article The Precision Of Microbial Assays With Special Reference To Vitamin B12 Get access C I Bliss C I Bliss The Connecticut Agricultural Experiment Station and Yale University, New Haven, Conn Search for other works by this author on: Oxford Academic Google Scholar Journal of Association of Official Agricultural Chemists, Volume 39, Issue 3, 1 August 1956, Pages 816–834, https://doi.org/10.1093/jaoac/39.3.816 Published: 07 February 2020
An experiment for determining how much of one preparation, the Unknown, is needed to produce the same reaction in living material as a stated amount of a second preparation, the Standard, is known as a bioassay. Bioassays may be divided experimentally into two types, (1) those where the dependent variable is a threshold dose measured directly in each test animal, and (2) those where the dependent variable is the size of the reaction to dosages fixed by the experimenter. In the few assays of the first type, each threshold dose can be transformed to its logarithm and the log-relative potency (M') computed either as the difference between two mean log-doses, or as a mean difference. Both have confidence intervals that are well-known and simple. In the many assays of the second type, the difference in the response to the two preparations must be converted to units of dose. If the response plots linearly against the log-dose, the difference between the two mean responses is divided by the common slope of the log-dose response curves for the Standard and for the Unknown to obtain M'. If the response gives a straight line with arithmetic dosage units, potency is computed instead from the ratio of the slope for the Standard and that for the Unknown. In either case, the log-potency or potency depends upon the ratio of two statistics. The confidence limits for a ratio are more complex than those for a difference. In the form proposed by Marks (Fieller [1944]) for balanced crossover assays, and applied later by Gridgeman [1951] to other factorial assays, the confidence or fiducial limits of a ratio are not difficult to compute. With little loss in simplicity, Marks' equation can be extended to all assays based upon the ratio of two statistics, and accordingly it has been adopted in U.S.P. XV [1955]. The purpose of this paper is to review the general equation and consider some of its extensions in sufficient detail to facilitate their understanding and use by the practising bioassayer who is not a professional statistician or biometrician. Since the calculation of each U.S.P. assay, including its confidence interval has been illustrated elsewhere (Bliss [1956a]), the numerical examples are restricted here primarily to non-official assays.
Journal Article A REJECTION CRITERION BASED UPON THE RANGE Get access C. I. BLISS, C. I. BLISS ‡‡ From The Connecticut Agricultural Experiment Station and Yale University, Johns Hopkins University, and Princeton University, respectively. Search for other works by this author on: Oxford Academic Google Scholar W. G. COCHRAN, W. G. COCHRAN ‡‡ From The Connecticut Agricultural Experiment Station and Yale University, Johns Hopkins University, and Princeton University, respectively. Search for other works by this author on: Oxford Academic Google Scholar J. W. TUKEY J. W. TUKEY ‡‡ From The Connecticut Agricultural Experiment Station and Yale University, Johns Hopkins University, and Princeton University, respectively. Search for other works by this author on: Oxford Academic Google Scholar Biometrika, Volume 43, Issue 3-4, December 1956, Pages 418–422, https://doi.org/10.1093/biomet/43.3-4.418 Published: 01 December 1956
Experiments on consumer preference have taken many forms. In that known as "paired comparisons", the several treatments or stimuli are compared in pairs, each treatment appearing with every other treatment in the same pair. It is an especially appropriate design for testing the effect upon a food of chemically different pesticides. These may produce qualitative differences in flavor which the subject finds easier to compare in pairs. Usually he is asked to report a simple preference for one of the two samples in each pair. Scheffe [1952] has extended this procedure by asking each subject to note the degree of his preference within each pair as well as its direction. A recent experiment of this type concerned the relative palatability of apples sprayed with two different insecticides and with two different fungicides in a 2 X 2 factorial design. In its analysis, several statistical methods were to be compared in respect to their sensitivity, consistency and computational requirements. Among them were the Mosteller [1951a,b] modification of the original proposal by Thurstone, the Bradley-Terry [1952a,b; 1953] analysis, and the Scheffe [1952] technique. In the course of the study, a new approach was developed which shows particular promise. It is based upon the mean normal deviate, tabled by Fisher and Yates [1953] and called the "rankit" by Ipsen and Jerne [1944]. It answered several questions which we could not otherwise resolve so readily, if at all. We will describe this rankit analysis in its present application and compare it with alternative procedures. The experiment had several objectives. One was to arrange the treatments on a linear scale, spaced so as to reflect the average degree of preference expressed by the tasters. Criteria were needed for judging the significance on this scale of effects associated with factorial combinations of the individual treatments. The scale had to be validated by a test of its additivity or subtractivity. If, for example, B was preferred to
1. An analysis of measurements on the threshold dose of digitoxin in human subjects shows no more tolerance to the drug in children than in adults. Any appearance of greater sensitivity in adults is due to adjusting differences in size by proportioning the dose directly to the body weight. 2. The threshold dose increases approximately as the square root of the body weight in both males and females. The dose can be predicted in this simple form because height and age are themselves without effect. 3. In this study, males proved to be somewhat more tolerant than females, requiring on the average 27 per cent more digitoxin.
In studying the occurrence of plants and animals in nature, the number of individuals may be counted in each of many equal units of space or time. The original counts can be summarized in a frequency distribution, showing the number of units containing x = 0, 1, 2, 3, ... individuals of a given species. If every unit in the series were exposed equally to the chance of containing the organism, the distribution would follow the Poisson series, each unit having the population mean as its expected frequency. It is easy to test whether the variation in the number of individuals per unit agrees with this hypothesis. Since the expected variance of a Poisson distribution is equal to its mean, the observed variance s2, multiplied by the degrees of freedom n, may be divided by the sample mean x to obtain x2 = ns2/x. More often than not x2 is significantly larger than its expectation, not only in distributions of plants and animals in nature but even in the laboratory. A number of distributions have been devised for series in which the variance is significantly larger than the mean (2, 11, 21), frequently on the basis of more or less complex biological models. In the present paper this characteristic will be called "over dispersion". Perhaps the first of these was the negative binomial, which arose in deriving the Poisson series from the point binomial (27, 32) although it had been formulated in 1714 (2). Comparisons of expected and observed distributions have shown its wide applicability to biological data. The relative ea-se with which the negative binomial can be computed and
This paper discusses the extension of the discriminant function to the case where certain variates (called the covariance variates) are known to have the same means in all populations. Although such variates have no discriminating power by themselves, they may still be utilized in the discriminant function. The first step is to adjust the discriminators by means of their `within-sample' regressions on the covariance variates. The discriminant function is then calculated in the usual way from these adjusted variates. The standard tests of significance for the discriminant function (e.g. Hotelling's $T^2$ test) can be extended to this case without difficulty. A measure is suggested of the gain in information due to covariance and the computations are illustrated by a numerical example. The discussion is confined to the case where only a single function of the population means is being investigated.
 Bm Broadbent合作论文数2mary l greenwood合作论文数2Aw Cressman合作论文数2Dj Finney合作论文数2
 William G. Cochran合作论文数Harvard University2P Griminger合作论文数1Eb Robbins合作论文数1Fraserro.Ja合作论文数1
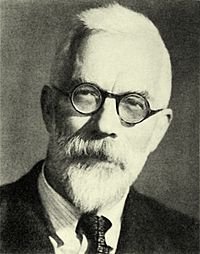 R Fisher合作论文数Dept Radiol, Houston Methodist Res Inst1
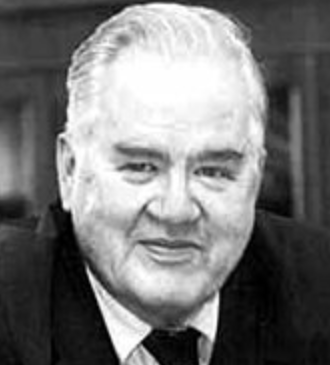 John Tukey合作论文数Princeton University1K. K. Chen合作论文数1O. Garth Fitzhugh合作论文数1Arthur A. Nelson合作论文数1




