We present results from a Very Large Methane Release (VLMR) experiment evaluating methane retrievals from the Geostationary Operational Environmental Satellites (GOES) Advanced Baseline Imagers (ABIs) and multiple low-Earth-orbit imagers with high point-source detection limits. The experiment coordinated observations of a U.S. gas pipeline blowdown with nine satellites, two aircraft, and a truck-based mobile laboratory. We used the GOES-16, -18, and -19 ABIs with revisits every 10 min to 7 s to quantify release magnitude and uncertainty. Best methane retrieval precision (7–8%) was achieved in the 7-s and 30-s mesoscale scan modes averaged to 5 min. Source-rate and mass estimates are broadly consistent across measurement platforms. Detectable emissions totaled 370±30 t over 44–65 min from two release points, ~25% lower than bottom-up expectations based on pipeline volume and nominal pressure, likely due to late-stage emissions below satellite detection limits. Our work provides a framework for evaluating high-detection-limit methane point-source imagers.
The coronavirus disease 2019 (COVID-19) pandemic disrupted normal human activities worldwide, and mobility reductions resulted in reduced levels of air pollutants and greenhouse gases emissions. Here, we examine the impact of these disruptions on a potent greenhouse gas, methane (CH4), over the U.S. In this study, we quantified CH4 emissions from the contiguous U.S. between 2019 and 2021 by analyzing inverse modeling results derived from atmospheric measurements made at 35 sites across the country. Our estimates indicate emission reductions of -2.5 (+/- 0.43) Tg year-1 CH4 in 2020 and -2.9 (+/- 1.63) Tg year-1 in 2021, relative to 2019. The respective percentage change was a -4.3 (-5.1 to -3.5) % reduction in 2020 and -4.8 (-8.3 to -0.7) % in 2021, relative to 2019. Combining with process-based inventory emission datasets, we found that this reduction was primarily due to decreased fossil fuel and agricultural emissions; however, record-breaking forest fires resulted in an increase of 0.4 (0.1 to 0.8) Tg year-1 in 2020-2019, equal to a 20 (3 to 46) % increase in CH4 emissions from the western U.S.
Robust information on the spatial distribution of global carbon fluxes is required to project the future trajectory of carbon-climate feedback effects and atmospheric CO2 concentrations. Estimates of the latitudinal partitioning of carbon fluxes from top-down atmospheric CO2 inverse models currently diverge widely, because of methodological limitations or systematic biases in models or observations. We use airborne CO2 observations from the NASA Atmospheric Tomography Mission to evaluate and refine inverse model estimates from the Orbiting Carbon Observatory version 10 Model Intercomparison Project of total CO2 exchange for the two-year period of June 2016-May 2018. Applying emergent concentration-flux relationships as constraints reduces zonal total flux uncertainties by 46 to 56% relative to the full v10 MIP ensemble and by 17 to 28% relative to the subset excluding satellite observations over ocean. Subtracting independent estimates of fossil-fuel emissions and air-sea gas exchange results in residual land fluxes with a large northern extratropical sink, a small southern extratropical sink, and a small tropical source. The airborne-derived tropical land source disagrees with a large tropical land sink from process-based terrestrial models combined with estimates of land use emissions and river fluxes, representing an important challenge for our understanding of the global carbon cycle. The large implied northern extratropical sink can be explained either by underestimated land uptake by process models or a combination of process model bias and overestimated fossil fuel emissions.
Accurate assessment of anthropogenic carbon dioxide (CO2) emissions and their redistribution among the atmosphere, ocean, and terrestrial biosphere in a changing climate is critical to better understand the global carbon cycle, support the development of climate policies, and project future climate change. Here we describe and synthesise datasets and methodologies to quantify the five major components of the global carbon budget and their uncertainties. Fossil CO2 emissions (E-FOS) are based on energy and cement production data. Emissions from land-use change (E-LUC) are estimated by bookkeeping models based on land-use data. The global atmospheric CO2 growth rate (G(ATM)) is computed from changes in concentration measured at surface stations. The global net uptake of CO2 by the ocean (S-OCEAN) is estimated with global ocean biogeochemistry models and observation-based fCO(2)-products. The global net uptake of CO2 by the land (S-LAND) is estimated with dynamic global vegetation models. Additional lines of evidence are provided by atmospheric inversions, atmospheric oxygen measurements, ocean interior observation-based estimates, and Earth System Models. This year, we introduced corrections on the E-LUC, S-OCEAN and S-LAND estimates. The sum of all sources and sinks results in the carbon budget imbalance (B-IM), a measure of imperfect data and incomplete understanding of the contemporary carbon cycle. All uncertainties are reported as +/- 1 sigma. For the year 2024, E-FOS increased by 1.1 % relative to 2023, with fossil emissions at 10.3 +/- 0.5 GtC yr(-1) (including the cement carbonation sink, 0.2 GtC yr(-1)), E-LUC was 1.3 +/- 0.7 GtC yr(-1), for total anthropogenic CO2 emissions of 11.6 +/- 0.9 GtC yr(-1) (42.4 +/- 3.2 GtCO(2) yr(-1)). Also, for 2024, G(ATM) was 7.9 +/- 0.2 GtC yr(-1) (3.73 +/- 0.1 ppm yr(-1)), 2.2 GtC above the 2023 growth rate. S-OCEAN was 3.4 +/- 0.4 GtC yr(-1) and S-LAND was 1.9 +/- 1.1 GtC yr(-1), leaving a large negative B-IM (-1.7 GtC yr(-1)), suggesting that the total sink or G(ATM) is strongly overestimated in 2024. The global atmospheric CO2 concentration averaged over 2024 reached 422.8 +/- 0.1 ppm. Preliminary data for 2025 suggest an increase in E-FOS relative to 2024 of +1.0 % (0.2 % to 1.7 %) globally, and atmospheric CO2 concentration increasing by 2.1 ppm reaching 425.6 ppm, 53 % above the pre-industrial level (around 278 ppm in 1750). Overall, the mean and trend in the components of the global carbon budget are consistently estimated over the period 1959-2024, with a near-zero overall budget imbalance, although discrepancies of up to around 1 GtC yr(-1) persist for the representation of annual to decadal variability in CO2 fluxes. Comparison of estimates from multiple approaches and observations shows: (1) a persistent large uncertainty in the estimate of land-use change emissions, (2) a low agreement between the different methods on the magnitude of the land CO2 flux in the northern extra-tropics, and (3) a discrepancy between the different methods on the mean ocean sink.
Abstract. Achieving net-zero emissions over the coming decades requires unprecedented reductions in anthropogenic emissions of greenhouse gases (GHGs) complemented by a rapid ramp-up in the magnitude of global carbon dioxide removal (CDR). The carbon credit market (CCM) is emerging as a means to finance both emissions reductions and carbon dioxide removal from the atmosphere. To achieve necessary growth on these fronts, the total scope and diversity of projects that are candidates for inclusion in the CCM must expand, necessitating a means of comprehensively assessing the quality of carbon credit projects (CCPs) based on their ability to make quantifiable reductions to GHG concentrations in the atmosphere. Toward a comprehensive quality assessment, we propose a framework to assess and differentiate CCPs based on their estimated impact on atmospheric GHG composition. In parallel, we propose a path towards verification of the aggregated atmospheric impact of CCM actions, since a detectable and attributable signal in atmospheric GHG composition can be viewed as the clearest measure of their climate forcing and, therefore, effectiveness.
The atmospheric distribution and variability of CO2 result from the interplay of different processes and mechanisms. Although these trace gas patterns contain valuable information on mixing and transport at different timescales, the information is difficult to extract from observed or simulated mole fractions, particularly in the upper troposphere and lower stratosphere (UTLS), due to the combination of long-term increase and the seasonal cycle of CO2.Using a compilation of vertical trace gas profiles derived from measurements with the balloon-based AirCore technique together with ECHAM/MESSy Atmospheric Chemistry (EMAC) model data, we investigate how the seasonality of CO2 in the troposphere propagates into the lowermost stratosphere. Simulating an artificial, deseasonalised CO2 tracer enables us to separate and study the seasonal cycle in a unique way in remote areas and on a global scale. Our results show that the tropospheric CO2 seasonal cycle is strongly modulated in the extratropical UTLS region, characterised by a substantial change in amplitude, a phase shift of several months and a tilt in the shape of the seasonal cycle, which can be associated with the transport barrier related to the strength of the subtropical jet. In the stratosphere, we identified both a vertical and a horizontal “tape recorder” of the CO2 seasonal cycle. Originating in the tropical tropopause region this imprint is linked to the upwelling and the shallow branch of the Brewer-Dobson circulation.To validate these model-based findings we developed a strategy to isolate the seasonal signal in observational data as well. This requires CO2-independent Age of Air (AoA) information to disentangle seasonality from the combined effect of transport and long-term trend. To achieve this, we choose an approach using a normalised methane vs. mean age correlation based on independent observational data. We present average vertical profiles of the isolated CO2 seasonal signal for latitude bands with sufficient AirCore measurement coverage. Statistical analyses are then used to assess the robustness and representativeness of these results and to determine whether AirCore observations can be used to constrain the CO2 seasonality in the UTLS.
Increasing atmospheric CO2 seasonal cycle amplitudes in boreal regions have been attributed to climate-driven changes in land ecosystems, but terrestrial biosphere models (TBMs) are unable to replicate observations, leading to large uncertainties in future predictions of carbon cycle changes. Accurately partitioning net ecosystem exchange into its component fluxes-gross primary production (GPP) and respiration-is essential for understanding impacts of changing climate on the Arctic and boreal carbon balance, yet these component fluxes cannot be measured directly. Carbonyl sulfide (OCS) has been used to infer GPP at site to global scales, because its one-way uptake by plants is an analog for photosynthesis. However, expanding site-level process understanding to regional scales remains challenging. Here, we use atmospheric OCS mole fraction observations representative of Alaskan boreal forests to evaluate simulations of OCS fluxes in a state-of-the-science TBM. We use TBM-estimated OCS fluxes and surface influence functions on the order of 100-1000 km to simulate OCS mole fractions at the NOAA Global Monitoring Laboratory's CRV tower site in central Alaska. By comparing with atmospheric observations, we can evaluate the TBM over much larger scales than is possible using eddy covariance data while still providing valuable information about underlying mechanisms. Comparisons reveal a missing ecosystem sink corresponding to a concentration difference of 22.3 +/- 9.1 ppt OCS for July-November relative to observed concentrations of 433 +/- 26 ppt at CRV. Solely improving the temperature sensitivity of apparent mesophyll conductance reduces the July-November mismatch between modeled and observed OCS concentration data by similar to 5.3 +/- 2.7 ppt. Consideration of alternate land cover maps provides an additional similar to 5.3 +/- 3.0 ppt towards the mismatch. These results demonstrate a strong decoupling of OCS and GPP, especially after the end of the growing season. Our analyzes demonstrate the limitations of using OCS as a proxy for GPP and highlight potential missing processes that need to be incorporated into future OCS modeling efforts to maximize its potential as a photosynthetic tracer.
Urban centers concentrate high usage of halocarbons largely for refrigeration, air conditioning (A/C), heat pumps, and fire suppression. Loss of these gases to the atmosphere has a large climate impact. Here, we quantify halocarbon emissions from the New York City region during the East Coast Outflow airborne campaigns in 2018 and 2020. We quantify urban-scale emissions using discrete airborne flask samples collected during downwind plume sampling. We find that inventories of the urban region underestimate halocarbon emissions. For A/C species, higher emissions in 2018 correspond with higher temperatures, suggesting emissions may vary with appliance usage. The climate impact (100-year time horizon) of our observed halocarbon emissions is comparable to coincident methane emissions, equal to ∼10% of urban CO2 emissions. Without leakage mitigation and effective phase-down efforts, high halocarbon emissions could undercut the benefits of switching to heat pumps and present a positive warming feedback with increasing air conditioning demand.
The Brewer-Dobson circulation largely determines the distribution of key trace gases and aerosols in the stratosphere and is projected to accelerate under climate change in chemistry-climate models simulations. However, observational constraints based on the mean age of air have suggested weak increases, implying a possible slowdown of the circulation and a discrepancy from model projections. Here we examine changes in the strength of the Northern Hemisphere stratospheric circulation over 1993-2025 by reanalysing mean age of air from existing and new in situ measurements. We identify differences across sampling systems and apply improved data processing to produce a more reliable observational record. Our revised estimates show negative trends in Northern Hemisphere extratropical mean age-opposite in sign to most earlier studies-and indicative of an acceleration of the stratospheric circulation since the 1990s, in line with model expectations. However, the observed acceleration is stronger than simulated and exhibits a different vertical structure. These results reduce the apparent gap between observations and models but also point to remaining discrepancies, highlighting the need for improved measurement practices and refined model representations of stratospheric circulation.
The 14 C:C ratio in atmospheric CO 2 (expressed as Δ 14 C) is a powerful tracer of Earth system carbon cycle processes. In the 21st century, spatio‐temporal variations of atmospheric Δ 14 C are mainly the result of anthropogenic fossil CO 2 emissions, but the oceans and terrestrial biosphere also exert significant influence on its variations. Here we present a complete three‐dimensional representation of the impact of 14 CO 2 and CO 2 fluxes on atmospheric CO 2 and Δ 14 C for 2000 through 2012. We compare simulated atmospheric Δ 14 C with approximately 5,000 measurements from both the remote atmosphere and continental areas strongly influenced by fossil CO 2 emissions. These comparisons demonstrate that the spatio‐temporal characteristics of input surface fluxes developed in Part 1 of this study have high fidelity. Based on good model‐observation agreement, we used the model's ability to determine the relative contributions of fossil, oceanic, and terrestrial fluxes to simulated Δ 14 C to help explain the origin of the observed variations. During our study period, the pole‐to‐pole difference in atmospheric Δ 14 C increased, which our analysis indicates results from changes in both fossil and oceanic fluxes. Over the continents, we show that most short‐term variation of Δ 14 C in the PBL results from atmospheric mixing acting on fossil CO 2 fluxes. Overall, the validation of our simulations by comparison with observations demonstrates that we understand the processes affecting atmospheric Δ 14 C at a variety of spatial and temporal scales. This suggests that, especially with an expanded set of measurements, we can use Δ 14 C to better quantify and understand key carbon cycle processes, especially fossil CO 2 emissions.
The complex distribution of CO2 in the upper troposphere and lower stratosphere (UTLS) results from the interplay of different processes and mechanisms. However, in such difficult-to-access regions of the atmosphere our understanding of the CO2 variability remains limited. Using vertical trace gas profiles derived from measurements with the balloon-based AirCore technique for validation, we investigate the UTLS and stratospheric CO2 distribution simulated with the ECHAM/MESSy Atmospheric Chemistry (EMAC) global chemistry-climate model. By simulating an artificial, deseasonalised CO2 tracer, we disentangle the CO2 seasonal signal from long-term trend and transport contribution. This approach allows us to study the CO2 seasonal cycle in a unique way in remote areas and on a global scale. Our results show that the tropospheric CO2 seasonal cycle propagates upwards into the lowermost stratosphere and is most modulated in the extra-tropics between 300–100 hPa, characterised by a 50 % amplitude dampening and a 4-month phase shift in the Northern Hemisphere mid-latitudes. During this propagation the seasonal cycle shape is also tilted, which is associated with the transport barrier related to the strength of the subtropical jet. In the stratosphere, we identified both, a vertical and a horizontal “tape recorder” of the CO2 seasonal cycle. Originating in the tropical tropopause region this imprint is linked to the upwelling and the shallow branch of the Brewer-Dobson-circulation. As the CO2 seasonal signal carries information about transport processes on different timescales, the newly introduced tracer is a very useful diagnostic tool and would also be a suitable metric for model intercomparisons.
Processes occurring over the oceans, including greenhouse gas (GHG) fluxes and cloud-aerosol interactions, are a major source of uncertainty in the present climate state and hence in estimating near-term warming. To reduce this uncertainty, more comprehensive and specific observations over the oceans are needed. Due to the limited supply of dedicated research vessels, platforms of opportunity are essential to fill these observational gaps. We discuss here the Ships of Opportunity for Atmospheric Research (SOAR) program, a science infrastructure program built in collaboration with OceansX. SOAR’s purpose is to expand atmospheric observations in under-observed oceanic regions, providing new measurements to existing climate observation programs that provide open data to the global community. We present current pilot projects under SOAR. A GHG flask sampler from NOAA Global Monitoring Lab is deployed on the Maersk Kentucky, which is taking samples as the ship transits the tropical Pacific. Sensors from NASA’s Maritime Aerosol Network (AERONET MAN), are also deployed on two other Maersk vessels and a Smyril Line vessel, where volunteer sailors are collecting aerosol optical depth measurements that are now accessible on the AERONET/MAN webpage. Finally, in collaboration with NOAA Global Monitoring Laboratory, SilverLining is developing a version of the NOAA Federated Aerosol Network (NFAN) package for deployment on ships of opportunity. This effort includes integrating instruments into a system adapted to marine environments and validating it against the NFAN technical standards. This project serves as a proof of concept for including additional higher-complexity atmospheric instrumentation packages in ships of opportunity programs
For decades, our understanding of the carbon cycle has relied on a limited network of direct and remote sensing systems to measure atmospheric greenhouse gases (GHGs). This has allowed for a broad understanding of both natural and human-caused sources and sinks of GHGs. However, this network is inadequate to monitor the subtle emission changes resulting from climate change, mitigation efforts, and interventions. Moving forward, new technologies, combined with existing ones, will need to be enhanced through public-private partnerships to build a network capable of verifying GHG emissions and uptake from global to local scales. The recent collaboration between NOAA and United Airlines exemplifies the growing partnerships with the private sector to enhance GHG observation. By leveraging commercial aircraft flights, United Airlines is providing a platform that enables up to eight atmospheric profiles daily at a fraction (1%) of the cost of similar research aircraft. The low cost and increased frequency of these observations are further enhanced by the opportunity to sample large metropolitan areas frequently visited by mid-size aircraft like the Boeing 737. These profiles bridge the gap between ground-based direct measurements and satellite-based remote measurements, essential for monitoring GHG emissions across all scales. Enhancement ratios of methane to CO2 and CO captured by these profiles also enables a unique look at methane emissions for urban environments that have proven to be under estimated based on bottom up inventory estimate of emissons. This talk provides an overview and update of NOAA's effort to leverage commercial aircraft for GHG observation.
The COllaborative Carbon Column Observing Network has become a reliable source of high-quality ground-based remote sensing network data that provide column-averaged dry-air mole fractions of carbon dioxide (XCO2), methane (XCH4), and carbon monoxide (XCO). The fiducial reference measurements of these gases from the COCCON complement the TCCON and NDACC-IRWG data. This study shows the application of COCCON data for the validation of existing greenhouse gas satellite products. This study includes the validation of XCH4 and XCO products from the European Copernicus Sentinel-5 Precursor (S5P) mission, XCO2 products from the American Orbiting Carbon Observatory-2 (OCO-2) mission, and XCO2 and XCH4 products from the Japanese Greenhouse gases Observing SATellite (GOSAT). A total of 27 datasets contributed to this study; some of these were collected in the framework of campaign activities and covered only a short time period. In addition, several permanent stations provided long-term observations. The random uncertainties in the validation results, specifically for S5P with a lot of coincidences pairs, are found to be similar to the comparison with the TCCON. The comparison results of OCO-2 land nadir and land glint observation modes to the COCCON on a global scale, despite limited coincidences, are very promising. The stations can, therefore, expand on the coverage of the already existing ground-based reference remote sensing sites from the TCCON and the NDACC network. The COCCON data can be used for future satellite and model validation studies and carbon cycle studies.
Monthly global sea-air CO2 flux maps are created on a 1 degrees by 1 degrees grid from surface water fugacity of CO2 (fCO(2w)) observations using an extremely randomized trees (ET) machine learning technique (AOML-ET) over the period 1998-2020. Global patterns and magnitudes of fCO(2w) from AOML-ET are consistent with other machine learning methods and with the updated climatology of Takahashi et al. (2009, ). However, the magnitude and trends of sea-air CO2 fluxes are sensitive to the treatment of atmospheric forcing. In the default configuration of AOML-ET, the average global sea-air CO2 flux is -1.70 PgC yr(-1) with a negative trend of -0.89 +/- 0.19 PgC yr(-1) decade(-1). The large negative trend is driven by a small uptake at the beginning of the record. This leads to increasing sea-air fCO(2) gradients over time, particularly at high latitudes. However, changing the target variable in AOML-ET from fCO(2w) to sea-air CO2 fugacity difference, triangle fCO(2), results in a lower negative trend of -0.51 PgC yr(-1) decade(-1), though the average flux remains similar at -1.65 PgC yr(-1). This trend is close to the consensus trend of ocean uptake from machine learning and models in the Global Carbon Budget of -0.46 +/- 0.11 PgC yr(-1) decade(-1) switching to a gas transfer parameterization with weaker wind speed dependence reduces uptake by 60% but does not affect the trend. Substituting a spatially resolved marine air CO2 mole fraction product for the zonally invariant marine boundary layer CO2 product yields greater influx by up to 20% in the industrialized continental outflow regions.
Accurately quantifying regional anthropogenic CO2 fluxes is fundamental to improving our understanding of the carbon cycle and for creating effective carbon mitigation policies, and the radiocarbon to total carbon ratio in atmospheric CO2 (Delta 14CO2) is a robust tracer of fossil fuel CO2 that can discriminate between biogenic and fossil fuel CO2 sources. NASA's Atmospheric Carbon and Transport-America (ACT-America) airborne mission between 2016 and 2019 aimed to improve the accuracy of regional greenhouse gas flux estimates, through refining our understanding and characterization of fluxes and flux uncertainties in models. Delta 14CO2 observations from 26 flights are presented for examining seasonal CO2 source partitioning in the Mid-Atlantic USA. Observed variability in boundary layer CO2 at timescales ranging from intra-day to seasonal was largely driven by biogenic CO2 (CO2bio) variability that ranged from -19.7 ppm in summer to 16.2 ppm in fall, while fossil fuel CO2 (CO2ff) variability remained at 3.3 +/- 2.0 ppm. Carbonyl sulfide uptake was well-correlated with CO2bio uptake, and examining this relationship, as well as that between CO2 and CO2bio variability reinforces the seasonal extent of gross primary productivity response throughout ACT-America. We use airborne Delta 14CO2 flask sampling alongside in situ carbon monoxide measurements to calculate high-frequency CO2ff and evaluate the magnitude and diurnal variability of modeled CO2ff, deducing likely transport errors in an example flight. Although ACT-America CO2ff signals were attenuated due to the broad source regions sampled, results illustrate the value of Delta 14CO2 sampling and observation-based methodologies for regional CO2 flux attribution, evaluation and improvement of modeled CO2.
The 14C:C ratio in atmospheric CO2 (expressed as Delta 14C) is a powerful tracer of Earth system carbon cycle processes. In the 21st century, spatio-temporal variations of atmospheric Delta 14C are mainly the result of anthropogenic fossil CO2 emissions, but the oceans and terrestrial biosphere also exert significant influence on its variations. Here we present a complete three-dimensional representation of the impact of 14CO2 and CO2 fluxes on atmospheric CO2 and Delta 14C for 2000 through 2012. We compare simulated atmospheric Delta 14C with approximately 5,000 measurements from both the remote atmosphere and continental areas strongly influenced by fossil CO2 emissions. These comparisons demonstrate that the spatio-temporal characteristics of input surface fluxes developed in Part 1 of this study have high fidelity. Based on good model-observation agreement, we used the model's ability to determine the relative contributions of fossil, oceanic, and terrestrial fluxes to simulated Delta 14C to help explain the origin of the observed variations. During our study period, the pole-to-pole difference in atmospheric Delta 14C increased, which our analysis indicates results from changes in both fossil and oceanic fluxes. Over the continents, we show that most short-term variation of Delta 14C in the PBL results from atmospheric mixing acting on fossil CO2 fluxes. Overall, the validation of our simulations by comparison with observations demonstrates that we understand the processes affecting atmospheric Delta 14C at a variety of spatial and temporal scales. This suggests that, especially with an expanded set of measurements, we can use Delta 14C to better quantify and understand key carbon cycle processes, especially fossil CO2 emissions.
Trace gas patterns in the upper troposphere and lower stratosphere (UTLS) can provide valuable insights into the mechanisms and the interplay of processes controlling the distribution of these species. We use vertical greenhouse gas profiles derived from measurements with the balloon-based AirCore technique to obtain detailed information on the distribution of carbon dioxide (CO2), carbon monoxide (CO) and methane (CH4) in and around the polar UTLS region during the boreal summer. The analysis is based on new data from the ATMO-ACCESS campaign called OSTRICH (Observations of Stratospheric TRace gases Influencing Climate using High-altitude platforms), which took place in the summer of 2023 in Sodankylä, Finland. More than 30 vertical profile measurements over a ten-day period allow for study of short-term changes in composition, with the balloons covering an altitude range from the ground to >30 km. In addition, the results of the comparison between the six participating international AirCore groups (Universities of Groningen (The Netherlands), Bern (Switzerland), Frankfurt (Germany), Finnish Meteorological Institute, Forschungszentrum Jülich (Germany) and the National Oceanic and Atmospheric Administration (NOAA, US)) enable an evaluation of the measurements themselves. Due to the simultaneous sampling with different AirCores during each flight these results contribute to the assessment of AirCore data quality in general and the determination of uncertainties. Moreover, future technical improvements and adaptations in processing algorithms can be derived from this intercomparison. The measurements mostly agree quite well, confirming the quality of vertical trace gas distributions derived from the AirCore technique. It is however an essential task to pinpoint the reasons behind the deviations that were observed in some cases. Next to these differences within one flight we discuss the variability in the profiles between individual flights. Only at altitudes above the 80 hPa level do expected and remaining similar behaviours of CO2 and CH4 mole fractions appear. The measurements in lower parts of the atmosphere show large deviations from day-to-day during the campaign phase. These clear (short term) variations in trace gas composition show that a single vertical profile in many different layers of the atmosphere, such as the UTLS, is not necessarily representative. Balloon-borne sensors with higher spatial and temporal resolution can therefore help to better constrain trace gas variability across various altitude ranges.
 Anna Karion合作论文数Division of Engineering and Applied Sciences, California Institute of Technology160
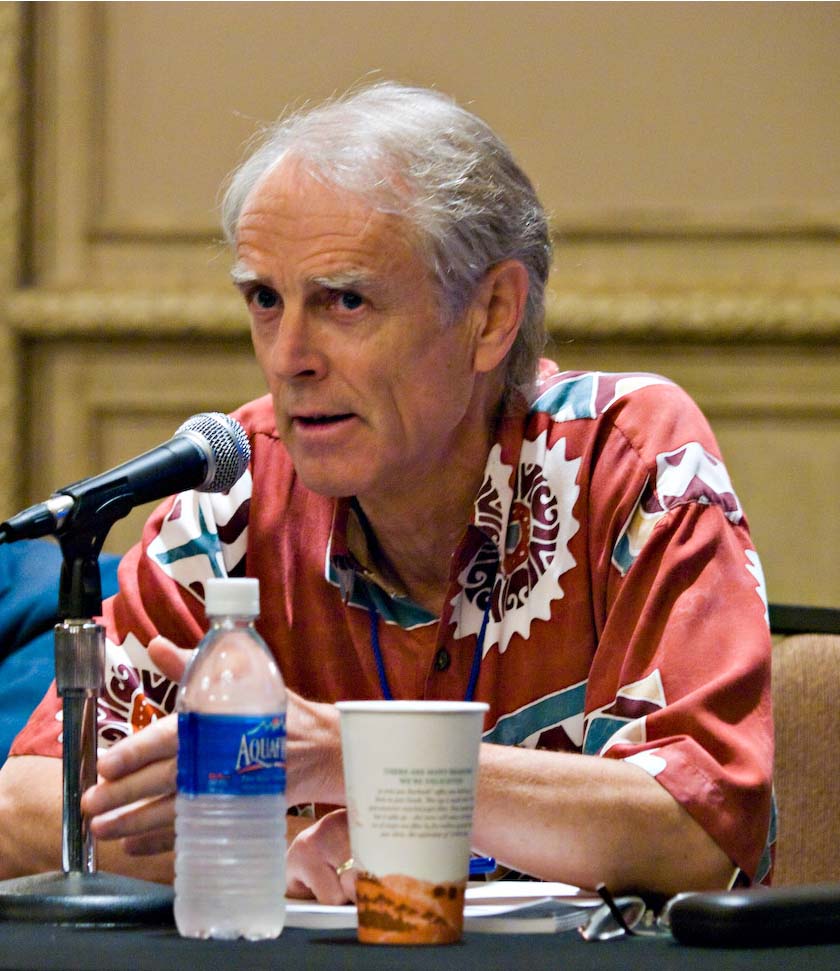 Pieter Tans合作论文数Global Monitoring Laboratory, National Oceanic & Atmospheric Administration;Institute of Arctic and Alpine Research, University of Colorado Boulder149
 Arlyn Andrews合作论文数Global Monitoring Laboratory, National Oceanic and Atmospheric Administration126
 Steven Wofsy合作论文数Department of Earth and Planetary Sciences, Harvard John A. Paulson School Of Engineering And Applied Sciences, Harvard University103
 Stephen Montzka合作论文数Global Monitoring Laboratory, National Oceanic and Atmospheric Administration92
 John B. Miller合作论文数Cooperative Institute for Research in Environmental Science, University of Colorado Boulder;Global Monitoring Laboratory, National Oceanic & Atmospheric Administration87
 Kathryn McKain合作论文数Department of Earth and Planetary Sciences, Harvard University;Department of Earth and Planetary Sciences, Harvard University86
 Eric A. Kort合作论文数College of Engineering Climate and Space Sciences and Engineering, University of Michigan79
 Thomas Lauvaux合作论文数Laboratoire des Sciences|du Climat et de l'Environnement78
 Kenneth Davis合作论文数Institute of Energy and the Environment, Pennsylvania State University;College of Earth and Mineral Sciences, Pennsylvania State University76
 Paul Shepson合作论文数Department of Earth, Atmospheric, and Planetary Sciences, Purdue University;School of Marine and Atmospheric Sciences, Stony Brook University65
 Róisín Commane合作论文数Department of Earth and Environmental Science, Lamont-Doherty Earth Observatory, Columbia University61
 Jocelyn Turnbull合作论文数GNS Science;University of Colorado at Boulder58
 Gabrielle Petron合作论文数51
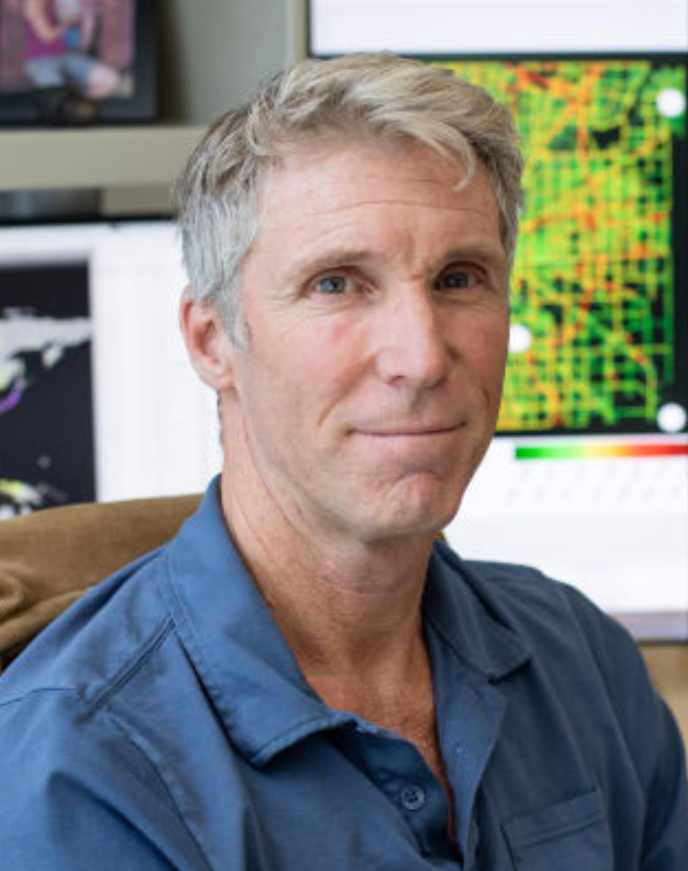 Kevin Gurney合作论文数School of Informatics, Computing and Cyber Systems, Northern Arizona University;Crosswalk Labs48
 Bianca C. Baier合作论文数Global Monitoring Lab, NOAA44
 Britton B. Stephens合作论文数Scripps Institution of Oceanography, University of California44
 Charles Miller合作论文数Jet Propulsion Laboratory, California Institute of Technology;Division of Geological and Planetary Sciences, California Institute of Technology43E. J. Dlugokencky合作论文数43
 Scott J. Richardson合作论文数Department of Meteorology and Atmospheric Science, College of Earth and Mineral Sciences, Penn State University41Bruce C Daube合作论文数39
 Sebastien Biraud合作论文数39
 Jeff Peischl合作论文数Chemical Sciences Laboratory, National Oceanic and Atmospheric Administration;Institute for Research in Environmental Sciences, University of Colorado Boulder38Edward J. Dlugokencky合作论文数35
 Paul Wennberg合作论文数Ronald and Maxine Linde Center for Global Environmental Science, California Institute of Technology;Laboratory for the Study of Atmospheric Composition, California Institute of Technology34
 Fred Lee Moore合作论文数Cooperative Institute for Research in Environmental Sciences, University of Colorado Boulder;Global Monitoring Laboratory, NOAA34Thomas Nehrkorn合作论文数33T. B. Ryerson合作论文数33
 Maria Obiminda L. Cambaliza合作论文数Department of Physics, Ateneo de Manila University;Air Quality Dynamics Laboratory, Manila Observatory32
 Benjamin Miller合作论文数School of Political Sciences, University of Haifa;Center for National Security Studies, University of Haifa32
 Scott J. Lehman合作论文数Laboratory for AMS Radiocarbon Preparation and Research, Institute of Arctic and Alpine Research, University of Colorado Boulder;Center for the Geochemical Analysis of the Global Environment, Institute of Arctic and Alpine Research, University of Colorado Boulder32N. Miles合作论文数31John M. Henderson合作论文数Atmospheric and Environmental Research, Inc.31
 David Munro合作论文数Earth Systems Program, Stanford University31
 Richard (Rik) Wanninkhof合作论文数NOAA's Atlantic Oceanographic and Meteorological Laboratory, U.S. Department of Commerce31L. Bruhwiler合作论文数31
 Taro Takahashi合作论文数Lamont-Doherty Earth Observatory, Columbia Climate School, Columbia University30
 Bradley D. Hall合作论文数Earth Syst Res Lab, NOAA30t newberger合作论文数29Marikate E. Mountain合作论文数29James R. Whetstone合作论文数29
 Natasha Miles合作论文数Department of Meteorology, The Pennsylvania State University27
 Anna M. Michalak合作论文数Department of Earth System Science, Stanford University26
 Richard A. Feely合作论文数Pacific Marine Environmental Laboratory, National Oceanic and Atmospheric Administration;Department of Oceanography, University of Washington26
 Joshua P. Digangi合作论文数26jonathan kofler合作论文数25
 Scot Miller合作论文数Department of Environmental Health and Engineering, Whiting School of Engineering, Johns Hopkins University25
 Rebecca S. Hornbrook合作论文数Atmospheric Chemistry Division, National Center for Atmospheric Research, Boulder, CO, USA25Lei Hu合作论文数25




