Remotely sensed land cover data can be a tremendous resource to land use decision makers, yet there is often a disconnect between the worlds of remote sensing and local government. The Connecticut’s Changing Landscape project is focused on bridging this gap. The project analyzes changes to the state’s landscape using Landsat-derived 30-m land cover and cross-correlation analysis. It includes seven dates spanning 30 years, from 1985 to 2015. During this period an additional 4.7 percent of the state was converted to development-related land covers, with corresponding losses to forest and agricultural land. New development was for the most part in attenuated patterns rather than concentrated near existing developed areas. Additional land cover analyses were conducted of agricultural areas, riparian corridors, core forest, and watershed imperviousness, to more closely examine issues of sustainability. Particular care is taken to make research findings accessible, understandable, and usable for the public through traditional outreach methods, and increasingly through internet mapping technology. As a result, the project has become a widely used resource informing the work of state, regional and local governments, nonprofit organizations, and researchers. A more concerted effort to integrate research and outreach is needed to ensure that land cover research has an impact on issues of land use and sustainability.
Abstract Plant leaf phenology is typically observed either via ground‐based visual observations on individuals or via remote sensing of land surface vegetation. To integrate phenological information from both data sources, collected at different spatial scales using different observational protocols, digital cameras were deployed spanning canopy areas with enough spatial resolution to identify temporal changes in individual deciduous tree species with continuous observations. Comparisons of phenology between camera photography and in situ observations have been reported in prior studies; however, it is still unclear that how these camera images relate to field observations at individual and species levels, and how the metrics from those images provide comparable species‐specific phenological responses to environmental variation. We set a suite of digital time‐lapse cameras to acquire continuous photographs of deciduous tree canopies and conducted ground‐based visual observations in Connecticut, USA, from 2012 to 2014. Comparisons between image‐derived dates and observed phenological dates showed that both green and red color indices could be matched to ground observations, and red color indices showed good performance in matching autumn phenology across our group of eight tree species that dominate the southern New England forests. Linear mixed‐effects models were applied to investigate the relationships between climatic/weather conditions and the timing of peak and of intensity of red color in fall foliage for each species. Model results suggested that temperature, precipitation, drought stress in autumn, and heat stress in summer are all important factors to the timing of peak fall foliage color and that higher minimum temperatures (or lower cold degree‐day accumulation) in the autumn are linked to higher intensity of red coloration at least in sugar maples. This study improves our understanding of temporal and spatial variation in the phenology of deciduous trees captured by digital cameras. As well, this provides insights into relating species‐specific information on phenology from visual observations in the field to near‐surface remote sensing and points to the need for further research on autumn phenology using the change in redness of tree canopies.
This study investigated the upper limit of suspended sediment concentration SSC with respect to the relationship between SSC and reflectance to develop an SSC remote-sensing model for the highly turbid Yellow River. An SSC quantification model was generated by using the spectral mixing index of sediments in water and sediment mixtures. In this study, laboratory experiments were made to measure the spectral curves of sediment-laden water with a high-resolution spectroradiometer. River-bed deposited sediments from two sites, one on the Yellow River at Huayuankou HYK and the other on the Wei River at Yangling YL, and their sand, silt and clay particle groups were used for laboratory experiments to measure the spectral responses of sediment-laden water. The correlation analysis depicted stable correlation between SSC and reflectance at wavelengths ranging from 450 to 1000 nm, in which Spearman rank correlation coefficient rs for all sediments was above 0.7 while rs for the HYK natural sediment exceeded 0.9. Experimental results revealed the curves of the relationship between SSC and reflectance, up to 40 g l−1. A physical-based exponential model > 0.9 at each simulated Landsat band effectively interpreted the relationship between SSC and reflectance. The highest upper limit SSCs at 21 and 15 g l−1 in natural YL and HYK sediments, respectively, were observed in Landsat Band 4. A spectral mixing algorithm was used to build the model and estimate the SSC from reflectance at correlated wavelength bands. The spectral mixing algorithm can generate a uniform model that disregards the effects of sediment type by adopting the reflectance curve at the upper-limit SSC to represent the standard reflectance of sediment. This study is useful in understanding the spectral characteristic of high SSC in water and in applying remote-sensing techniques to monitor SSC in the Yellow River.
Information on land cover is essential for guiding land management decisions and supporting landscape-level ecological research. In recent years, airborne light detection and ranging (LiDAR) and high resolution aerial imagery have become more readily available in many areas. These data have great potential to enable the generation of land cover at a fine scale and across large areas by leveraging 3-dimensional structure and multispectral information. LiDAR and other high resolution datasets must be processed in relatively small subsets due to their large volumes; however, conventional classification techniques cannot be fully automated and thus are unlikely to be feasible options when processing large high-resolution datasets. In this paper, we propose a fully automated rule-based algorithm to develop a 1 m resolution land cover classification from LiDAR data and multispectral imagery.The algorithm we propose uses a series of pixel- and object-based rules to identify eight vegetated and non-vegetated land cover features (deciduous and coniferous tall vegetation, medium vegetation, low vegetation, water, riparian wetlands, buildings, low impervious cover). The rules leverage both structural and spectral properties including height, LiDAR return characteristics, brightness in visible and near-infrared wavelengths, and normalized difference vegetation index (NDVI). Pixel-based properties were used initially to classify each land cover class while minimizing omission error; a series of object-based tests were then used to remove errors of commission. These tests used conservative thresholds, based on diverse test areas, to help avoid over-fitting the algorithm to the test areas.The accuracy assessment of the classification results included a stratified random sample of 3198 validation points distributed across 30 1 x 1 km tiles in eastern Connecticut, USA. The sample tiles were selected in a stratified random manner from locations representing the full range of rural to urban landscapes in eastern Connecticut. The overall land cover accuracy was 93% with accuracies exceeding 90% for deciduous trees, low vegetation, water, buildings, and low impervious cover. Slight confusion occurred between coniferous and deciduous trees; major confusion occurred between water and riparian wetlands; and moderate confusion occurred between medium vegetation and other vegetation classes. The algorithm was robust for the forested suburban landscape of eastern Connecticut, which is typical for much of the northeastern U.S., and the algorithm shows promise for applications in similar landscapes with similar datasets. Further research is needed to test the applicability of the algorithm to more diverse landscapes as well as with different LiDAR and multispectral datasets. (c) 2015 International Society for Photogrammetry and Remote Sensing, Inc. (ISPRS). Published by Elsevier
Landsat 7 enhanced thematic mapper plus (ETM+) satellite imagery is an important data source for many applications. However, the scan line corrector (SLC) failed on 31 May 2003. As a result of the SLC failure, about 22% of the image data is missing in each scene; this is especially pronounced away from nadir. In this article, a local regression method called geographically weighted regression (GWR) is introduced for filling the gaps of the Landsat ETM+ imagery, and it is compared with kriging/cokriging for this purpose. The case studies show that the GWR approach is an effective technique to fill gaps in Landsat ETM+ imagery, although the image restoration is still not perfect. GWR performed marginally better than the complex cokriging method, which too has proven to be an effective method, but is computationally intensive. Although there are visible seam lines at the edges of the filled wide gaps in some bands, the validation results – including RMSE values, error distribution maps, and classification results for the case studies – demonstrate that the DN values estimated by GWR are in fact closer to those of the original image than the corresponding values estimated by kriging/cokriging.
Although removing the pixels covered by contrails and their shadows and restoring the missing information at the locations in remotely sensed imagery are important to understand contrails' effects on climate change, there are no such studies in the current literature. This study investigates the restoration of the missing information of the pixels caused by contrails in multispectral remotely sensed Landsat 5 TM imagery using a cokriging approach. Interpolation results and several validation methods show that it is practical to use the cokriging approach to restore the contrail-covered pixels in the multispectral remotely sensed imagery. Compared to ordinary kriging, the results are improved by taking advantage of both the spatial information in the original imagery and information from the secondary imagery. (C) 2014 Society of Photo-Optical Instrumentation Engineers (SPIE)
The dynamic sediment distribution in large rivers with dams constructed has often been the focus of considerable attention because of their potential adverse environmental impacts. Sedimentation modeling and environmental assessment of man-made projects are often hindered by the lack of sediment measurements with spatial details. This study aimed to investigate the method used to estimate the suspended sediment concentrations (SSCs) from on-site spectral measurements. The study investigated the spectral signature of river water from the natural channel and Sanmenxia Reservoir on the Yellow River. A field spectral survey was conducted trough on-site spectral measurements by using a spectroradimeter and SSC estimation by sampling. Reflectance at 750 nm to 950 nm, with all correlation coefficient (r) between SSC and reflectance > 0.7, seemed to be the appropriate range for SSC estimation. Simulated Landsat Enhanced Thematic Mapper Plus Band 4 (760 nm to 900 nm) was used to build the single band model for estimating SSC. The results confirmed that the exponential model based on the relationship between SSC and reflectance (R-2 = 0.92, root mean square error [RMSE]= 0.241 g/l) was better than the linear model between reflectance and logarithm-transformed SSC (R-2 = 0.90, RMSE = 0.310 g/l). We also applied the Spectral Mixing Algorithm (SMA) from the tank experiment to the on-site spectral measurements. The result showed that the SMA models perfomed as well as the single band exponential model (R-2 = 0.86, RMSE = 0.280 g/l). However, the valid range for application was improved from 1.99 g/l to 347 g/l. This study could provide critical instructional assistance for estimating SSC directly from remote sensing data.
Woody invasive plants are an increasing component of the New England flora. Their success and geographic spread are mediated in part by landscape characteristics. We tested whether woody invasive plant richness was higher in landscapes with many forest edges relative to other forest types and explained land use/land cover and forest fragmentation patterns using socioeconomic and physical variables. Our models demonstrated that woody invasive plant richness was higher in landscapes with more edge forest relative to patch, perforated, and especially core forest types. Using spatially-explicit, hierarchical Bayesian, compositional data models we showed that infrastructure and physical factors, including road length and elevation range, and time-lagged socioeconomic factors, primarily population, help to explain development and forest fragmentation patterns. Our social–ecological approach identified landscape patterns driven by human development and linked them to increased woody plant invasions. Identifying these landscape patterns will aid ongoing efforts to use current distribution patterns to better predict where invasive species may occur in unsampled regions under current and future conditions.
This paper is an exploratory study, which aimed to discover the synergies of data fusion and image segmentation in the context of EO-based rapid mapping workflows. Our approach pillared on the geographic object-based image analysis (GEOBIA) focusing on multiscale, internally-displaced persons' (IDP) camp information extraction from very high spatial resolution (VHSR) images. We applied twelve pansharpening algorithms to two subsets of a GeoEye-1 image scene that was taken over a former war-induced ephemeral settlement in Sri Lanka. A multidimensional assessment was employed to benchmark pansharpening algorithms with respect to their spectral and spatial fidelity. The multiresolution segmentation (MRS) algorithm of the eCognition Developer software served as the key algorithm in the segmentation process. The first study site was used for comparing segmentation results produced from the twelve fused products at a series of scale, shape, and compactness settings of the MRS algorithm. The segmentation quality and optimum parameter settings of the MRS algorithm were estimated by using empirical discrepancy measures. Non-parametric statistical tests were used to compare the quality of image object candidates, which were derived from the twelve pansharpened products. A wall-to-wall classification was performed based on a support vector machine (SVM) classifier to classify image objects candidates of the fused images. The second site simulated a more realistic crisis information extraction scenario where the domain expertise is crucial in segmentation and classification. We compared segmentation and classification results of the original images (non-fused) and twelve fused images to understand the efficacy of data fusion. We have shown that the GEOBIA has the ability to create meaningful image objects during the segmentation process by compensating the fused image's spectral distortions with the high-frequency information content that has been injected during fusion. Our findings further questioned the necessity of the data fusion step in rapid mapping context. Bypassing time-intensive data fusion helps to actuate EO-based rapid mapping workflows. We, however, emphasize the fact that data fusion is not limited to VHSR image data but expands over many different combinations of multi-date, multi-sensor EO-data. Thus, further research is needed to understand the synergies of data fusion and image segmentation with respect to multi-date, multi-sensor fusion scenarios and extrapolate our findings to other remote sensing application domains beyond EO-based crisis information retrieval.
In order to satisfy the humanitarian information demand in ongoing- and post-crisis situations, earth observation (EO) data must be streamed through time-critical workflows. Data fusion serves as an integral segment of EO-based rapid-mapping workflows. Fused images form the basis for manual, semi-, and fully-automated classification steps in the information retrieval chain. Many fusion algorithms have been developed and tested for different remote sensing applications, however, the efficacy of data fusion is weakly assessed in the context of rapid-mapping workflows. In this research, we investigated how different fusion algorithms perform when applied to very high spatial resolution (VHSR) satellite images that encompass ongoing- and post-crises scenes. The evaluation entailed twelve fusion algorithms: Brovey transform, color normalization spectral sharpening (CN) algorithm, Ehlers fusion algorithm, Gram-Schmidt fusion algorithm, high-pass filter (HPF) fusion algorithm, local mean matching algorithm, local mean variance matching (LMVM) algorithm, modified intensity-hue-saturation (HIS) fusion algorithm, principal component analysis (PCA) fusion algorithm, subtractive resolution merge (SRM) fusion algorithm, the University of New Brunswick (UNB) fusion algorithm, and the wavelet-PCA fusion algorithm. These algorithms were applied to GeoEye-1 satellite images taken over three geographical settings representing natural and anthropogenic crises that occurred recently: earthquake-damaged sites in Haiti, flood-impacted sites in Pakistan, and armed-conflicted areas and internally displaced persons (IDP) camps in Sri Lanka. Fused images were assessed for spectral and spatial fidelity using a variety of quantitative quality indicators and visual inspection methods. Spectral quality metrics include correlation coefficient, root-mean-square-error (RMSE), relative difference to mean, relative difference to standard deviation, spectral discrepancy, deviation index, peak-signal-to-noise ratio index, entropy, mean structural similarity index, spectral angle mapper, and relative dimensionless global error in synthesis. The spatial integrity of fused images was assessed using Canny edge correspondence, high-pass correlation coefficient, and RMSE of Sobel-filtered edge images. Under each metric, fusion algorithms were ranked and best competitors were identified. Ehlers, WV, and HPF had the best scores for the majority of spectral quality indices. UNB and Gram-Schmidt algorithms had the best scores for spatial metrics. HPF emerged as the overall best performing fusion algorithm.
Multiresolution segmentation (MRS) has proven to be one of the most successful image segmentation algorithms in the geographic object-based image analysis (GEOBIA) framework. This algorithm is relatively complex and user-dependent; scale, shape, and compactness are the main parameters available to users for controlling the algorithm. Plurality of segmentation results is common because each parameter may take a range of values within its parameter space or different combinations of values among parameters. Finding optimal parameter values through a trial-and-error process is commonly practiced at the expense of time and labor, thus, several alternative supervised and unsupervised methods for supervised automatic parameter setting have been proposed and tested. In the case of supervised empirical assessments, discrepancy measures are employed for computing measures of dissimilarity between a reference polygon and an image object candidate. Evidently the reliability of the optimal-parameter prediction heavily relies on the sensitivity of the segmentation quality metric. The idea behind pursuing optimal parameter setting is that, for instance, a given scale setting provides image object candidates different from the other scale setting; thus, by design the supervised quality metric should capture this difference. In this exploratory study, we selected the Euclidean distance 2 (ED2) metric, a recently proposed supervised metric, whose main design goal is to optimize the geometrical discrepancy (potential segmentation error (PSE)) and arithmetic discrepancy between image objects and reference polygons (number-of segmentation ratio (NSR)) in two dimensional Euclidean space, as a candidate to investigate the validity and efficacy of empirical discrepancy measures for finding the optimal scale parameter setting of the MRS algorithm. We chose test image scenes from four different space-borne sensors with varying spatial resolutions and scene contents and systematically segmented them using the MRS algorithm at a series of parameter settings. The discriminative capacity of the ED2 metric across different scales groups was tested using non-parametric statistical methods. Our results showed that the ED2 metric significantly discriminates the quality of image object candidates at smaller scale values but it loses the sensitivity at larger scale values. This questions the meaningfulness of the ED2 metric in the MRS algorithm’s parameter optimization. Our contention is that the ED2 metric provides some notion of the optimal scale parameter at the expense of time. In this respect, especially in operational-level image processing, it is worth to re-think the trade-off between execution time of the processor-intensive MRS algorithm at series of parameter settings targeting a less-sensitive quality metric and an expert-lead trial-and-error approach.
Areal interpolation is used to transfer attribute data between geographically incongruous zonal systems. Remotely sensed land cover data are widely used in intelligent areal interpolation methods to solve this problem. This article examines the usefulness of different publicly available remotely sensed land cover data sets as ancillary data used in conjunction with different areal interpolation methods. Two land cover data sets were compiled at the national scale; one by the Multi-Resolution Land Characteristics Consortium (the National Land Cover Dataset or NLCD) and one by the Coastal Change Analysis Program. A third land cover data set was compiled at a regional scale for the state of Connecticut by the Center for Land Use Education and Research. Results show that for areal interpolation, greater detail in the classification of developed areas was important whether the data were developed for use at a national or a regional scale. Even more important is the further enhancement of remotely sensed land use categories by incorporating local road or parcel data layers. The worst performing interpolation method using enhanced remote sensing-derived land cover data produced more accurate results than the best performing method using only the original land cover data. The results also show that parcels produce better enhancements than road buffers because they remove the areas of the roads themselves from population consideration.
Remote sensing data can represent various habitat characteristics, and thus can substitute for detailed ground sampling when constructing habitat models. To predict saltmarsh sparrow (Ammodramus caudacutus) distribution and nesting activity, we compared Bayesian hierarchical models in which variables were generated from field or remote sensing data, at a scale of 1-ha plots and at the landscape scale. Field data consisted of plant structure and plant composition variables. Data derived from remote sensing included high and low marsh classifications, LiDAR elevation data, and a classification derived from spectral characteristics specifically associated with saltmarsh sparrow habitat use. The best sparrow presence model used a variable derived from spectral reflectance values associated with plots where sparrows did not occur, indicating that the remote sensing data included additional information about conditions associated with saltmarsh sparrow occurrence than was provided by plant composition, structure, or community classes. In contrast, nest presence was modeled best using vegetation structure variables that required data collection on the ground, although the best remote-sensing model was almost as good. These results reinforce the value of remote-sensing data in habitat modeling, and highlight the need to distinguish between sites that contribute to reproduction and sites where a species is merely present.
Pan-sharpening of moderate resolution multispectral remote sensing data with those of a higher spatial resolution is a standard practice in remote sensing image processing. This paper suggests a method by which the spatial properties of resolution merge products can be assessed. Whereas there are several accepted metrics, such as correlation and root mean square error, for quantifying the spectral integrity of fused images, relative to the original multispectral data, there is less agreement on a means by which to assess the spatial properties, relative to the original higher-resolution, pan-sharpening data. In addition to qualitative, visual, and somewhat subjective evaluation, quantitative measures used have included correlations between high-pass filtered panchromatic and fused images, gradient analysis, wavelet analysis, among others. None of these methods, however, fully exploits the spatial and structural information contained in the original high resolution and fused images. This paper proposes the use of the Fourier transform as a means to quantify the degree to which a fused image preserves the spatial properties of the pan-sharpening high resolution data. A high-resolution 8-bit panchromatic image was altered to produce a set of nine different test images, as well as a random image. The Fourier Magnitude (FM) image was calculated for each of the datasets and compared via FM to FM image correlation. Furthermore, the following edge detection algorithms were applied to the original and altered images: (a) Canny; (b) Sobel; and (c) Laplacian. These edge-filtered images were compared, again by way of correlation, with the original edge-filtered panchromatic image. Results indicate that the proposed method of using FTMI as a means of assessing the spatial fidelity of high-resolution imagery used in the data fusion process outperforms the correlations produced by way of comparing edge-enhanced images.
 James D Hurd合作论文数40
 Sandy Prisloe合作论文数14
 Jason Parent合作论文数Center for Land Use Education And Research;Natural Resources Management and Engineering;University of Connecticut;Center for Land Use Education And Research, University of Connecticut11k a ulbricht合作论文数9h s teotia合作论文数9
 Shlomo Angel合作论文数9W. C. Kennard合作论文数8
 Chester L Arnold合作论文数8Emily Wilson合作论文数8
 Martha S. Gilmore合作论文数Earth & Environmental Sciences, Wesleyan University8
 Ulrich Michel合作论文数7
 John A. Silander合作论文数Department of Ecology and Evolutionary Biology, University of Connecticut7Anna Chabaeva合作论文数7
 Chandi Witharana合作论文数National Undersea Research Center;Department of Marine Sciences;University of Connecticut;National Undersea Research Center, University of Connecticut7MingJun Song (宋明君)合作论文数6Manfred Ehlers合作论文数University of Osnabrueck6
 Chuanrong Zhang合作论文数5Robert G. Cromley合作论文数5Emily Hoffhine Wilson合作论文数5william c kennard合作论文数5Cary Chadwick合作论文数4Nels Barrett合作论文数4Michael W. Lefor合作论文数3karsten schulz合作论文数3Kathleen S. Shields合作论文数3alejandro m blei合作论文数3Nikolakopoulos Konstantinos M合作论文数3
 Yeqiao (Y. Q.) Wang (王野乔)合作论文数Department of Natural Resources Science, College of the Environment and Life Sciences, University of Rhode Island3Laurent R. Bonneau合作论文数3M. P. Prisloe合作论文数3w d heckendorff合作论文数2Yq Wang合作论文数2daxiang zhang合作论文数2
 hermann kaufmann合作论文数2
 Charles Canham合作论文数Cary Institute of Ecosystem Studies2
 Weidong Li合作论文数Department of Geography, College of Liberal Arts and Sciences, University of Connecticut;Center for Environmental Sciences and Engineering, University of Connecticut2Zhenkui Zhang合作论文数2
 Thomas H Meyer合作论文数2
 David J. Travis合作论文数2Melisa Flanagan合作论文数2
 Dean M. Hanink合作论文数2
 David A. Merwin合作论文数2Steven G. Lammey合作论文数2
 David Potere合作论文数Office of Population Research, Princeton University2
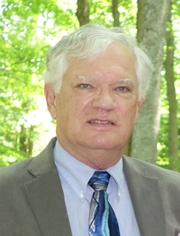 Glenn Warner合作论文数Department of Natural Resources and the Environment, College of Agriculture and Natural Resources, University of Connecticut2
 Harrison Yang合作论文数Department of Natural Resources and the Environment, College of Agriculture, Health and Natural Resources, University of Connecticut2RW KIEFER合作论文数1German Obando-Vargas合作论文数1




