Online dose calculations before radiation treatment have applications in dose delivery verification, plan adaptation, and treatment planning. We propose a novel CBCT imaging pipeline to enhance accuracy. Our approach aims to improve HU accuracy in CBCT images for more precise dose calculations. A quantitative CBCT pipeline was implemented, combining data correction strategies and scatter rejection, achieving high CT number accuracy. We evaluated the pipeline's effect using pelvis anatomy phantoms and found that dosimetric errors in quantitative CBCT-based dose calculations were minimal. In contrast, clinical CBCT and high-performance ASG CBCT-based plans showed significant errors. The proposed quantitative CBCT pipeline offers comparable dose calculation accuracy to the gold-standard planning CT, eliminating the need for density overrides and enabling precise dose delivery monitoring or online plan adaptations in radiation therapy.
An abstract is not available for this content. As you have access to this content, full HTML content is provided on this page. A PDF of this content is also available in through the ‘Save PDF’ action button.
OBJECTIVETo evaluate the feasibility of on-board diffusion-weighted imaging (DWI) with an integrated low-field MRI radiotherapy system to assess responses to neoadjuvant chemoradiation (NAC) in rectal cancer.METHODSA spin echo-based planar imaging diffusion sequence on a 0.35-T MRI radiotherapy system was acquired over the course of NAC. The apparent diffusion coefficients (ADCs) from the tumour regions of interest (ROIs) were calculated. A functional diffusion map (fDM) was created showing a pixelwise ADC analysis of the ROI over the course of treatment. Surgical pathology was correlated with ADC data.RESULTSConsecutive patients treated on a 0.35-T MRI radiotherapy system were evaluated. Patient A had the worst pathological response to NAC with a tumour regression score of 1 and was the only patient with a negative slope in the change of ADC values over the entire course of NAC, and during both the first and second half of NAC. The fDM from the first half of NAC for Patient A showed discrete dark areas in the tumour ROI, reflecting subregions with decreasing ADC values during NAC. Patient C had the most favourable pathological response to NAC with a Grade 3 response and was the only patient who had an increase in the slope in the change of ADC values from the first to the second half of NAC.CONCLUSIONDWI using a low-field MRI radiotherapy system for evaluating the responses to NAC is feasible. Advances in knowledge: ADC values obtained using a 0.35-T MRI radiotherapy system over the course of NAC for rectal cancer correlate with pathological responses.
Surrogate-driven respiratory motion models relate the motion of the internal anatomy to easily acquired respiratory surrogate signals, such as the motion of the skin surface. They are usually built by first using image registration to determine the motion from a number of dynamic images, and then fitting a correspondence model relating the motion to the surrogate signals. In this paper we present a generalized framework that unifies the image registration and correspondence model fitting into a single optimization. This allows the use of 'partial' imaging data, such as individual slices, projections, or k-space data, where it would not be possible to determine the motion from an individual frame of data. Motion compensated image reconstruction can also be incorporated using an iterative approach, so that both the motion and a motion-free image can be estimated from the partial image data. The framework has been applied to real 4DCT, Cine CT, multi-slice CT, and multi-slice MR data, as well as simulated datasets from a computer phantom. This includes the use of a super-resolution reconstruction method for the multi-slice MR data. Good results were obtained for all datasets, including quantitative results for the 4DCT and phantom datasets where the ground truth motion was known or could be estimated.
The primary objective of this phase I study was to assess the feasibility of utilizing a commercially available MRI-guided tri-60Co teletherapy (MRI-guided tri-co60-RT) system for liver SBRT, as determined by the ability to create treatment plans considered dosimetrically comparable to those that could be delivered with a linear accelerator (LINAC). Secondary objectives included determining tumor local control (LC) and the frequency of acute grade 2-5 gastrointestinal toxicity as determined by CTCAE (version 4). Eligible patients had metastatic lesions from another primary site (up to 5 lesions), primary hepatocellular carcinoma, or cholangiocarcinoma and were referred to radiation oncology for liver SBRT. Histologic confirmation of metastases was encouraged but not required. For patients with a single lesion, dose/fractionation regimens included 15 Gy x 3, 16 Gy x 3, and 18 Gy x 3. For patients with multiple lesions, dose/fractionation regimens included 8 Gy x 5, 10 Gy x 5, and 12 Gy x 5. Determination of dose schedule was based on achieving the highest dose while meeting protocol specified normal tissue constraints (adapted from RTOG 1112). LC was defined as stable disease, partial response, or complete response on imaging. Imaging follow-up was based on PET/CT or MRI imaging every 3 months per standard-of-care. Sixteen patients were enrolled on our study from July 2015 to September 2016. Four had HCC, two had cholangiocarcinoma, and ten had hepatic metastases. Eleven patients had a single lesion. Overall, 15 of 16 patients (93.8%) had MRI-guided tri-60Co-RT plans that met our dosimetric constraints. The patient who did not have an acceptable MRI-guided tri-60Co-RT plan also did not have an acceptable LINAC-based plan, so was excluded from the study and treated with a dose-reduced schedule. Twenty lesions were treated in total. The median biologically effective dose (BED, assuming a/b=10) used to treat single lesions was 151 Gy. Among plans in which multiple lesions were treated, the median BED per lesion was 132 Gy. The mean gross tumor volume (GTV) for single lesions was 24.1 ml; when multiple lesions were treated, the mean GTV for each lesion was 8.2 ml. At a median imaging follow-up of 5.8 months, LC was 100%. At a median clinical follow-up of 7.2 months, no grade 2 or higher GI toxicities were seen. Nearly all patients referred to radiation oncology at our institution for liver SBRT were eligible to receive MRI-guided tri-60Co-RT at ablative doses, as defined by having treatment plans that met adapted RTOG 1112 constraints. LC at a median imaging follow-up of nearly 6 months was 100%, and no grade 2 or higher GI toxicities were seen. Future studies will investigate the ability of the MRI-guided RT system to reduce treatment planning margins and safely allow further dose escalation.
Ultrasound contrast imaging could provide a cost effective method of assessing vascular networks in disease progression and treatment monitoring. Previously, it has been shown that large vessels can be distinguished from the microvasculature using ultrasound contrast imaging video data. Our aim was to further this distinction allowing more detailed identification of veins, arteries, arterioles and capillaries. The highly vascularised ovine corpus luteum (CL) was used as large veins and arteries can be imaged at the same time as other vessels and smaller capillaries. SonoVue contrast agent was administered in 2.5ml bolus injections. The perfusion of the CL and surrounding area was observed on a Philips iU22 scanner with a L9-3, linear array probe in contrast imaging mode. Data was stored as DICOM and later processed offline. The time intensity curves and the associated flow parameters were extracted for different regions of interest (2x2 pixel), thus enabling the output of maximum projection maps from each parameter. Principal component analysis (PCA) was used to reduce the dimensionality of this multi-dimensional feature space allowing focus on fewer independent parameters with the largest variance (information). A binary mask identifying larger vessels (from microvasculature) was estimated using the first principal component. Colour Doppler imaging, histological evaluation and the video sequences provided ground truth validation of the vessel types. Time intensity curve characteristics were associated with specific types of vessels with absolute and relative value bounds without the use of set thresholds. For the data presented arbitrary intensity units (AIU) represent pixel intensity. Selection criteria for artery, vein, arterioles and capillary dominated areas were established using PCA along with time intensity curves. Veins present a significant delay in the start of their wash-in phase with the mean normalised time to peak of the intensity curve being 1±0.04s for arteries and 1.23±0.2s for veins and mean normalised wash-in time of 0.9±0.03s for arteries compared to 1.13±0.1s for veins. To identify areas of capillary flow from other vessels the wash-in and wash-out rates were significant indicators with mean normalised wash-in rates for capillaries being 0.3±0.2AIU/s compared to 0.9±0.1AIU/s for arteries and 0.65±0.2AIU/s for veins. For all vessel types the peak intensity and the area under the time intensity curve were significantly different. Domains that present dominant capillary and venule/arteriole flow were possible to identify through the PCA analysis. From 5 individual comparisons, the mean overestimate in Doppler signal compared to the PCA vasculature was 38 ± 11%. Thus estimating a binary mask from the flow parameters extracted from contrast videos can provide information on the micro-vessels as well as more detailed information on the larger veins and arteries compared to current methods. In the regions where smallest identifiable vessels were seen on the maximum projection maps the vessel diameter was calculated to be between 400 – 600μm. Parametric maps based on the flow of ultrasound contrast agent through vessels can provide information on the nature of the vessels within the resolution limit of ultrasound imaging, which is this case is around 300μm. Vessels such as arterioles that are smaller than 100μm, can be identified due to their strong signal and different flow kinetics compared to larger vessels and capillaries. Domains of capillary flow are also clearly defined. Automation of the technique could provide an efficient way of monitoring micro-vessels in a clinical setting. This is desirable in an effort to improve flow quantification, as the physiological state of disease relates directly to micro-flow area and dynamics.
 Daniel Abraham Low合作论文数Department of Radiation Oncology, School of Medicine, University of California45
 James W. Lamb合作论文数33
 Percy Lee合作论文数Department of Radiation Oncology, City of Hope18
 D. O'Connell合作论文数Univ Calif Los Angeles16
 Minsong Cao合作论文数University of California, Los Angeles Health15
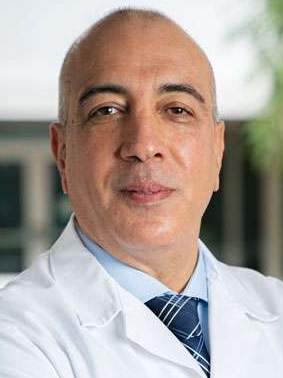 Nzhde Agazaryan合作论文数University of California, Los Angeles Health13Dou Tai H合作论文数11
 Sergio Gaudio合作论文数10Shyam S Jani合作论文数10
 Ke Sheng合作论文数Department of Bioengineering, School of Engineering, University of California, Los Angeles7
 Moyed Miften合作论文数Department of Radiation Oncology, School of Medicine, University of Colorado Anschutz Medical Campus7Y. Yang合作论文数6
 Patrick R. Lowenthal合作论文数University of Colorado Denver6Mitchell Kamrava合作论文数6Yingli Yang合作论文数5Yevgeniy Vinogradskiy合作论文数MD Anderson Cancer Center5
 Anand Santhanam合作论文数Departmentof Radiation Oncology, University of California, Los Angeles5
 Peng Hu合作论文数Department of Bioengineering, School of Engineering, University of California, Los Angeles4
 Jason S. Lewis合作论文数Department of Radiology, Memorial Sloan Kettering Cancer Center;Graduate School of Medical Sciences, Weill Cornell Medicine4
 Amar U. Kishan合作论文数Department of Radiation Oncology, David Geffen School of Medicine, University of California, Los Angeles;Jonsson Comprehensive Cancer Center, University of California, Los Angeles;UCLA Health4
 Hao Gao (高浩)合作论文数上海交通大学生物医学工程学院4
 Dan Ruan合作论文数Department of Radiation Oncology, University of California Los Angeles;Jonsson Comprehensive Cancer Center, UCLA Health4
 Bernard (Tripp) Jones合作论文数Department of Radiation Oncology, School of Medicine, University of Colorado Anschutz4T. Patton合作论文数3J. Ginn合作论文数3L. Yang合作论文数3brian yuhnke合作论文数3Farnoush Forghani合作论文数3Narek Shaverdian合作论文数Department of Radiation Oncology, Memorial Sloan Kettering Cancer Center3Yu Gao合作论文数3
 Mairead Butler合作论文数3
 Karyn A Goodman合作论文数Department of Radiation Oncology, Icahn School of Medicine at Mount Sinai;The Tisch Cancer Institute, Icahn School of Medicine at Mount Sinai3J. Faught合作论文数2Y. Min合作论文数2Timur Alexeev合作论文数Dept Radiat Oncol, Univ Colorado2min cao合作论文数2
 Colin Duncan合作论文数MRC Centre for Reproductive Health, Edinburgh Medical School,The University of Edinburgh2
 Michael Lee Steinberg合作论文数Department of Radiation Oncology, David Geffen School of Medicine, College Division of Life Sciences, University of California, Los Angeles2
 Perperidis Antonios合作论文数Department of Medical Physics and Medical Engineering, University of Edinburgh2
 Altunbas Cem合作论文数Department of Radiation Oncology, University of Colorado School of Medicine2
 Srinivasan Subashini合作论文数2
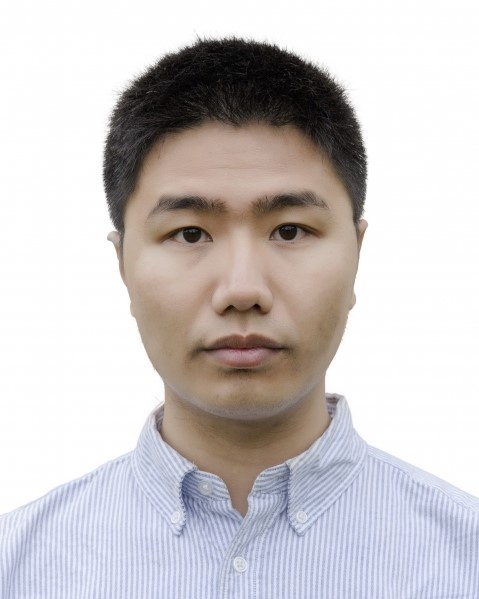 Jiulong Liu (刘九龙)合作论文数State Key Laboratory of Scientific and Engineering Computing, Institute of Computational Mathematics and Scientific Engineering Computing, Academy of Mathematics and Systems Science, Chinese Academy of Sciences2
 Brian Kavanagh合作论文数Department of Radiation Oncology, School of Medicine, University of Colorado Anschutz Medical Campus2White Benjamin合作论文数2
 Daniel T. O’Connor合作论文数Division of Nephrology-Hypertension, University of California, San Diego2
 Vassilis Sboros合作论文数Department of Medical Physics, University of Edinburgh2Quentin Diot合作论文数Department of Physics;University of Colorado;Institute of Standards and Technology;University of Colorado;University of Colorado, University of Colorado2
 Michalakis A. Averkiou合作论文数Department of Bioengineering, University of Washington2




