Because of the ongoing pressure from climate change, there is a greater need for improved crop index insurance systems, and earth observation technology has made this possible. Accordingly, this study aims to develop a novel crop index insurance scheme using an innovative approach of developing a Vegetation Condition Index derived from Enhanced Vegetation Index (VCI-evi) that potentially addresses the limitations of existing products. This study is placed in a widely known drought-affected district of Ethiopia, the Amhara region. The study took advantage of a 16-day composite of MODIS EVI and a well-archived historical (2007-2022) in-situ data on drought prevalence, which is managed by the R4 crop insurance program, one of the well-established insurance schemes at a global scale. Across the study districts, using the VCI-evi variable, drought is predicted at a confidence interval greater than or equal to 99 %. The proposed approach is applied to establish index insurance parameters, notably, trigger and exit thresholds, as well as payout. Due to the wider prevalence of drought, which is strongly predicted and validated, across all the study villages in the years of 2015, 2016, 2018 and 2011, those years were identified as major drought years. Data on farmers' bad years ranking was used to validate and revealed a higher level of agreement with model-predicted drought years. Therefore, the approach which is introduced in this study could be used to design an original index insurance scheme in several drought-prone systems offering increased reliability and enhanced scale-up.
Climate adaptation policies rely on accurate estimates of weather-related impacts on community-level food insecurity. These estimates must capture local livelihoods and their varying sensitivity to climate extremes. This paper develops a novel methodology to address this need through incorporating farmer knowledge into robust drought impact assessments.Using a new dataset of 925 farmer focus groups in Zambia, we investigate whether farmers’ recollection can identify consequential drought events more consistently than crop yields, which are conventionally used for this purpose. Zambia, like many countries, has experienced structural changes in its crop production systems over the last 30 years. Staple crop yields are therefore a weak proxy for food insecurity without wider socio-economic and agricultural context. We posit that in settings like this, farmers’ knowledge can provide the missing context for what constitutes a meaningful climate shock.We conduct a statistical analysis of the dominant patterns of variability in farmers’ recollected drought years as compared to satellite rainfall. We find that farmers’ recall identifies meteorologically consistent patterns in shocks, going back 40 years. In contrast, conventional methods of regressing weather on maize yields to measure shocks would result in estimates that are biased and overconfident. Our analysis demonstrates, for the first time at a national scale, that farmers’ knowledge of climate shocks is a uniquely reliable source of impact data.
IntroductionWeather-based index insurance is a financial instrument which allows smallholder farmers to protect themselves against climate shocks such as droughts and floods. In many cases, insurance indices are based on one or more earth observation datasets (e.g., rainfall, soil moisture, vegetative health) which are partly covering periods of more than 40 years. While remote sensing products and their associated data have improved over this time, understanding the historical climate variability and trends remains an essential piece in ensuring the development of indexes that best represent farmers’ risks. From a practical perspective, shortening time series to limit the risk of understudied climate variability, such as the Atlantic Multidecadal Variability, sometimes seems to be a quick solution. However, shorter time series jeopardize the overall robustness of the index. Therefore, understanding the links between climate variability, index design, and implications for farmers is key. Weather-based index insurance products in Sahelian West Africa usually face a challenge in robustly quantify underlying climatic decadal variation in seasonal rainfall.MethodsThis study analyzes the influence of decadal shifts in rainfall patterns in Sahelian West Africa, in particular Senegal, on index insurance calibration and design, concluding with practical recommendations for the next generation of drought risk finance instruments in the region.ResultsOur findings indicate that decadal variability has not led to a clear decrease in payouts in recent years compared to earlier years, despite an overall increase in seasonal rainfall. Rather, we find that interannual variability has increased which may be a more critical factor for assessing farmers’ agricultural risk than the increase in total rainfall.DiscussionFocusing on key moments of the cropping calendar in the design of an index shows that an increase in the total average rainfall per season does not result in fewer payouts.
Floods cause large losses to property, life, and livelihoods across the world every year, hindering sustainable development. Safety nets to help absorb financial shocks in disasters, such as insurance, are often unavailable in regions of the world most vulnerable to floods, like Bangladesh. Index-based insurance has emerged as an affordable solution, which considers weather data or information from satellites to create a "flood index" that should correlate with the damage insured. However, existing flood event databases are often incomplete, and satellite sensors are not reliable under extreme weather conditions (e.g., because of clouds), which limits the spatial and temporal resolution of current approaches for index-based insurance. In this work, we explore a novel approach for supporting satellite-based flood index insurance by extracting high-resolution spatio-temporal information from news media. First, we publish a dataset consisting of 40,000 news articles covering flood events in Bangladesh by 10 prominent news sources, and inundated area estimates for each division in Bangladesh collected from a satellite radar sensor. Second, we show that keyword-based models are not adequate for this novel application, while context-based classifiers cover complex and implicit flood related patterns. Third, we show that time series extracted from news media have substantial correlation Spearman's rho=0.70 with satellite estimates of inundated area. Our work demonstrates that news media is a promising source for improving the temporal resolution and expanding the spatial coverage of the available flood damage data.
Remotely sensed data have the potential to monitor natural hazards and their consequences on socioeconomic systems. However, in much of the world, inadequate validation data of disaster damage make reliable use of satellite data difficult. We attempt to strengthen the use of satellite data for one application—flood index insurance—which has the potential to manage the largely uninsured losses from floods. Flood index insurance is a particularly challenging application of remote sensing due to floods’ speed, unpredictability, and the significant data validation required. We propose a set of criteria for assessing remote sensing flood index insurance algorithm performance and provide a framework for remote sensing application validation in data-poor environments. Within these criteria, we assess several validation metrics—spatial accuracy compared to high-resolution PlanetScope imagery (F1), temporal consistency as compared to river water levels (Spearman's ρ), and correlation to government damage data (R2)—that measure index performance. With these criteria, we develop a Sentinel-1 flood inundation time series in Bangladesh at high spatial (10 m) and temporal (∼weekly) resolution and compare it to a previous Sentinel-1 algorithm and a Moderate Resolution Imaging Spectroradiometer (MODIS) time series used in flood index insurance. Results show that the adapted Sentinel-1 algorithm (F1avg = 0.925, ρavg = 0.752, R2 = 0.43) significantly outperforms previous Sentinel-1 and MODIS algorithms on the validation criteria. Beyond Bangladesh, our proposed validation criteria can be used to develop and validate better remote sensing products for index insurance and other flood applications in places with inadequate ground truth damage data.
Although farm-level crop yield data is a crucial input in several agricultural applications, it is rarely available, especially in resource-poor production system. This makes the use of satellite technology for yield prediction in complex and smallholder African crop production system an active area of research. This study investigated methods for farm-level winter wheat yield estimation in drought prevalent area of Ethiopia for two study years: 2017 and 2018. The study used Sentinel-2 sensors in multi-temporal setup via applying the vegetation index approach. The potential of three regression approaches: simple linear, full spatio-temporal (trend), and stepwise spatio-temporal was tested. Results showed that the Normalized Difference Vegetation Index (NDVI) variable sum-NDVI, which is the total sum of NDVI values per farm boundary, has a significant association with total yield. The three regression methods showed close prediction capability, nonetheless, the stepwise spatio-temporal (trend) being parsimonious and simple is the best model. The full spatio-temporal (trend) regression with bisquare local basis function showed an increased prediction capability over the gaussian, exp, and Matern32. Composite images compared to single date images showed a slight improvement in terms of prediction capability. Using stepwise spatio-temporal (trend) regression that applied Akaike Information Criterion (AIC), images acquired at the end of heading resulted in a yield predicition capability with an adjusted R2 value of 0.62. Images acquired at the stem elongation stage were the second group showing promising results with an adjusted R2 value of 0.56. Overall, the result of the study was consistent for the two study years and the acceptance of the developed univariate regression equations was validated with correlation accuracy of 0.82 - 0.97, with min-max accuracy of 0.56 - 0.77 and Minimum Absolute Percentage Error as low as 36%. With the free availability of Sentinel-2 images and with the stated potential of yield prediction unleashed, the approach developed here could be applied in similar agroecology for early assessment of farm-level wheat yield for projects of food security and crop insurance among others.
Field-scale prediction methods that use remote sensing are significant in many global projects; however, the existing methods have several limitations. In particular, the characteristics of smallholder systems pose a unique challenge in the development of reliable prediction methods. Therefore, in this study, a fast and reproducible new approach to wheat prediction is developed by combining predictors derived from optical (Sentinel-2) and radar (Sentinel-1) sensors using a diverse set of machine learning and deep learning methods under a small dataset domain. This study takes place in the wheat belt region of Ethiopia and evaluates forty-two predictors that represent the major vegetation index categories of green, water, chlorophyll, dry biomass, and VH polarization SAR indices. The study also applies field-collected agronomic data from 165 farm fields for training and validation. According to results, compared to other methods, a combined automated machine learning (AutoML) approach with a generalized linear model (GLM) showed higher performance. AutoML, which reduces training time, delivered ten influential parameters. For the combined approach, the mean RMSE of wheat yield was from 0.84 to 0.98 ton/ha using ten predictors from the test dataset, achieving a 99% confidence interval. It also showed a correlation coefficient as high as 0.69 between the estimated yield and measured yield, and it was less sensitive to the small datasets used for model training and validation. A deep neural network with three hidden layers using the ten influential parameters was the second model. For this model, the mean RMSE of wheat yield was between 1.31 and 1.36 ton/ha on the test dataset, achieving a 99% confidence interval. This model used 55 neurons with respective values of 0.1, 0.5, and 1 × 10⁻⁴ for the hidden dropout ratio, input dropout ratio, and l2 regularization. The approaches implemented in this study are fast and reproducible and beneficial to predict yield at scale. These approaches could be adapted to predict grain yields of other cereal crops grown under smallholder systems in similar global production systems.
Historical data on flood hazard is critical for the design of climate risk management policies. Parametric weather insurance typically requires at least 20–30 years of historical data for accurate risk pricing. However, the current sources of satellite data on flood inundation in Bangladesh are limited. Although passive microwave (PMW) measurements reach back to 1992, they are imprecise and at coarse spatial resolution (25–3.125km2). Sentinel-1 measurements are more precise (at 10m2 resolution) but are only consistently available from 2017 onwards. We present a method for reconstructing the high-quality signal of Sentinel-1 data for pre-2017 years using its statistical relationship to PMW—a “data fusion” process. Our data fusion is based on a Bayesian Hidden Markov Model (HMM), in which both Sentinel-1 and PMW are modelled as realizations of an unobserved, time-dependent discrete variable representing flood state. Evaluated against the actual Sentinel-1 in Sylhet division, the “fused” data series has a Spearman correlation of 65%. The fused series also has a 71% Spearman correlation with stream gauge measurements of water levels. On both metrics of correlation, the simulated series achieves an improvement over using PMW alone. We discuss how this simulated data could be used to improve parametric flood insurance.
Extreme weather conditions in the face of due to climate change often disproportionately affects the weakest members of society. Agricultural insurance programs that are specifically designed specifically for smallholders in developing countries are valuable tools that can help farmers to cope with the resulting risks. A broad range of methods including household surveys, experimental games, and agent-based models have been used to assess and improve the effectiveness of such climate insurance products. In addition Furthermore, process-based crop models have been used to derive suitable insurance indices. However, climate change raises specific socioeconomic andas well as environmental challenges that need to be considered when designing insurance schemes. We argue that, in light of these pressing challenges, some of the methodological approaches currently applied to study climate insurance reach their limits when applied independently. This has fundamental implications. On the one hand, not all undesired side effects of insurance can be detected and, on the other hand, insurance indices cannot be derived sufficiently well. We therefore advocate a sound combination of different methods, especially by linking empirical analyses and modelling, and underline the resulting potential with the help of stylized examples. Our study highlights how methodological synergies can make climate insurance products more effective in supporting the most vulnerable households, especially under changing climatic conditions.
Though studies showed the potential of high-resolution optical sensors for crop yield prediction, several factors have limited their wider application. The main factors are obstruction of cloud, identification of phenology, demand for high computing infrastructure and the complexity of statistical methods. In this research, we created a novel approach by combining four methods. First, we implemented the cloud restoration algorithm called gapfill to restore missed Normalized Difference Vegetation Index (NDVI) values derived from Sentinel-2 sensor (S2) due to cloud obstruction. Second, we created square tiles as a solution for high computing infrastructure demand due to the use of high-resolution sensor. Third, we implemented gapfill following critical crop phenology stage. Fourth, observations from restored images combined with original (from cloud-free images) values and applied for winter wheat prediction. We applied seven base machine learning as well as two groups of super learning ensembles. The study successfully applied gapfill on high-resolution image to get good quality estimates for cloudy pixels. Consequently, yield prediction accuracy increased due to the incorporation of restored values in the regression process. Base models such as Generalized Linear Regression (GLM) and Random Forest (RF) showed improved capacity compared to other base and ensemble models. The two models revealed RMSE of 0.001 t/ha and 0.136 t/ha on the holdout group. The two models also revealed consistent and better performance using scatter plot analysis across three datasets. The approach developed is useful to predict wheat yield at field scale, which is a rarely available but vital in many developmental projects, using optical sensors.
Despite the frequency and severity of disasters in the insular Caribbean, and in particular the impacts of hydrological/meteorological (‘hydromet’) events, there are relatively few insights into the necessary relevance and scope of disaster preparedness. Such plans should not be limited to evacuation plans, assembling disaster toolkits, and preparing emergency response, but rather widened to include a deeper and more updated awareness of impending disasters and response options, and the timely communication of appropriate climate information. Not only could this facilitate building comprehensive disaster risk resilience but also holistic adaptation strategies by highlighting local vulnerabilities and policy gaps, given the specific challenge of climate change and variability for Caribbean SIDS.This chapter reviews global- and Caribbean-relevant literature regarding disaster risk management and reduction, as well as ongoing strategies and policies. It advocates for a wider appreciation of disaster preparedness strategies, including the utility of enhanced climate information, storm forecasting and hydromet service delivery, as well as improved coordination and communication between and amongst weather, disaster and other national and international agencies and the local public. It also offers a brief review of the detrimental impacts of Tropical Storm Erika in Dominica in August 2015 towards a contextual understanding of disaster risk management lessons learnt and the need for encouraging the improvement and use of climate information within the Caribbean. Such a specific focus on storm disaster preparedness, and in particular that preparedness matters, could assist in channelling more attention to disaster preparedness and resilience strategies, assisting disaster policy directives as well as resource allocation planning within the Caribbean and also other small island states.
<p>Several drought risk financing projects have been developed to strengthen the disaster resilience of the world’s vulnerable communities, countries and regions. Satellite-derived information plays a vital role to characterize historical and current drought impacts. Various independent earth observation datasets can be used to cross-validate each other, strengthening the disaster narrative and reduce basis risk. However, satellite data require additional socioeconomic information, which often shows critical gaps, to close the gap between hazards, vulnerabilities and impacts. While satellite-derived information is considered to be objective there are various projects with payout trigger mechanisms that rely on subjective assessments, for instance expressed as a declaration of emergency. The next generation of risk financing solutions for extreme weather and climate events will have to merge these two perspectives. The World Bank’s Next Generation Drought Index (NGDI) project might be the first attempt to link a convergence of evidence approach applied to satellite-derived insurance triggers with a guided integration of local expertise. The project aims to 1) avoid the perception of more complex technical methods as analytical black boxes 2) benchmark different datasets, model outputs and index parameters, and 3) lower the entry barrier for novel risk financing solutions by establishing local risk ownership. This study focuses on the first results of the NGDI project for Senegal. </p>
West Africa represents a wide gradient of climates, extending from tropical conditions along the Guinea Coast to the dry deserts of the south Sahara, and it has some of the lowest income, most vulnerable populations on the planet, which increases catastrophic impacts of low and high frequency climate variability. This paper investigates low and high frequency climate variability in West African monthly and seasonal precipitation and reference evapotranspiration from the early 1980s to 2016. We examine the impact of those trends and how they interact with payouts from index insurance products. Understanding low and high frequency variability in precipitation and reference evapotranspiration at these scales can provide insight into trends during periods critical to agricultural performance across the region. For index insurance, it is important to identify low-frequency variability, which can result in radical departures between designed/planned and actual insurance payouts, especially in the later part of a 30-year period, a common climate analysis period. We find that evaporative demand and precipitation are not perfect substitutes for monitoring crop deficits and that there may be space to use both for index insurance design. We also show that low yields—aligned with the need for insurance payouts—can be predicted using classification trees that include both precipitation and reference evapotranspiration.
Framed experiments and games are a useful medium to understand how context affects individual and group decision-making. They are particularly relevant for field research in agriculture, where alternative experimental designs can be costly and unfeasible. After a systematic review of the literature, we found that the volume of published studies employing coordination and cooperation games increased during the 2000-2020 period. In recent years, there has been greater attention given to natural resource management, conservation, and ecology areas, especially in strategic regions for agriculture sustainability. Other games, such as trust and risk games, have come to be regarded as standards of framed field experiments in agriculture. Regardless of sectoral focus, most games' results are subject to internal and external validity criticism. In particular, a significant portion of the games showed potential recruitment biases against women and no opportunities for a continued impact assessment. However, games' validity should be judged on a case-by-case basis. Specific cultural aspects of games might reflect the real context, and generalizing games' conclusions to different settings is often constrained by cost and utility. Overall, games in agriculture could benefit from more significant, frequent, and inclusive experiments and data – all possibilities offered by digital technology. Present-day physical distance restrictions may accelerate this shift. New technologies and engaging ways to approach farmers might represent a turning point for games in agriculture in the 21st century.
There is ample evidence about the added-value of anticipatory financing mechanism to mitigate the impact of extreme droughts on the livelihoods of vulnerable communities. Various projects have tried to optimize parametric insurance via different methods, resulting in useful lessons learnt for both macro- and micro-level insurance. In parallel, novel satellite-derived sources of information, such as soil moisture or evaporative stress, have become available to monitor key variables of the hydrological cycle and strengthen the drought narrative via cross-validation. The Next Generation Drought Index project was funded by the World Bank to develop a generic framework and related technical toolbox that allows decision-makers to understand every step of index design, calibration and validation. An interactive dashboard is linked directly to different data sources, the outputs of financial risk models and socioeconomic information to link climate hazard and impact information. Collaboration partners range from African Risk Capacity to the United Nations World Food Programme, the START Network, the World Bank’s Global Index Insurance Facility and the European Space Agency. The overall goal is to reduce basis risk without creating an analytical black box as well as to identify and use ‘low hanging fruits’, such as the detection of early season moisture deficits via remote sensing. The finding from Senegal suggest that the effectiveness of insurance might be improved through client centered design through participatory/crowdsourced processes, a suite of advanced satellite data and models, available government/institutional data and structured decision tree processes based on key performance indicators.
Ground-truthed community-based information over time and space can improve the design of climate risk instruments, reducing the mismatch between farmers' reported events and remote sensing datasets. However, increasing constraints on direct interaction and a lack of incentives for rural communities' participation can compromise crowdsourced verification. To address these issues, we designed a game, KON, that uses "gamified" incentives and behavioral elements to gather accurate historical climate data by priming memory through the pairwise comparisons of years and incentivizing accuracy through a points-reward matching system. Our preliminary results suggest that pairwise comparison can facilitate historical bad years recalling, and there is a high correspondence between farmers reporting and satellite sources. Moreover, farmers' reporting clarifies the story when satellite sources disagree. In addition, the number of responses to the online prototype of the game and the level of participant engagement demonstrated that our game can be easily adapted to different types of weather events and facilitate the collection of a large amount of data in a short amount of time. To adapt and generalize the impact of gamification in diverse agricultural settings, future stages in this project include improve and expand game versions and interphases (i.e., smartphone, SMS), and perform an RCT evaluation for additional hypothesis testing.
We report on a randomized field experiment designed to relax credit and risk constraints for agricultural activities. We conducted a study in a drought-prone region in northern Ethiopia among poor smallholders who depended on rainfed agriculture and were members of the Productive Safety Net Programme (PSNP). Data were collected from over 1100 farmers in 32 rural villages over two years. We find that unconditional voucher transfers designated for the purchase of agricultural inputs significantly increased usage of seeds and fertilizers (a flypaper effect), raised the amount of farmland used (a complementary effect), and induced substitution of own effort by hiring casual labor (a local spillover effect). Subsidized rainfall insurance with reduced input vouchers produced weak average effects but greatly increased investments for farmers who were relatively more patient. We do not find heterogeneous effects by farmers' risk attitudes, however, suggesting that the effects of insurance adoption were mainly determined by how farmers in the safety net made tradeoffs inter-temporally. Insurance demand dropped quickly with the reduction in subsidy and did not correlate with time or risk preference. Therefore, to improve cost-effectiveness, insurance programs should include procedures that help identify forward-looking farmers and encourage their adoption. While our results show that initial subsidies increase future insurance demand, the effect was small and thus initial subsidies would not be a cost-effective mechanism for financially sustainable insurance. Other complementary strategies on the design, promotion, and bundling techniques of insurance would be needed. (C) 2020 Elsevier Ltd. All rights reserved.
 Rahel Diro合作论文数Tetra Tech14
 Jim Hansen合作论文数International Research Institute for Climate and Society, The Earth Institute, Columbia University13
 Markus Enenkel合作论文数Disaster Risk Finance & Insurance Program, World Bank9
 Max Mauerman合作论文数8S. Lucille Blakeley合作论文数8Nicole Peterson合作论文数8
 Vasilaky Kathryn N合作论文数Earth Institute and International Research Institute for Climate and Society, Columbia University8Miguel Carriquiry合作论文数Center for Agricultural and Rural Development;Iowa State University;Center for Agricultural and Rural Development, Iowa State University8Gregory Husak合作论文数Department of Geography, University of California at Santa Barbara7Eric Holthaus合作论文数International Research Institute for Climate and Society Earth Institute;Columbia University7
 Kenneth Shirley合作论文数7Neil Ward合作论文数6
 Calum Turvey合作论文数Charles H. Dyson School of Applied Economics and Management, Cornell SC Johnson College of Business, Cornell University6
 Molly Elizabeth Brown合作论文数Biospheric Sciences Branch, NASA6Megan Mclaurin合作论文数6
 Andrew Robertson合作论文数Department of Earth and Environmental Sciences, Columbia University;International Research Institute for Climate and Society, Columbia University;Columbia Climate School Climate, Earth, And Society, Columbia University6
 Melody Braun合作论文数5mengesha gebremichael合作论文数5
 Jessica L. McCarty合作论文数5
 Rosalind Bark合作论文数School of Environmental Sciences, University of East Anglia5
 Conner Mullally合作论文数Department of Agricultural and Resource Economics, University of California5
 Alessandra Giannini合作论文数International Research Institute for Climate and Society, Earth Institute at Columbia University5
 Bonnie G. Colby合作论文数5
 Marta Vicarelli合作论文数5Malgosia Madajewicz合作论文数5
 Bristol Powell合作论文数4J. Nicolas Hernandez-Aguilera合作论文数4
 Christopher B. Barrett合作论文数Charles H. Dyson School of Applied Economics and Management, Cornell University4
 Madeleine Thomson合作论文数CHICAS Group, Lancaster Medical School, Lancaster University4
 David Zilberman合作论文数Department of Agricultural and Resource Economics, University of California, Berkeley4
 Michael R Carter合作论文数Department of Agricultural & Resource Economics, University of California, Davis4
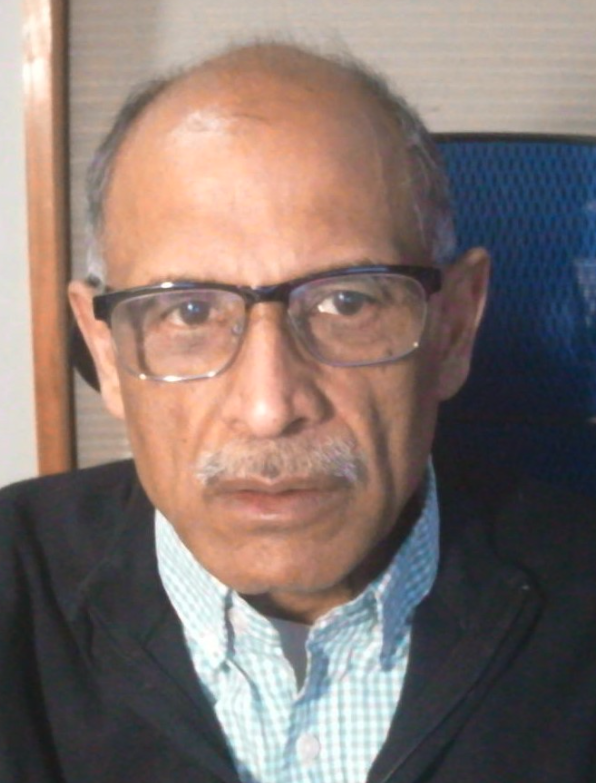 Upmanu Lall合作论文数Department of Earth and Environmental Engineering, Columbia University4
 Walter E. Baethgen合作论文数International Research Institute for Climate and Society, Columbia Climate School, Columbia University4
 Chris Funk合作论文数Climate Hazards Center, University of California, Santa Barbara;Department of Geography, University of California, Santa Barbara4
 Geoffrey R. Mccarney合作论文数4
 Sommarat Chantarat合作论文数Crawford School of Economics and Government, The Australian National University4
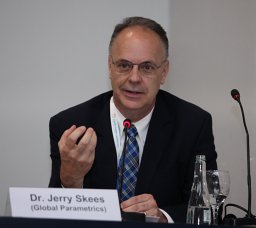 Jerry R. Skees合作论文数GlobalAgRisk , Inc4
 Chris Hain合作论文数Short-term Prediction Research and Transition Center, NASA Marshall Space Flight Center4
 Tufa Dinku合作论文数International Research Institute for Climate and Society, The Earth Institute at Columbia University4
 Valerie Mueller合作论文数University of North Carolina at Chapel Hill4John Del Corral合作论文数International Research Institute for Climate and Society;Columbia University;International Research Institute for Climate and Society, Columbia University4
 Barry J. Barnett合作论文数Department of Agricultural Economics;Mississippi State University;Department of Agricultural Economics, Mississippi State University4h bhojwani合作论文数3
 Mitchell Thomas合作论文数3Ae Lange合作论文数3
 Denyse S. Dookie合作论文数3Carlos Farah合作论文数3
 Paolo Colosio合作论文数3
 Andualem Aklilu合作论文数3




