Secondary organic aerosol (SOA) represents a major component of urban air pollution. This study presents observational evidence from summer 2017 in urban Beijing, supported by model simulations and a case study from summer 2023, demonstrating the crucial role of nighttime organic nitrates (ONs) production in subsequent daytime SOA formation. Our measurements revealed that total reactive nitrogen compound (NO z ) concentrations exceeded 40 ppb at night, resulting from nitrate radical (NO3)-initiated oxidation of volatile organic compounds (VOCs) in the surface layer and through aloft production followed by downward transport. While these NO z existed primarily in the gas phase during nighttime, they underwent atmospheric aging processes the following day, significantly contributing to SOA growth and potentially new particle formation. Model simulations identified reactive terpenoids as the dominant VOC precursors for nighttime ON formation. These findings underscore the need for an improved understanding of nocturnal ONs production mechanisms given their substantial impact on daytime SOA production.
Using machine learning skills, this study evaluated the performance of surface PM2.5 estimation based on the consideration of geostationary satellite AOD having two different spatial resolution. This study targeted two megacities in Korea: Seoul and Busan. We used PM2.5 data from hundreds of low-cost sensors installed in these megacities over a 19-month period (June 2018 to December 2019), combined with 6 & times; 6 km2 (officially released version) and 0.5 & times; 0.5 km2 (research-purpose product) AOD data from the Geostationary Ocean Color Imager (GOCI). Both cross-validation and independent validation against national surface PM2.5 observations (AirKorea) showed improved performance at finer spatial resolution. When our machine-learning PM2.5 estimation using low-cost sensor data was compare to AirKorea data, the 0.5 & times; 0.5 km2 resolution yielded higher R2 and lower RMSE compared to the 6 & times; 6 km2 resolution in both cities; R2 slightly increased from 0.32 (0.44) to 0.38 (0.45) and RMSE decreased from 11.36 (10.18) to 10.82 (10.13) mu g/m3 in Seoul (Busan) at 0.5 & times; 0.5 km2 resolution. When the variable importance is evaluated, 6 & times; 6 km2 AOD contribution is large, but 0.5 & times; 0.5km2 AOD contribution is not significant in the machine learning process. This finding shows that the usage of satellite data having higher spatial resolution results in better performance of PM2.5 estimation in spite of larger uncertainty. In other words, it is expected to achieve better results when more qualified AOD is ready in the future with higher spatial resolution. We also provided estimated PM2.5 in a hourly scale, which is another advantage to use the geostationary satellite AOD.
Underground coal mines are important global sources of methane, but emission estimates are uncertain. We show that emission estimates for individual mines from aircraft remote-sensing surveys in the United States agree within 40% with direct measurements used for national emission reporting (IPCC Tier 3 estimate). Such direct measurements are unavailable in most countries, which rely on estimated emission factors (EFs) applied to coal-production rates. We find that EFs from IPCC Tier 1 and the Model for Calculating Coal Mine Methane (MC2M) methods overestimate U.S. emissions 3-fold due to incorrect dependence on mine depth. An IPCC Tier 2 method using measured basin-specific mine gas content agrees with direct emission measurements but does not account for gob well emissions and requires gas content data that are generally unavailable. We show that aircraft remote sensing for a small sample of mines can successfully estimate basin-specific EFs for ventilation shafts and gob wells, enabling estimates of basin- and national-scale emissions. We discuss how the method can be applied with satellite remote sensing to quantify coal emissions worldwide.
Atmospheric methane concentrations increased at a rate of 0.7% year-1 over 2019-2024, but the causes are unclear. We conducted an analytical inversion of bias-corrected TROPOspheric Monitoring Instrument (TROPOMI) satellite observations to quantify 2019-2024 annual mean methane emissions and hemispheric OH concentrations. We find that the methane rise from 2019 to 2024 reflects an approach to steady state between 2019 sources and sinks (59% of the rise), augmented by increasing emissions (25%) and decreasing OH concentrations (16%). Global emissions increased from 571 teragrams (Tg) per year in 2019 to 601 Tg per year in 2021 and back to 575 Tg per year in 2024. 2019-2024 emission decreases from oil/gas and rice were offset by increases from livestock and waste. East Africa and South America were most responsible for the 2019-2024 increase in emissions. The weaker methane rise over 2022-2024 was driven mostly by increasing OH concentrations rather than decreasing emissions.
The role of tropical wetlands in the recent rise of atmospheric methane remains unclear. Most models find no significant emission trends, partly because wetlands are defined by surface water extent without distinguishing high-emitting inundated vegetation from weakly emitting open water. Here we use 30-m Landsat observations to identify tropical inundated vegetation and combine them with chamber- and flux-tower-derived emission intensities to construct a Wetland Methane Emission Inventory at 0.1° × 0.1° spatial and quarterly temporal resolution for 2004-2023. The quarterly periods are defined as December-February, March-May, June-August, and September-November. We find that tropical wetland methane emissions increased by 16.3 ± 5.1 Tg a-1 over this period, driven by Africa (11.3 ± 3.5 Tg a-1) and Asia (5.0 ± 1.6 Tg a-1), with no net increase from South America. Tropical wetlands account for 21% of the long-term global methane emission increase over 2004-2023 but do not contribute significantly to the 2020-2022 surge. Increases in wetland methane emissions correlate strongly with the expansion of vegetated wetlands.
The African continent has been recognized as a major driver of the recent rise in atmospheric methane, but the causes are not well understood. Here we use blended TROPOMI + GOSAT satellite observations of methane to quantify and attribute African emission trends over August 2018-December 2024. We do this with monthly analytical inversions, optimizing surface fluxes at 50 km resolution on the continental scale and using two alternative bottom-up wetland emission models (WetCHARTs-CYGNSS and LPJ-EOSIM-MERRA2) as prior estimates. Our best estimate of total surface fluxes from Africa over the 2019-2024 period is 71-72 Tg a(-1) depending on the choice of prior wetland emission estimate, including 28-32 Tg a(-1) from wetlands and 23-25 Tg a(-1) from livestock. We find that the bottom-up models greatly underestimate wetland emissions in South Sudan and Lake Chad and greatly overestimate emissions in the Congo Basin. Annual methane surface fluxes from Africa increased by 19-21 Tg a(-1) over 2019-2024, contributing 27 % of the global emission increase in 2019-2021 and continuing to increase after 2021 even as global emissions decreased. The 2019-2024 increase in African emissions included 11 Tg a(-1) from livestock, 4.3-5.7 Tg a(-1) from wetlands, and 2.5-2.8 Tg a(-1) from waste. The increase in livestock emissions was steady while wetland emissions surged in 2020 and 2024. Previous studies attributed uncertainties in bottom-up wetland data to poor information on inundation extent, but we find that the CYGNSS satellite inundation data match the spatial, seasonal, and interannual patterns of our optimized wetland emissions.
Urban areas are major sources of population-driven methane with high potential for mitigation, but emission quantification and sectoral attribution remain uncertain. Using satellite observations and a high-resolution (12 kilometers by 12 kilometers) atmospheric inversion framework, we find that emissions from 12 major US urban areas are 80% higher than the US Environmental Protection Agency Greenhouse Gas Inventory (EPA GHGI), with up to four times higher emissions in Houston but 32 to 37% lower emissions in Los Angeles and Cincinnati. Landfills are the principal cause of inventory underestimates, with city-level management practices driving large variations in per capita emissions. Examination of individual landfills with gas collection systems shows gas collection efficiencies averaging 38% (range: 5 to 90%), much lower than their reported average of 70% (range: 40 to 87%). An exception is Los Angeles, where we find landfill gas collection averaging 85%, suggesting large urban methane mitigation potential through improved landfill management.
Secondary organic aerosol (SOA) represents a major component of urban air pollution. This study presents observational evidence from summer 2017 in urban Beijing, supported by model simulations and a case study from summer 2023, demonstrating the crucial role of nighttime organic nitrates (ONs) production in subsequent daytime SOA formation. Our measurements revealed that total reactive nitrogen compound (NOz) concentrations exceeded 40 ppb at night, resulting from nitrate radical (NO3)-initiated oxidation of volatile organic compounds (VOCs) in the surface layer and through aloft production followed by downward transport. While these NOz existed primarily in the gas phase during nighttime, they underwent atmospheric aging processes the following day, significantly contributing to SOA growth and potentially new particle formation. Model simulations identified reactive terpenoids as the dominant VOC precursors for nighttime ON formation. These findings underscore the need for an improved understanding of nocturnal ONs production mechanisms given their substantial impact on daytime SOA production.
Methane measurements, particularly of natural sources, need to be expanded considerably.
Formerly known as one of the most polluted regions of the globe, East Asia underwent a dramatic improvement of air quality, especially for aerosols, starting in the 2010s. Numerous satellites have observed East Asia for a long time duration, but often with a low spatial or temporal resolution, limiting their ability to capture small-scale variabilities or provide continuous observations of long-range transport of aerosols. In this study, we provide an hourly aerosol optical property (AOP) dataset retrieved from the Korean Geostationary Ocean Color Imager (GOCI), with a high spatial resolution of 2 km at nadir, covering the entire operational period from March 2011-March 2021. The dataset is retrieved using the Yonsei Aerosol Retrieval Algorithm, providing aerosol optical depth (AOD) at 550 nm as the primary product, along with fine mode fraction, single scattering albedo, & Aring;ngstr & ouml;m exponent, and aerosol type as ancillary products. Seasonal validation of AOD against the Aerosol Robotic Network (AERONET) showed that the fraction of data points within the expected error range of 0.05+15 % varied from 56.4 % in June-July-August to 64.5 % in September-October-November, with the mean bias generally within +/- 0.05. Compared to the operational version, the high-resolution product demonstrated improved retrieval capability in the presence of broken clouds, along complex coastlines, and in capturing AOD variability at the sub-district level. The decadal AOD exhibited a decreasing trend over four major cities within the observation domain. We expect this data to be widely used in climate modelling, reanalysis, atmospheric chemistry, marine optics, environmental health studies, variability and trend analysis, contributing to a more comprehensive understanding of the interactions between climate change, trace gases, human health, and AOPs.
Wetlands are the single largest natural source of atmospheric methane (CH _4 ), contributing approximately 30% of total surface CH _4 emissions, and they have been identified as the largest source of uncertainty in the global CH _4 budget based on the most recent Global Carbon Project CH _4 report. High uncertainties in the bottom–up estimates of wetland CH _4 emissions pose significant challenges for accurately understanding their spatiotemporal variations, and for the scientific community to monitor wetland CH _4 emissions from space. In fact, there are large disagreements between bottom–up estimates versus top–down estimates inferred from inversion of atmospheric CH _4 concentrations. To address these critical gaps, we review recent development, validation, and applications of bottom–up estimates of global wetland CH _4 emissions, as well as how they are used in top–down inversions. These bottom–up estimates, using (1) empirical biogeochemical modeling (e.g. WetCHARTs: 125–208 TgCH _4 yr ^−1 ); (2) process-based biogeochemical modeling (e.g. WETCHIMP: 190 ± 39 TgCH _4 yr ^−1 ); and (3) data-driven machine learning approach (e.g. UpCH4: 146 ± 43 TgCH _4 yr ^−1 ). Bottom–up estimates are subject to significant uncertainties (∼80 Tg CH _4 yr ^−1 ), and the ranges of different estimates do not overlap, further amplifying the overall uncertainty when combining multiple data products. These substantial uncertainties highlight gaps in our understanding of wetland CH _4 biogeochemistry and wetland inundation dynamics. Major tropical and arctic wetland complexes are regional hotspots of CH _4 emissions. However, the scarcity of satellite data over the tropics and northern high latitudes offer limited information for top–down inversions to improve bottom–up estimates. Recent advances in surface measurements of CH _4 fluxes (e.g. FLUXNET-CH _4 ) across a wide range of ecosystems including bogs, fens, marshes, and forest swamps provide an unprecedented opportunity to improve existing bottom–up estimates of wetland CH _4 estimates. We suggest that continuous long-term surface measurements at representative wetlands, high fidelity wetland mapping, combined with an appropriate modeling framework, will be needed to significantly improve global estimates of wetland CH _4 emissions. There is also a pressing unmet need for fine-resolution and high-precision satellite CH _4 observations directed at wetlands.
The hydroxyl radical (OH) is the main oxidant in the troposphere and controls the lifetime of many atmospheric pollutants, including methane. Global annual-mean tropospheric OH concentrations ([OH‾]) have been inferred since the late 1970s using the methyl chloroform (MCF) proxy. However, concentrations of MCF are now approaching the detection limit, and a replacement proxy is urgently needed. Previous inversions of GOSAT (Greenhouse Gases Observing Satellite) satellite measurements of methane in the shortwave infrared (SWIR) have shown success in quantifying [OH‾] independently of methane emissions, and observing system simulations have suggested that satellite measurements in the thermal infrared (TIR) may provide additional constraints on OH. Here we combine SWIR and TIR satellite observations from the GOSAT and AIRS instruments, respectively, in a 3-year (2013–2015) analytical Bayesian inversion optimizing both methane emissions and OH concentrations. We examine how much information can be obtained about the interannual, seasonal, and latitudinal features of the OH distribution. We use information from MCF data and the ACCMIP ensemble of global atmospheric chemistry models to construct a full prior error covariance matrix for OH concentrations for use in the inversion. This is essential to avoid an overfitting of the observations. Our results show that GOSAT alone is sufficient to quantify [OH‾] and its interannual variability independently of methane emissions and that AIRS adds little information. The ability to constrain the latitudinal variability of OH is limited by strong error correlations. There is no information on OH at midlatitudes, but there is some information on the NH/SH interhemispheric ratio, showing this ratio to be lower than currently simulated in models. There is also some information on the seasonal variation in OH concentrations, although it mainly confirms the variation simulated by the models.
We quantify weekly methane emissions and trends from oil and gas production in the US Permian Basin for 2019-2023, and in nearby basins for 2022-2023, by analytical inversion of Tropospheric Monitoring Instrument (TROPOMI) satellite observations with the Integrated Methane Inversion (IMI) at 25 km resolution. Permian oil and gas emissions averaged 4.0 ± 1.1 Tg a-1 over 2019-2023, with large seasonal variation but little interannual variability. Methane intensity fell from 5.2 to 3.2% as production surged. Intensity in the New Mexico Permian fell from 4.5 to 2.1%, approaching the state's 2026 target of <2%. Emissions were on average 50 ± 10% higher in winter than summer, which we corroborate with Permian Basin Tower Network measurements, Insight M aircraft data, and GHGSat satellite observations. This seasonality may be driven in part by higher winter emissions from liquid storage tanks due to decreased separator efficiency in cold conditions. Similar but weaker seasonality along with decreasing emissions and intensities is found in weekly inversions for the Anadarko, Barnett, Eagle Ford, and Haynesville basins in 2022-2023. Our work suggests that better weatherization of oil and gas facilities could significantly reduce methane emissions.
We use 2019-2023 TROPOMI satellite observations of atmospheric methane to quantify global methane emissions at monthly 2 degrees x 2.5 degrees resolution with a localized ensemble transform Kalman filter (LETKF) inversion, deriving monthly posterior estimates of emissions and year-to-year evolution. We apply two alternative wetland inventories (WetCHARTs and LPJ-wsl) as prior estimates. Our best posterior estimate of global emissions shows a surge from 560 Tg a-1 in 2019 to 587-592 Tg a-1 in 2020-2021 before declining to 572-570 Tg a-1 in 2022-2023. Posterior emissions reproduce the observed 2019-2023 trends in methane concentrations at NOAA surface sites and from TROPOMI with minimal regional bias. Consistent with previous studies, we attribute the 2020-2021 methane surge to a 14 Tg a-1 increase in emissions from sub-Saharan Africa but find that previous attribution of this surge to anthropogenic sources (livestock) reflects errors in the assumed wetland spatial distribution. Correlation with GRACE-FO inundation data suggests that wetlands in South Sudan played a major role in the 2020-2021 surge but are poorly represented in wetland models. By contrast, boreal wetland emissions decreased over 2020-2023 consistent with drying measured by GRACE-FO. We find that the global seasonality of methane emissions is driven by northern tropical wetlands and peaks in September, later than the July wetland model peak and consistent with GRACE-FO. We find no global seasonality in oil/gas emissions, but US fields show elevated cold season emissions that could reflect increased leakage.
We use satellite observations of atmospheric methane from the TROPOMI instrument to estimate total annual methane emissions for 2019–2023 from four large Southeast US landfills with gas collection and control systems. The emissions are on average 6× higher than the values reported by the landfills to the US Greenhouse Gas Reporting Program (GHGRP) which are used by the US Environmental Protection Agency for its national Greenhouse Gas Inventory (GHGI). We find increasing emissions over the 2019–2023 period whereas the GHGRP reports a decrease. The GHGRP requires gas-collecting landfills to estimate their annual emissions either with a recovery-first model (estimating emissions as a function of methane recovered) or a generation-first model (estimating emissions from a first-order decay applied to waste-in-place). All four landfills choose to use the recovery-first model, which yields emissions that are one-quarter of those from the generation-first model and decreasing over 2019–2023, in contrast with the TROPOMI observations. Our TROPOMI estimates for two of the landfills agree with the generation-first model, with increasing emissions over 2019–2023 due to increasing waste-in-place or decreasing methane recovery, and are still higher than the generation-first model for the other two landfills. Further examination of the GHGRP emissions from all reporting landfills in the US shows that the 19% decrease in landfill emissions reported by the GHGI over 2005–2022 reflects an increasing preference for the recovery-first model by the reporting landfills, rather than an actual emission decrease. The generation-first model would imply an increase in landfill emissions over 2013–2022, and this is more consistent with atmospheric observations.
Free tropospheric (FT) nitrogen dioxide (NO2) plays a critical role in atmospheric oxidant chemistry as a source of tropospheric ozone and of the hydroxyl radical (OH). It also contributes significantly to satellite-observed tropospheric NO2 columns, which should be considered when using these columns to quantify surface emissions of nitrogen oxide radicals (NOx ≡ NO + NO2). But large uncertainties remain in the sources and chemistry of FT NO2 because observations are sparse. Here, we construct a cloud-sliced FT NO2 (700 to 300 hPa) product from the Tropospheric Emissions: Monitoring of Pollution (TEMPO) geostationary satellite instrument over North America. This product provides higher data density and quality than previous products from low Earth orbit instruments, including the first observations of the FT NO2 diurnal cycle in different seasons. Combined with coincident observations from the Geostationary Lightning Mapper, the TEMPO data imply that lightning is the dominant source of FT NOx in nonwinter seasons. Comparison of TEMPO FT NO2 data with the Goddard Earth Observation System-Composition Forecasts (GEOS-CF) atmospheric chemistry model shows overall consistent magnitudes, seasonality, and diurnal variation, with a midday minimum in nonwinter seasons from photochemical loss. However, there are major discrepancies that we attribute to GEOS-CF's use of a standard cloud-top-height-based scheme for the lightning NOx source. We find that this scheme underestimates offshore lighting flash density and misrepresents the diurnal cycle of lightning over land. Our FT NO2 product provides a unique resource for improving the lightning NOx parameterization in atmospheric models and the ability to use NO2 observations from space to quantify surface NOx emissions.
Urban areas are major sources of methane due to population needs for landfills, natural gas distribution, wastewater treatment, and residential combustion. Here we apply an inversion of TROPOMI satellite observations of atmospheric methane to quantify and attribute annual methane emissions at 12x12 km2 resolution for 12 major US urban areas in 2022. The US Environmental Protection Agency Greenhouse Gas Inventory (EPA GHGI) is used as prior estimate. Our results indicate that the GHGI underestimates methane emissions by 80 most urban areas, except Los Angeles and Cincinnati where emissions are overestimated by 32 observations in the Northeast Corridor and Los Angeles. Landfills are the principal cause of urban emission underestimates, with downstream gas activities contributing to a lesser extent than previously found. Examination of individual landfills other than in Los Angeles shows that emissions reported by facilities with gas collection and control systems to the Greenhouse Gas Reporting Program (GHGRP) and used in the GHGI are too low by a factor of 4 when using the prevailing recovery-first reporting method. This is because GHGRP-estimated gas collection efficiencies (average 70 much higher than inferred from our work (average 38 landfills have much higher collection efficiencies (average 78 in our work) than elsewhere in the US, suggesting that operational practices there could help inform methane mitigation in other urban areas.
 Melissa Sulprizio合作论文数Harvard University, Harvard University105
 Jennifer Logan合作论文数Harvard School of Engineering and Applied Science94
 Hanwant B. Singh合作论文数Atmospheric Science Branch, NASA Ames Research Center88
 Loretta J. Mickley合作论文数John A. Paulson School of Engineering and Applied Sciences, Harvard University;Atmospheric Chemistry Modeling Group, Harvard University85
 Robert M. Yantosca合作论文数84
 Joannes D. Maasakkers合作论文数SRON Netherlands Institute for Space Research66
 Donald R. Blake合作论文数Department of Chemistry, School of Physical Sciences, University of California, Irvine;Department of Earth System Science, School of Physical Sciences, University of California, Irvine63
 Paul Palmer合作论文数Global Change, School of GeoSciences, The University of Edinburgh62
 John Worden合作论文数Jet Propulsion Laboratory, California Institute of Technology57
 Robert M. Malina合作论文数51
 Randall Martin合作论文数Center for Aerosol Science and Engineering, Department of Energy, Environmental, and Chemical Engineering, McKelvey School of Engineering, Washington University in Saint Louis50
 Colette L. Heald合作论文数Civil and Environmental Engineering, School of Engineering, Massachusetts Institute of Technology/Earth, Atmospheric and Planetary Sciences, School of Science, Massachusetts Institute of Technology49Glen W Sachse合作论文数49
 Arlene M. Fiore合作论文数Department of Earth, Atmospheric, and Planetary Sciences, Massachusetts Institute of Technology;Center for Global Change Science, Massachusetts Institute of Technology49
 Bill Munger合作论文数John A.Paulson School of Engineering and Applied Sciences, Harvard University48
 Rokjin Park合作论文数School of Earth and Environmental Sciences, Seoul National University;Atmospheric Chemistry Modeling Group, Seoul National University46
 Mathew J Evans合作论文数44
 David Streets合作论文数Harvard John A. Paulson School of Engineering and Applied Sciences43Isabelle Bey合作论文数43Tia R. Scarpelli合作论文数42
 Daniel J. Varon合作论文数Sch Engn & Appl Sci, Harvard Univ42
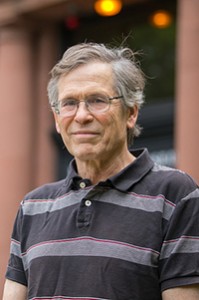 Steven Wofsy合作论文数Department of Earth and Planetary Sciences, Harvard John A. Paulson School Of Engineering And Applied Sciences, Harvard University42
 Robert Talbot合作论文数Department of Earth and Atmospheric Sciences, College of Natural Sciences and Mathematics, University of Houston42
 Jenny A. Fisher合作论文数Ctr Atmospher Chem, Univ Wollongong41Brian G. Heikes合作论文数Graduate School of Oceanography, University of Rhode Island41
 Qinbin Li合作论文数Institute of the Environment & Sustainability, University of California, Los Angeles;Department of Atmospheric and Oceanic Sciences, University of California, Los Angeles40
 Glen W. Sachse合作论文数40
 Lu Shen合作论文数39R. C. Hudman合作论文数38
 Lyatt Jaeglé合作论文数Department of Atmospheric Sciences, University of Washington38
 Jack Dibb合作论文数Earth Systems Research Center, Institute of Earth, Oceans and Space, University Of New Hampshire38
 Katherine R. Travis合作论文数Langley Res Ctr, NASA37
 William H. Brune合作论文数Department of Meteorology and Atmospheric Science, College of Earth and Mineral Sciences, Pennsylvania State University37
 Hong Liao (廖宏)合作论文数School of Environmental Science and Engineering, Nanjing University of Information Science and Technology35
 Elsie Sunderland合作论文数Department of Earth and Planetary Sciences, Faculty of Arts and Sciences, Harvard University35K. Chance合作论文数34
 Xiao Lu (卢骁)合作论文数School of Atmospheric Sciences, Sun Yat-Sen University34
 A. Anthony Bloom合作论文数34
 Kevin Bowman合作论文数Jet Propulsion Laboratory, California Institute of Technology33
 Kelly Chance合作论文数Smithsonian Astrophysical Observatory, Harvard-Smithsonian Center for Astrophysics;Atomic and Molecular Physics Division, Harvard-Smithsonian Center for Astrophysics;Center for Astrophysics, Harvard-Smithsonian Center for Astrophysics32
 James Crawford合作论文数Langley Research Center, National Aeronautics and Space Administration32
 Henry E. Fuelberg合作论文数Department of Meteorology, Florida State University31
 Michael R. Hoffmann (迈克尔·霍夫曼)合作论文数Department of Environmental Science and Engineering, Division of Engineering and Applied Science, California Institute of Technology31
 Jianxiong Sheng合作论文数Center for Global Change Science,MIT31
 Yuzhong Zhang (张羽中)合作论文数Atmospheric Environment Research Group, School of Engineering, Westlake University30
 Lei Zhu (朱雷)合作论文数School of Environmental Science and Engineering, College of Engineering, Southern University of Science and Technology30
 Sebastian D. Eastham合作论文数Lab Aviat & Environm, MIT29
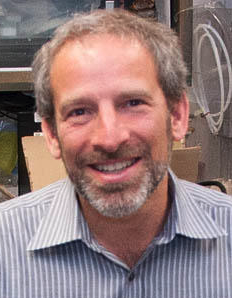 Ronald C. Cohen合作论文数Department of Chemistry, College of Chemistry, University of California, Berkeley;Department of Earth & Planetary Science, University of California, Berkeley;Energy and Environment Technologies Division, LBNL29
 Eloise Marais合作论文数Department of Geography, University College London29




